

Understand search
This guide is for security analysts who want to query, correlate, and analyze security data across their enterprise within Google Security Operations using the SIEM Search page. The SIEM Search page serves as your central navigation hub across all supported data streams, and it integrates additional telemetry and posture sources. This guide contains instructions and explanations of all the basic functions and features of the SIEM Search page.
Key terminology
- Unified Data Model (UDM): A standardized data format used within Google SecOps to represent security events from various sources consistently.
- Event: An event is generated from a raw log source that is ingested into Google SecOps and processed by Google SecOps's ingestion and normalization process. Multiple events can be generated from a single raw log source record. An event represents a set of security-relevant data points that are generated from that raw log. In the context of the SIEM Search page, events are normalized UDM event telemetry and raw log records matching your search query.
- Alert: In the context of the SIEM Search page, an alert is defined as a rule detection with alerting enabled. To learn more, see running a rule against live data.
- Raw logs: Raw, unparsed log telemetry. The primary diagnostic objective is monitoring ingestion and parsing health.
- Joins: Joins correlate and combine raw data from multiple sources based on common field values. By linking related events, entities, and other data, you can investigate complex attack scenarios. You can search for statistical joins, which require a match section to aggregate results–or data joins, which retrieve the complete event or entity data and display them without any aggregation. For more information, see Apply joins in search and dashboards and Implement joins without a match section.
- Statistics: UDM events with the results grouped for statistical analysis. For more information, see Analyze search data with statistics.
- Cases and case histories: Security cases and historical case audit logs, which you can correlate with other security data. For more information, see Search cases overview.
- Natural language query bar: The bar at the top of the SIEM Search page, where you can enter a search statement using natural language.
- Query editor: The box on the SIEM Search page below the natural language query bar, where you manually construct queries and where the query code is displayed.
Before you begin
You must have the standard Google SecOps Search permissions and roles assigned to your user account to execute queries and view detection details.
For the following advanced search features, your user account or Identity and Access Management role must have additional granular permissions, depending on the feature used:
- Enriched or extended event details need
chronicle.events.fetchEnrichedEvent. - Saving searches and editing search views needs
chronicle.savedSearches.updateandchronicle.searchViews.update. - Viewing log parsers and schema needs
chronicle.parsers.listandchronicle.parsers.get. - Searching Case History needs
chronicle.cases.getandchronicle.cases.list. - Creating, sharing, modifying, and managing saved custom column sets across your organization needs all five of the following permissions:
chronicle.googleapis.com/savedColumnSets.create,chronicle.googleapis.com/savedColumnSets.update,chronicle.googleapis.com/savedColumnSets.delete,chronicle.googleapis.com/savedColumnSets.list, andchronicle.googleapis.com/savedColumnSets.get.
Open the Search page
To open the SIEM Search page, do the following:
- Log in to Google SecOps.
- On the navigation bar, click Investigation > SIEM Search.
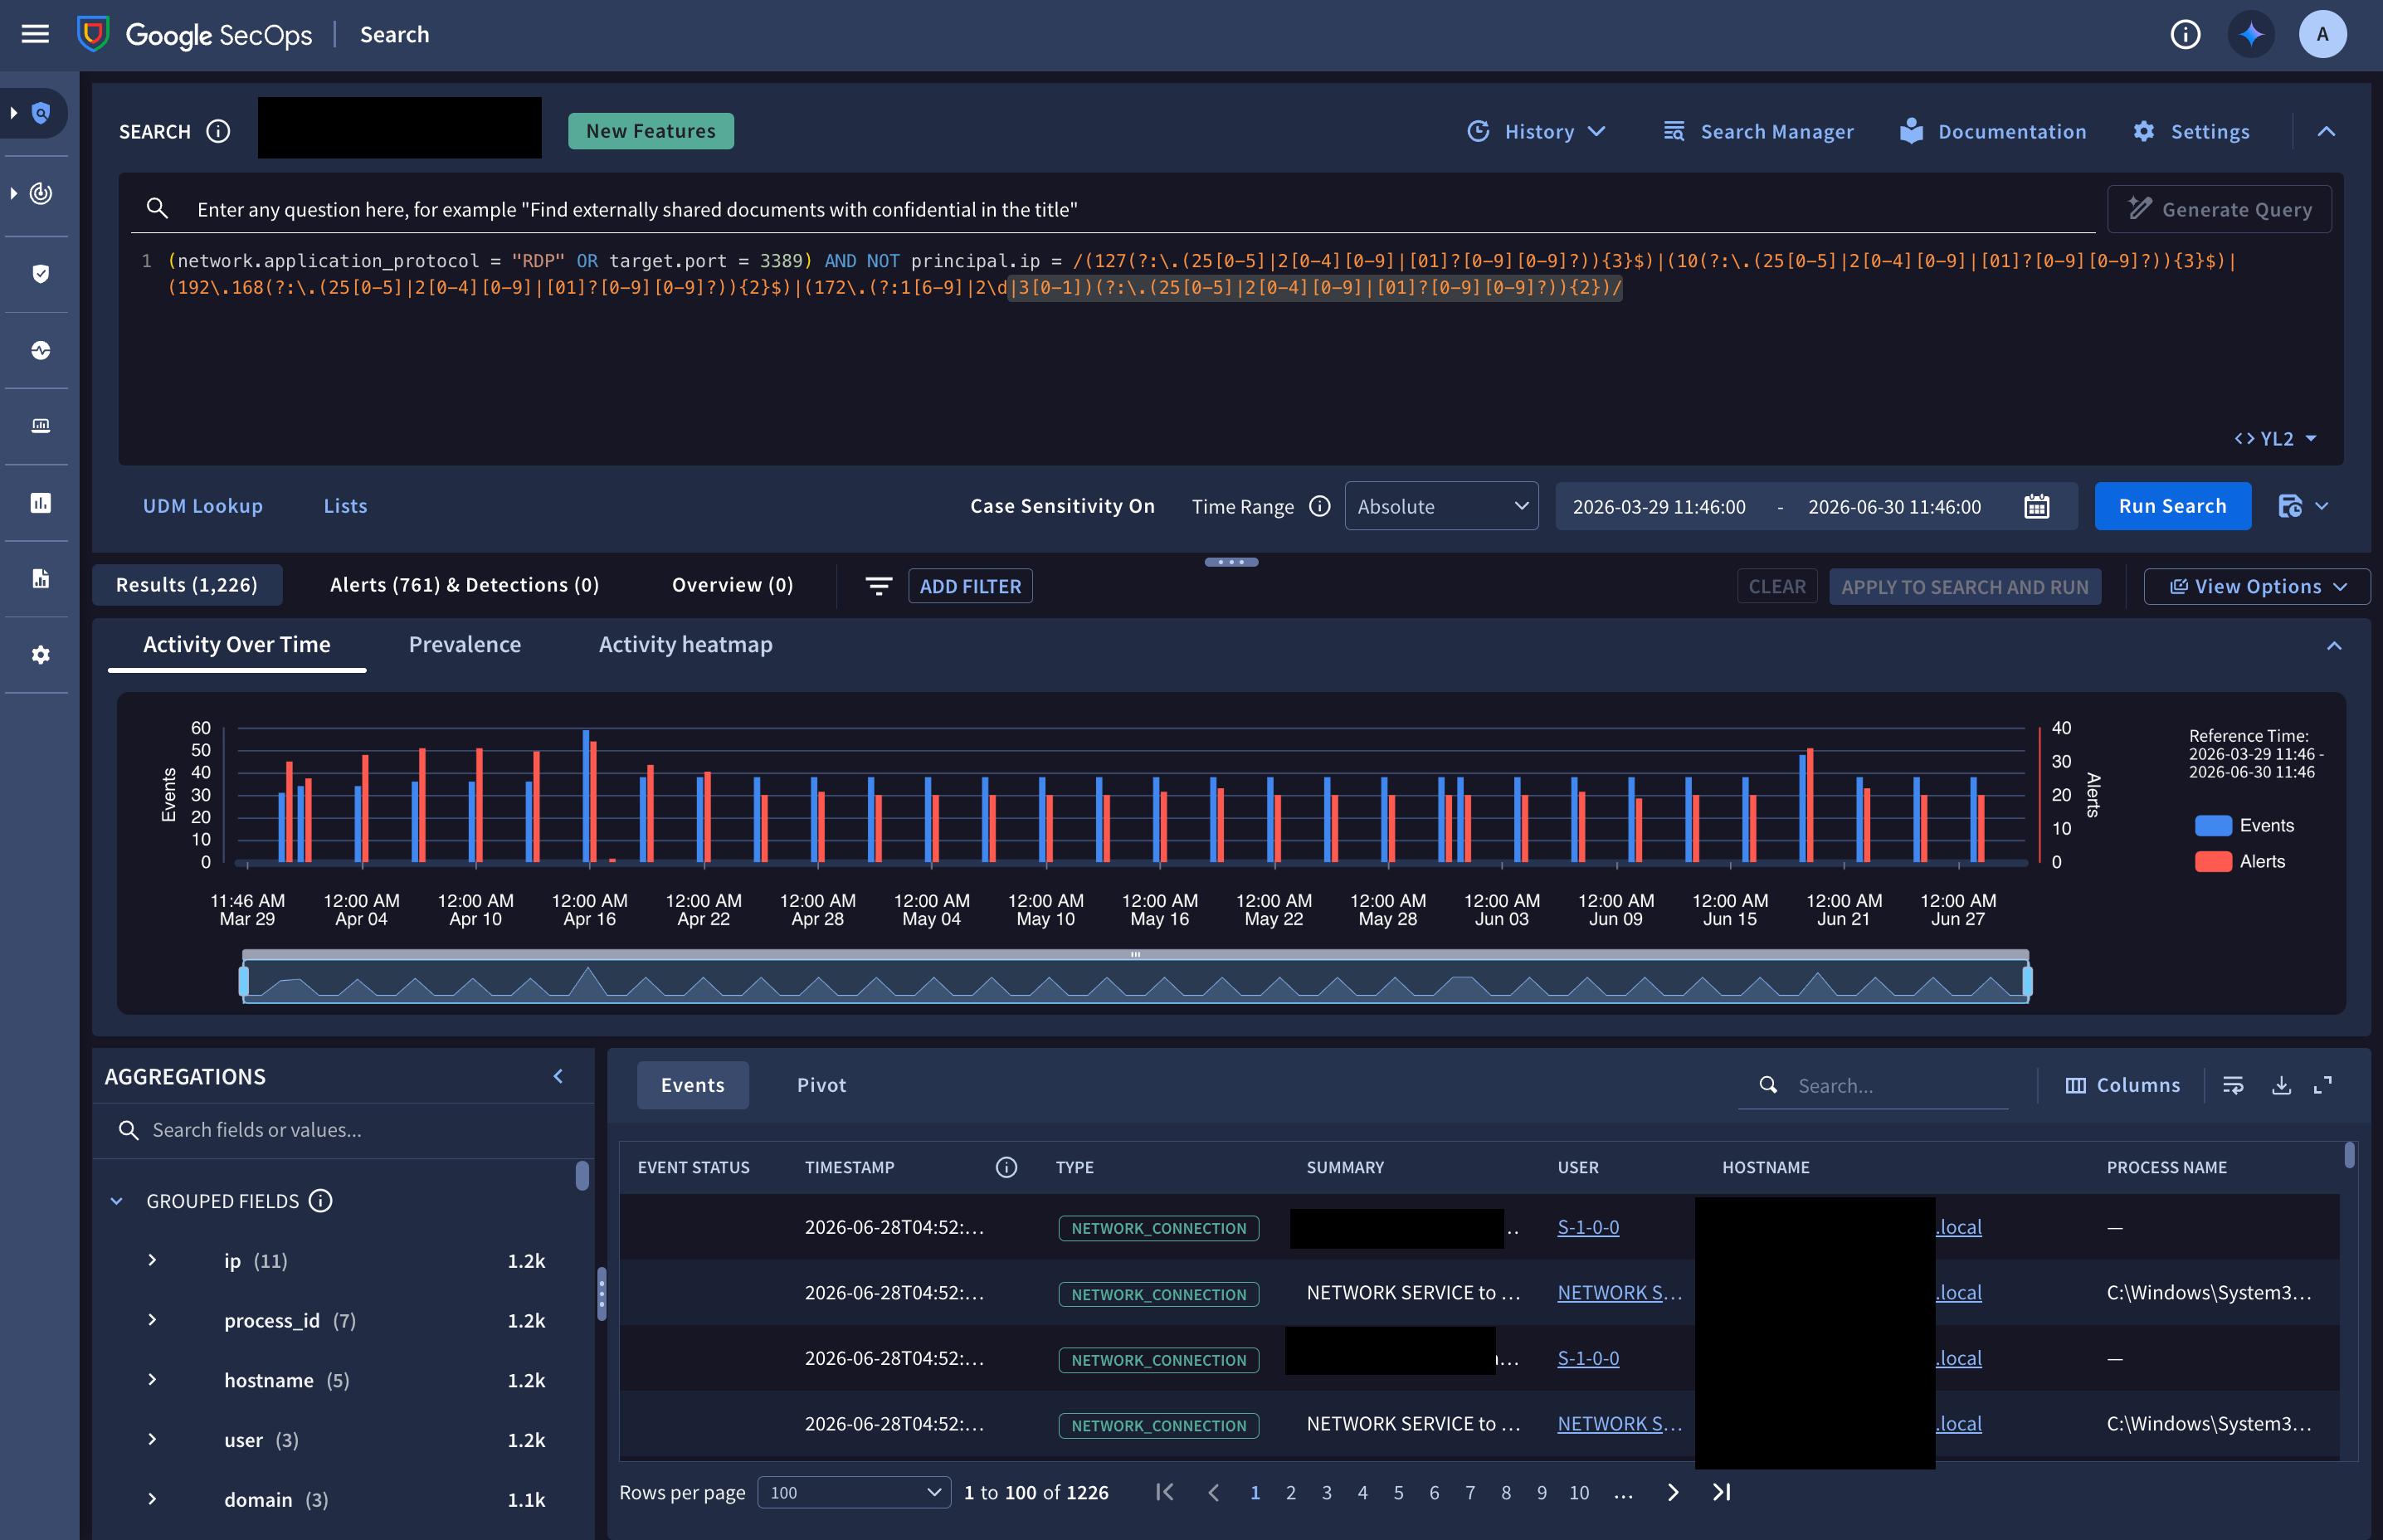
Figure 1. Example of the SIEM Search page used to explore event trends.
Data RBAC scope enforcement
The Google SecOps Search engine strictly enforces Role-Based Access Control (data RBAC) scope filtering across all tabs. You will only see UDM events, raw logs, alerts, detections, and cases that explicitly match the data scopes assigned to your user role.
Configure general settings for the Search page
The general settings of the SIEM Search page are user-specific.
You can configure the following general settings for the SIEM Search page:
Specify the maximum number of search results
To specify the maximum number of search results, do the following:
- On the SIEM Search page, click settings Settings, and select Maximum Results.
Select the Max Results to Return option. The options are
1k,30k,100k,1Mandcustom(which can take values between1and1M). The default value is30k.Click Apply.
Choose the collapse behavior of the query editor
You can configure the query editor to collapse automatically after you run a search—to maximize the screen space available for viewing your search results. The Default setting leaves the query editor expanded after running a search.
To enable the auto-collapse feature, follow these steps:
- On the SIEM Search page, click settings Settings, and select Query Editor.
- In the Query Editor dialog, select Auto-Collapse Query Editor.
Create a search query
The following sections describe how to create a search query.
You can create a search query using one of the following methods:
- Enter your search statement in natural language and use Gemini to generate the query in the YARA-L 2.0 dialect. You must use English.
- Manually construct your query in the query editor using either the YARA-L 2.0 or the SQL (GoogleSQL) dialect.
Generate a query using natural language
To generate a query using natural language, complete the following steps:
On the SIEM Search page, click the search natural language query bar and enter a search statement in English.
The following statements are examples that might generate a useful search:
- network connections from 10.5.4.3 to google.com
- failed user logins over the last 3 days
- emails with file attachments sent to john@example.com or jane@example.com
- all Cloud service accounts created yesterday
- outbound network traffic from 10.16.16.16 or 10.17.17.17
- all network connections to facebook.com or tiktok.com
- service accounts created in Google Cloud yesterday
- Windows executables modified between 8 AM and 1 PM on May 1, 2026
- all activity from winword.exe on lab-pc
- scheduled tasks created or modified on exchange01 during the last week
- email messages that contain PDF attachments
- emails sent by or sent from admin@acme.com on July 1
- any files with the hash 44d88612fea8a8f36de82e1278abb02f
- all activity associated with user "sam@acme.com"
- yesterday
- within the last 5 days
- on July 1, 2026
Click Generate Query. If Gemini can interpret the search statement, Gemini generates a valid query in the YARA-L 2.0 dialect and displays it in the query editor. If the search statement can't be interpreted, you see a message asking you to try asking in a different way. If the query expression is valid, the Run Search button becomes available.
Optional: Adjust the search time range using the Time Range parameters.
Click Run Search. The search results are displayed.
Optional: Narrow the results by adding additional search filters manually or using the natural language query bar and run the search again.
If the search statement includes a time-based term, the Time Range parameters are automatically adjusted to match. For example, this would apply to searches with the following terms:
Construct a query manually in the query editor
For information about the different types of queries that the SIEM Search page supports and the syntax for constructing them, see the following documents:
- For details about the YARA-L 2.0 search syntax, see Understand search syntax.
- For information about constructing Join queries, see Apply joins in search and dashboards and Implement joins without a match section.
- For information about constructing statistical (STATS) queries, see Analyze search data with statistics.
- For information about constructing Case History queries, see Search cases and case history from the Search page.
To construct a query manually, complete the following steps:
- On the SIEM Search page, click in the query editor.
- Choose the query dialect:
- YL2 (default): Use standard YARA-L 2.0 syntax for high-speed event hunting, entity filtering, and behavioral correlation.
- SQL: SQL (GoogleSQL) mode lets you execute BigQuery-compatible queries, build complex multi-table joins across UDM and Entity Context Graph (ECG), and perform advanced aggregations directly in the console.
Type your query in the query editor and take the following into consideration:
- Automatic suggestion and completion: As you type a query with the YL2 option, the automatic suggestion and completion feature suggests valid fields based on your input.
- UDM Lookup: If you don't know the exact field name or value when writing a query, you can use UDM Lookup to help.
- Syntax compilation errors: If the query editor detects a syntax compilation error, it displays a red squiggly line directly beneath the problematic text. Hover over the underlined text to view the specific error description. The query editor highlights only one error at a time, which means that you must fix errors sequentially.
Set the time range for the query using the Time Range parameters.
If the query expression is valid, click Run Search. The search results are displayed.
Optional: Narrow the results by adding additional search filters manually or using the console and run the search again.
Specify the time period for your search
Use the Time Range menu to specify the time period for your search.
The maximum time range of a search is always bounded by your tenant's log-retention configuration.
Maximum time ranges:
- UDM: 365 days.
- RAW: 365 days.
- JOIN: For inner joins: 90 days. For inner joins without a match condition: 14 days. For outer joins: 14 days.
- STATS: 90 days.
- CASE and CASE HISTORY: 90 days, bounded by case retention limits or a full case-history lifecycle.
Google SecOps evaluates the configuration of your search query and applies the maximum time range based on the search type and the search conditions. (For example, a STATS query that includes an outer join will have a maximum time range that is smaller than a STATS query that doesn't include an outer join.)
To set the time range, do the following:
On the SIEM Search page, next to Time Range, from the list, select the mode
- Absolute: Use an absolute time range to select a fixed start and end time.
- Relative: Use a relative time range to search backwards from the current time. The time when you click Run Search is set as the end time for your query.
If you selected Absolute, do the following:
- Click calendar_month calendar to open the Set Date and Time Range dialog.
- Do one of the following:
- To configure the time using one of the following methods, select the Range tab:
- Use presets: Select a preset range from the sidebar, such as Last 3 Days or All Time. All Time searches over your entire retention period.
- Select dates: Click a start date and an end date on the calendar.
- Set times: Select specific times using the time menus below the calendars.
- To specify a date and time range based on an event, click the Event Time tab, select a date on the calendar, and configure the timeframe:
- Exact time: Click the Event field to select or enter the specific time the event occurred.
- Time buffer: Select a predefined time range from the list.
- To configure the time using one of the following methods, select the Range tab:
- Click Apply.
If you selected Relative, do the following:
- Enter an integer in the text field.
- Select a time unit from the menu: Seconds, Minutes, Hours, Days, Weeks, Months, or Years.
Use auto-suggestions to build queries
When you write a query, the query editor provides automatic suggestions to help you build the query efficiently.
Navigate and select suggestions
As you type, a list appears with field suggestions matching your text, which include the following options:
- Select a field: Use the Up or Down arrow keys to navigate the list, and press Enter to select a field.
- View metadata: After you use the Up or Down arrow keys to highlight a suggestion, click chevron_right to view the field description.
- Complete fields incrementally: The editor suggests the immediate children of the current field and hides the typed prefix to save screen space. These suggestions are followed by all other matching fields in alphabetical order.
- Complete operators and values: After you select a field, the editor suggests
valid operators (such as
=,!=) based on the field's data type. For enumerated fields, the editor displays suggestions for all valid values (for example,NETWORK_EVENT) after you type an operator and a double quote (").
Understand suggestion ranking
The query editor organizes suggestions into three categories to help you find fields quickly:
- Recently used fields: The top seven suggestions are based on fields you have used recently that match your typed field. This list is saved in your browser session history across the SIEM Search, Rules & Detections, and Dashboards pages. Clearing your cache or switching browsers resets this history.
- Immediate children: The next set of suggestions displays only the first-level children of the current field.
- Global matches: The final section displays all matching fields alphabetically.
Manage auto-suggestion settings
To globally manage how Google SecOps displays automatic suggestions, do the following:
Click your profile avatar and select User Preferences from the list. The User Preferences dialog appears.
In the dialog, click Autosuggestion.
To control the auto-suggestions shown in the query editor, adjust the following settings:
- Enable suggestions while typing: Enables auto-suggestion.
- Rank recently used fields first: Displays your most recently used fields at the top of the list
- Suggest immediate child fields: Completes nested fields incrementally, one child node at a time.
- Suggest all available paths: Displays the full, expanded paths for all nested field suggestions
Click Save.
Find a UDM field for a search query (UDM Lookup)
When writing a search query, you might not know the exact UDM field name or value to include. The UDM Lookup feature lets you quickly find a UDM field name that contains a text string in the name or that stores a specific string value. You can select one or more results that UDM Lookup returns and use the results as a starting point for a search query, append the results to an existing query, or save the results to the clipboard.
To use UDM Lookup, do the following:
On the SIEM Search page, click UDM Lookup. The UDM Lookup dialog opens.
Select one or both of the following Match On options, to specify the scope of data to search:
- UDM Fields: Search for text matching field names, for example,
network.dns.questions.nameorprincipal.ip. - Values: Search for text strings inside stored log values, for example,
dnsorgoogle.com.
- UDM Fields: Search for text matching field names, for example,
Click in the search Enter exact string to match on field, and enter the string to match on. As you type, search results appear in the dialog.
The results vary when matching on UDM Fields versus Values as follows:
Searching with Match On UDM Fields names returns an exact match found anywhere in the schema definition.
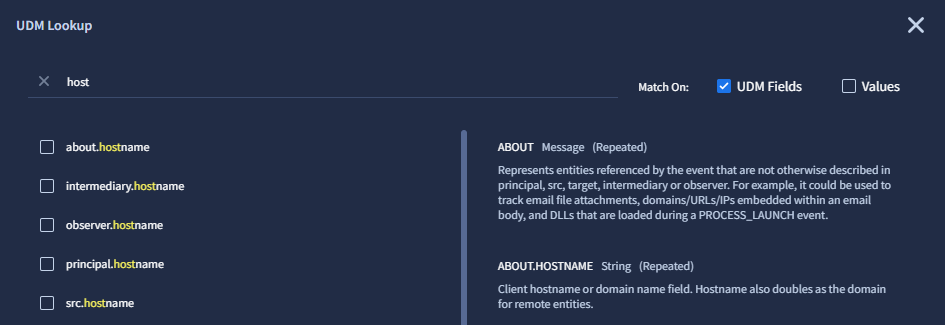
Figure 2. Search with Match On UDM Fields names in the UDM Lookup dialog.
Searching with Match On Values searches your ingested log telemetry and returns two types of results:
Full value matches: For common text fields (such as applications, hostnames, URLs, IP addresses, and usernames), UDM Lookup displays the complete matching value with your search string highlighted in yellow, along with the latest log ingestion timestamp.
Possible value matches: For fields that contain long, complex, or unstructured text (such as command lines, descriptions, detection fields, and custom fields), UDM Lookup indicates that the search term appears in that field in your historical telemetry. Instead of showing a single full value, the result displays the UDM field name followed by
(Possible value match).
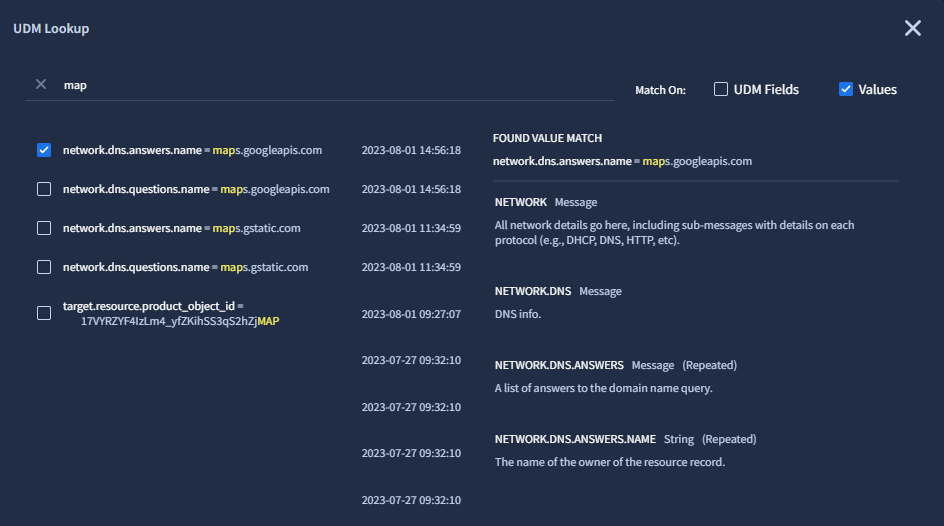
Figure 3. Search with Match On Values in the UDM Lookup dialog.
In the list of results, you can do the following:
- Click the name of a UDM field to see a description of that field.
- Select one or more results by clicking the checkbox next to the UDM field name.
- Click the Reset button to deselect all selected fields in the results list.
Do one of the following:
To copy the selected results to the clipboard, click Copy UDM. You can then close the UDM Lookup dialog and paste contents of the clipboard into the query editor.
To append the selected results onto the query in the query editor, click Append to search. Google SecOps then converts the selected results to a search query as the UDM field name or a name-value pair.
If you append multiple results, Google SecOps adds each result to the end of the existing query in the query editor using the
ORoperator.The appended query string is different depending on the type of match returned by UDM Lookup:
If the result matches a text string in a UDM field name, the full UDM field name is appended to the query. For example:
principal.artifact.network.dhcp.client_hostnameIf the result is a full value match, the name-value pair contains an exact equality condition with the full value.
If the result is a Possible value match, the name-value pair contains the UDM field name and a case-insensitive regular expression containing your search term.
Edit the query in the query editor if needed.
UDM Lookup search behavior and field coverage
UDM Lookup helps you discover field names and search for historical values across your ingested log data. This section explains how search works across both modes, provides query examples, and describes field coverage boundaries.
Search modes: UDM Fields versus Values
UDM Lookup provides two distinct search modes:
UDM Fields mode: Match On UDM Fields searches the UDM schema definition to help you locate the correct field path. You can find field names across all data types, including text fields (
principal.hostname), numeric ports (target.port), boolean flags (security_result.is_alert), and event categories (metadata.event_type).Example: Typing
portdisplays fields likenetwork.ip_port,principal.port,target.port, andsrc.port.Values mode: Match On Values searches your ingested event logs for matching text values:
- Exact value match: For common identifiers and text fields (such as hostnames, IP addresses, domains, and usernames), UDM Lookup finds the exact value in your data and generates an equality condition (for example,
principal.hostname = "example.com"). - Possible value match (Regular expression): For long text, command lines, URLs, registry keys, and file paths, UDM Lookup returns a Possible value match with a regular expression (for example,
principal.process.command_line = /powershell/ NOCASE).
- Exact value match: For common identifiers and text fields (such as hostnames, IP addresses, domains, and usernames), UDM Lookup finds the exact value in your data and generates an equality condition (for example,
Field coverage gaps and how to search directly
When searching by Values, UDM Lookup searches text fields in raw, unenriched event data. Certain data types and high-volume identifier fields don't return matches in Values mode. To search for these fields, enter your expression directly in the query editor.
This section includes the following:
- Numeric, boolean, timestamp, and byte fields
- Excluded identifier fields
- Fields with possible value matches (regular expressions)
- Enriched fields and Entity Graph
Numeric, boolean, timestamp, and byte fields
UDM Lookup value search does not return matches for non-text data types. To search on these fields, write the condition directly in the search bar:
| Field category | Example UDM fields | Direct search example |
|---|---|---|
| Port numbers and status codes | network.ip_port, principal.port, target.port, network.http.response_code |
network.ip_port = 443network.http.response_code = 403 |
| Metrics and risk scores | security_result.risk_score, network.sent_bytes, network.received_bytes |
security_result.risk_score >= 80network.sent_bytes > 50000000 |
| Boolean flags | security_result.is_alert, network.dns.answers.is_authoritative |
security_result.is_alert = true |
| Predefined enums | metadata.event_type, network.ip_protocol |
metadata.event_type = "USER_LOGIN"network.ip_protocol = "TCP" |
| Timestamps | metadata.event_timestamp.seconds, metadata.ingested_timestamp |
Filter using the Time Range menu or query: metadata.event_timestamp.seconds > 1700000000 |
| Event IDs (raw bytes) | metadata.id |
metadata.id = "..." |
| Geographic coordinates | principal.location.latitude, principal.location.longitude |
Filter by regional location fields: principal.location.country_or_region = "US" |
Excluded identifier fields
The following high-entropy and session tracking fields don't return matches when searching by Values:
| Excluded field category | UDM fields | Direct search example |
|---|---|---|
| Process IDs | *.pid (for example principal.process.pid, target.process.pid), *.product_specific_process_id |
target.process.pid = "4128" |
| Session and connection IDs | network.session_id, network.parent_session_id, metadata.product_log_id |
network.session_id = "sess-9481" |
| Detection rule IDs | security_result.rule_id |
security_result.rule_id = "rule_suspicious_login" |
| Resource and asset IDs | *.resource.id (including cloud ARNs and URIs), *.asset_id |
target.resource.id = "arn:aws:s3:::my-bucket" |
| Ingestion labels | metadata.base_labels.*, metadata.enrichment_labels.* |
metadata.base_labels.log_types = "WINEVTLOG" |
Fields with possible value matches (regular expressions)
For fields that contain long, complex strings with many path separators or arguments, UDM Lookup returns a Possible value match regular expression (/.../ NOCASE) rather than an exact full-value match:
- Command lines:
principal.process.command_line,target.process.command_line - File paths:
principal.process.file.full_path,target.file.full_path - Web and network URLs:
principal.url,target.url,network.http.referral_url - Registry keys:
principal.registry.registry_key,target.registry.registry_key - Free-form descriptions:
metadata.description,security_result.description,security_result.summary - User-Agent strings:
network.http.user_agent - Dynamic custom fields:
additional.fields.value.*
Enriched fields and Entity Graph
UDM Lookup searches raw log data ingested after August 10, 2023. It does not return values from:
- Downstream enrichments: Such as GeoIP location resolution, WHOIS data, Safe Browsing verdicts, or VirusTotal scores. To search these, filter directly on the enriched field path (for example,
target.ip_geo_artifact.country_or_region = "US"). - Entity Graph objects: Data in the
graph.*namespace. - Historical data prior to cutoff: Logs ingested before August 10, 2023. To search older data, use direct search queries on the Search page.
Use data tables in a search
You can use the data tables feature in a search. This lets you use your own existing databases of threat information in conjunction with a search to hunt for threats in your enterprise.
For example, if you have a database called suspicious with a column of IP
addresses that you know are problematic, you can reference that database in the search query
instead of manually entering individual IP addresses in the query:
  events:
      $e.principal.ip in %suspicious.ip
You can narrow your results by searching for specific metadata in addition to IP addresses, for example, you might be specifically concerned with changes to user resources:
  events:
      $e.metadata.event_type = "USER_RESOURCE_UPDATE_CONTENT"
      $e.principal.ip in %suspicious.ip
You can narrow a search against interrelated UDM fields and match
against multiple data table columns. The following example searches
for NETWORK_CONNECTION events where the security result is ALLOW. It then
matches those events against the hostnames column and the ip column in the
badApps data table.
events:
  $e.metadata.event_type = "NETWORK_CONNECTION"
  $e.security_result.action = "ALLOW"
  $e.target.asset.asset_id = $assetid

  // Event hostname matches at least one value in table column hostname.
  $e.target.hostname in %badApps.hostname

  // Event IP matches at least one value in table column ip.
  $e.target.ip in %badApps.ip
View data table rows in a search
When you use a data table in a YARA-L 2.0 search, the results reference the data table rows that are linked to the matching events. These results are displayed in the Events panel. The current state of the data table and its rows are shown when you view the results.
Use the Column Manager to select which data table and columns to display in the results.
For more information, see Use data tables.
Understand the query run process
If the query in the query editor is valid, the Google SecOps console enables the Run Search button.
After you click Run Search, the in-progress query is displayed with a circular status icon.
While a search is in progress, you can run additional (concurrent) searches in the query editor with some limitations. Google SecOps continues running your previous searches and runs the new searches in parallel.
Completed queries are displayed with a green check mark icon, along with a counter indicating the number of events returned by the query.
Click a completed query to display the results. The search results are displayed below the query editor.
The search results are cached and only include the data available at the query run time.
Manage your search history
Your search history is saved to your Google SecOps account.
To manage your search history, on the SIEM Search page, click History to open the dialog and do the following:
- View a list of all the searches in your history.
- Click an item from the list to load it into the query editor.
- Type in the search bar to find a search in your history.
- Filter searches by clicking Filter next to the search bar and filter searches by Language—containing: YL2 and SQL filters
ANDSearch type—containing: UDM, Raw log, and Stats filters. - Show completed and in-progress stored results only or not (using the Show Completed & In-Progress Stored Results Only checkbox).
- Clear the search history.
- To clear the search history, click More and select Clear History.
Opt out of search history or opt back in to search history:
To opt out of search history, click Opt out of search history and then select Opt-Out Only to disable search history, or Opt-Out and Clear to disable search history and delete the saved search history.
If you have previously disabled search history, you can enable it again by clicking Opt into search history.
To delete an individual search from your search history, see Delete a saved search.
Save and use a metrics query
Google SecOps classifies metrics queries with the STATS badge.
- To save a search as a metric, click More next to Run Search and click Save as Metric. The Rules & Detections page opens, displaying your metrics query in the Metrics tab. You can then save the metric or disable it. After saving a metric query, it can't be edited or deleted. Metrics can be disabled at any time.
You can use a metrics query to establish typical behavior patterns and identify outlying activity. If you have a metrics query in the query editor that tracks critical operational trends, click More > Save as Metric. This saves the query as a continuous time-series metric that can be embedded into custom dashboards or referenced in threshold alerts.
Example metrics query:
metric metric_1784196814306 {
  (metadata.event_type = "NETWORK_FLOW" OR
  metadata.event_type = "NETWORK_CONNECTION" OR
  metadata.event_type = "NETWORK_DNS" OR
  metadata.event_type = "NETWORK_HTTP")

  outcome:
  $timestamp = timestamp.get_timestamp(metadata.event_timestamp.seconds)
  $hostname = principal.hostname
  $event_type = metadata.event_type
  $user = principal.user.userid
  $principal_process = principal.process.file.full_path
  $principal_cmdline = principal.process.command_line
  $target_process = target.process.file.full_path
  $target_cmdline = target.process.command_line
  $target_url = target.url
  $target_ip = target.ip[0]
  order:
  $timestamp
  }
Manage your searches (Search Manager)
Use the Search Manager dialog to manage your searches.
- To open the Search Manager, on the SIEM Search page, click Search Manager.
Search-type badges
The Saved tab in the Search Manager lists all the saved searches and displays a badge with the search type: UDM, RAW, JOIN, STATS, CASE, and CASE HISTORY.
Search Manager actions
On the Saved tab, you can perform the following actions:
- Filter saved searches: Click Filter next to the search bar and filter searches by Source—containing: Google SecOps defined, Authored by me, and Shared with me
ANDLanguage—containing: YL2 and SQL. - Sort searches: Click list_arrow Sort next to the search bar and sort by Name (A - Z), Name (Z - A), Oldest - Newest, or Newest - Oldest.
- Add a search: Click add_2 Add next to the search bar and construct a new search in the adjacent UDM Search box. The UDM Search box supports the same UDM-editing and automatic-suggestion and completion tools as when you construct a query manually in the query editor.
- Share or delete searches that you authored.
- Edit a search that was authored by you: When a search is selected in the Saved tab, the SEARCH box displays the query, along with the Title box and the Description box. The UDM Search box supports the same UDM-editing and automatic-suggestion and completion tools as when you construct a query manually in the query editor.
Save a search
Saved searches and search history are:
- Stored with your Google SecOps account.
- Only viewable and accessible by the individual user unless you use the Share a search feature to share your search with your organization.
To save a search, do the following:
On the SIEM Search page, do one the following:
- If there's a valid query in the query editor, click More next to Run Search and click Save search. The Search Manager dialog opens.
- Click Search Manager. The Search Manager dialog opens.
In the Title box, enter a name for the search. Google recommends giving your saved search a meaningful name and a plain text description of what you're searching for.
Optional: In the Description box, enter a description for the search.
Optional: Specify placeholder variables in the format
${<variable name>}using the same format as is used for variables in YARA-L. If you add a variable to a search, you must also include a prompt to help the user understand the required information to enter before they run the search. All variables must be populated with values prior to a search being run.For example, you could add
metadata.vendor_name = ${vendor_name}to your search. For${vendor_name}, you need to add a prompt for future users, such asEnter the name of the vendor for your search. Each time a user loads this search in the future, they are prompted to enter the vendor name prior to running the search.Click Save Edits when you're finished.
- To view saved searches, click Search Manager and then click the Saved tab.
Retrieve and run a saved search
To retrieve and run a saved search, do the following:
- On the SIEM Search page, click Search Manager and select a search from the *Saved list to the left.
- Optional: Delete a search by clicking More and selecting Delete Search. You can only delete searches that you authored.
- You can change the name of the search and the description. Click Save edits when you're finished.
- Click Load search. The search is loaded into the main search field.
- Click Run Search.
Delete a saved search
You can only delete searches that you authored.
To delete a saved search, do the following:
- On the SIEM Search page, click Search Manager and select a search from the *Saved list to the left.
- Click More and select Delete Search.
- Click Delete Search.
Share a search or stop sharing it
Shared searches let you share searches with your team. You can't share with only one person. If you share your search, it is shared with your whole organization.
You can't edit a shared search that you didn't author.
To share a search, do the following:
- On the SIEM Search page, click Search Manager and select a search from the *Saved list to the left.
- Click the search you want to share.
- Click More on the right side of the search. A dialog with the option to share your search appears.
- Click Share With Your Organization. A dialog appears that says "Sharing your search will be visible to people in your organization. Are you sure you want to share?".
- Click Share.
If you want the search to only be visible to you, click More and click Stop Sharing. If you stop sharing, only you can use this search.
Search results—overview
When you click Run Search on the SIEM Search page, Google Security Operations evaluates your query across your environment and categorizes and displays the results below the query editor.
The UI elements for search results vary depending on the search type (which are, according to their badges: UDM, RAW, JOIN, STATS, CASE or CASE HISTORY).
The SIEM Search page displays the following tabs for search results:
- Results: Displayed for all search types.
- Alerts & Detections: Displayed only for UDM, RAW, and JOIN search results.
- Overview: Displayed only for UDM, RAW, and JOIN search results.
- Visualize: Displayed only for STATS search results.
The title of each results tab includes the count in parentheses, for example, Results (1,118)—or Results (100,000+) if the number of results exceeds the specified maximum (in this case 100k).
Clicking between tabs instantly shifts your workspace view while preserving your search query and time range.
View and manage information in the Results tab
The Results tab serves as your primary workspace for viewing and managing search results. You can use the Results tab for:
- Deep-dive log hunting
- Viewing raw telemetry
- Generating pivot tables from event data
- Analyzing high-frequency field value distributions
- Exporting data to CSV files
The Results tab includes the following elements, depending on the search type:
- Tabbed panels with the following charts:
- Activity Over Time chart: Displayed for UDM, JOIN, CASE, and CASE HISTORY search results.
- Trend Over Time chart: Displayed for RAW search results.
- Prevalence tab: Displayed for UDM search results.
- Activity heatmap table: Displayed for UDM search results.
- Aggregations panel: Displayed for all types of search results.
Panels with the following tables, according to the search type:
- Events table and Pivot sub-tab: Displayed only for UDM search results. The Events table displays normalized UDM event telemetry and raw log records matching your query within the selected time window. The Pivot sub-tab lets you create and use a pivot table to perform multidimensional mathematical grouping and summarization (
sum,count,avg,stddev) on the event results. - Raw Logs: Displayed only for RAW search results.
- Stats: Displayed only for STATS search results.
- Joins: Displayed only for JOIN search results.
- Cases: Displayed only for CASE search results.
- Case History: Displayed only for CASE and CASE HISTORY search results.
For information about the supported functions and tools for these tables, see Use common tools for tables. Supported functions include managing the columns in the table that the tab displays, downloading search results, and more.
- Events table and Pivot sub-tab: Displayed only for UDM search results. The Events table displays normalized UDM event telemetry and raw log records matching your query within the selected time window. The Pivot sub-tab lets you create and use a pivot table to perform multidimensional mathematical grouping and summarization (
Use the Activity Over Time chart
The Activity Over Time tab includes a chart (a histogram) of event and alert volume over time.
The width of each bar depends on the time interval searched. For example, each bar represents 10 minutes when the search spans 24 hours of data. This chart is updated dynamically as you modify the existing search.
The chart supports the following:
- Time range adjustment: Drag the slider controls on the timeline to narrow the visible time window instantly. The results grid and Aggregations panel update without rerunning the query against the backend.
- View the events and alerts for a single bar's time-window: Click a bar to narrow the focus of the chart, the Aggregations panel, and the Detections tab to the time-window of that bar. This action creates a filter, which is displayed next to the filter_list Add filter button. To display all the results again, delete the filter.
- Details popup: Clicking one of the bars opens a popup with the time, and the values for Queried Events, Filtered Events, Queried Alerts, and Filtered Alerts.
Use the Trend Over Time chart
The Trend Over Time tab includes a chart (a histogram) of raw-log volume over time. The width of each vertical bar dynamically scales based on your overall search window (for example, each bar might represent 10 minutes for a 24-hour search window).
The chart supports the following:
- Time range adjustment: Drag the slider controls on the timeline to narrow the visible time window instantly. The results grid and Aggregations panel update without rerunning the query against the backend.
- View how many parsed, unparsed, and unknown logs were detected in a single bar's time-window: Unknown means that one or more logs were detected at the time but the number is indeterminate. Click a bar to narrow the focus of the chart and the Aggregations panel to the time-window of that bar. This action creates a filter, which is displayed next to the filter_list Add filter button. To display all the results again, delete the filter.
- Details popup: Clicking one of the bars opens a popup with the time, and the values for Queried Events, Filtered Events, Queried Alert, and Filtered Alerts.
Use the Prevalence tab
The Prevalence tab appears only if your search includes a domain.
The Prevalence tab displays the prevalence of domains associated with your search within your enterprise. It combines a list of low-prevalence domains with an interactive chart. The tab appears only if your UDM search includes a domain.
The list of low-prevalence domains includes the following columns:
Low prevalence domains: Displays the domain names associated with your search results. Click arrow_upward to sort the domains alphabetically (Z to A), and arrow_downward for alphabetically (A to Z).
Prevalence ≤ 10: Displays the total occurrence count for each domain with a prevalence of 10 or fewer. Click arrow_upward to sort the counts numerically in descending order, and arrow_downward for ascending order.
On the chart, hold the pointer over a circle to display the specific domain and narrow your search to events associated with that domain only.
Use the Activity heatmap tab
The Activity heatmap tab displays event data in a visual timeline grid to highlight where events are most concentrated over the given time range. The Y-axis displays the dates within your search timeframe, and the X-axis axis displays the time of day in hourly intervals (from 00:00 to 23:00).
A color gradient legend indicates the volume of events in a specific hour, where lighter colors indicate fewer events and darker colors indicate a higher density. You can also adjust the density indicator to view or hide hourly slots by adjusting the horizontal slider. Click the up or down arrows on the side panel to scroll through the dates and adjust the specific time window.
Use the Aggregations panel to refine search results
The Aggregations panel summarizes high-frequency values, which you can use to refine your search results.
The Aggregations panel includes two collapsible lists: UDM Fields (which is a list of matching UDM fields) and another list of fields that is according to the search type (for example, Log Fields for raw-log searches, Stats Fields, Case Fields, and so on). For UDM searches, the Aggregations panel contains the UDM Fields list and the Grouped Fields list.
To pin a field to the top of the Aggregations list, hold the pointer over a field and click the keep Keep icon.
You can search for specific fields or field values using the panel's searchSearch field.
Each field displays the "match count", that is, the number of records that have the same value for that field. The contents of the lists are sorted from highest to lowest match count, and in alphabetical order within the same match count. You can search the lists for fields and expand a field item.
To filter search results with aggregations, do the following:
In the Aggregations panel, select a field from a list to display the list values for that field.
Select a value from the list and click more_vert More.
Select a filter option:
- Show only: The corresponding adjacent table updates to display only matching records, and the
= "value"filter is displayed next to the filter_list Add filter button. - Filter out: The corresponding adjacent table updates with the matching records filtered out, and the
!= "value"filter is displayed next to the filter_list Add filter button. - Copy: Copies the field-value pair to your clipboard.
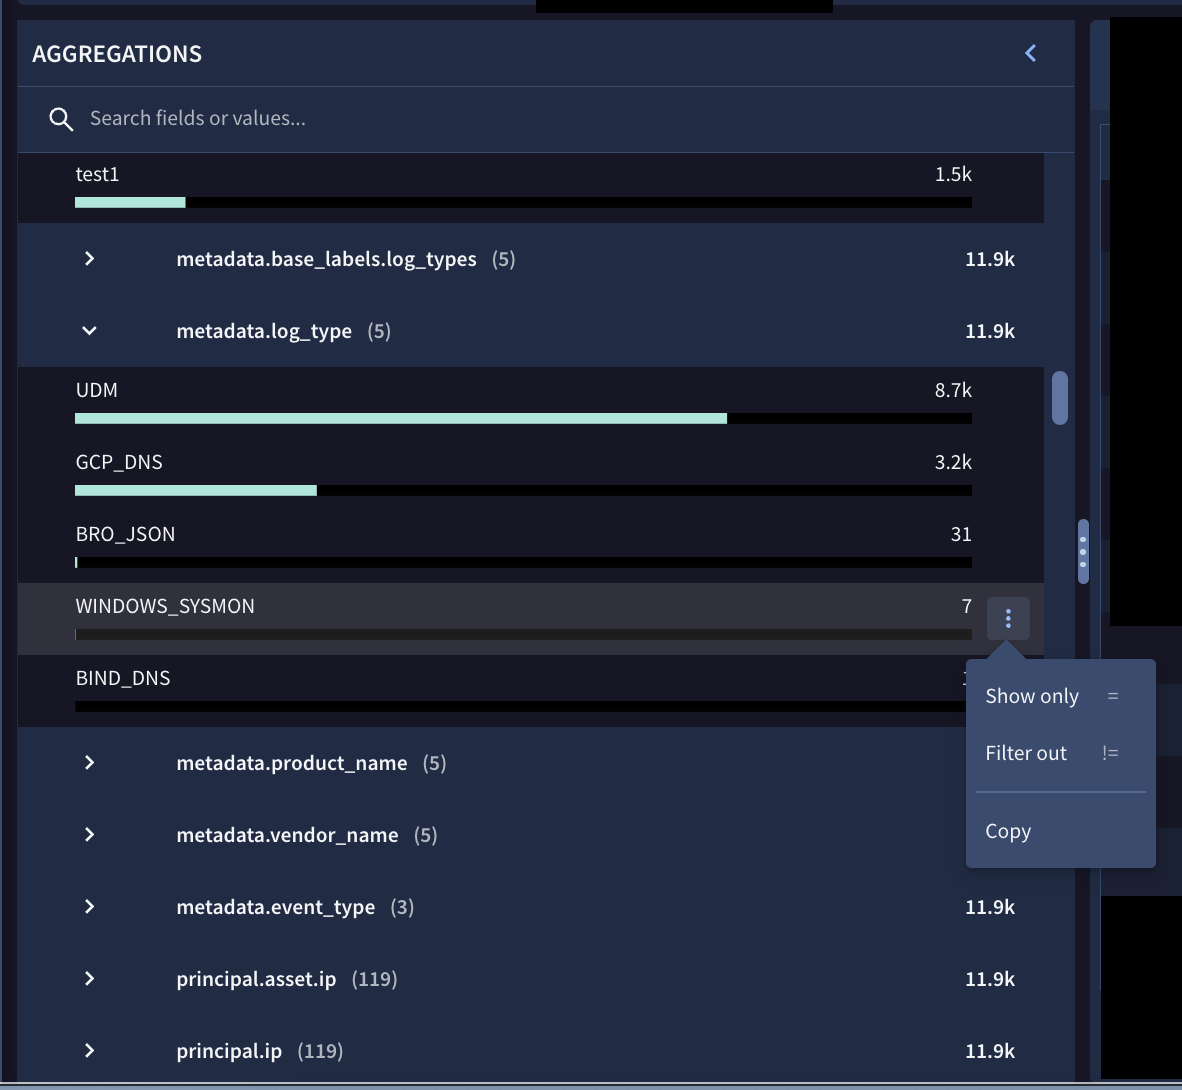
Figure 4. Example of filtering fields using the Aggregations panel.

Figure 5. filter_list Add filter button with two existing filters (one shown and one in the +1 More list).
- Show only: The corresponding adjacent table updates to display only matching records, and the
Optional: If you selected Show only or Filter out in the previous step and you want to automatically incorporate the filter into the query editor and run the search again, click Apply to search and run.
Use grouped fields in the Aggregations panel of the Results tab
The Aggregations panel for UDM searches includes the Grouped Fields list. Grouped fields act as powerful category aliases that combine related UDM fields without requiring you to type each one separately. For more information about grouped fields, see Search grouped fields.
| Grouped field alias | Associated UDM fields included in alias |
|---|---|
domain |
about.administrative_domainabout.asset.network_domainnetwork.dns.questions.namenetwork.dns_domainprincipal.administrative_domainprincipal.asset.network_domaintarget.administrative_domaintarget.asset.hostnametarget.asset.network_domaintarget.hostname |
email |
intermediary.user.email_addressesnetwork.email.fromnetwork.email.toprincipal.user.email_addressessecurity_result.about.user.email_addressestarget.user.email_addresses |
file_path |
principal.file.full_pathprincipal.process.file.full_pathprincipal.process.parent_process.file.full_pathtarget.file.full_pathtarget.process.file.full_pathtarget.process.parent_process.file.full_path |
hash |
about.file.md5about.file.sha1about.file.sha256principal.process.file.md5principal.process.file.sha1principal.process.file.sha256security_result.about.file.sha256target.file.md5target.file.sha1target.file.sha256target.process.file.md5target.process.file.sha1target.process.file.sha256 |
hostname |
intermediary.hostnameobserver.hostnameprincipal.asset.hostnameprincipal.hostnamesrc.asset.hostnamesrc.hostnametarget.asset.hostnametarget.hostname |
ip |
intermediary.ipobserver.ipprincipal.artifact.ipprincipal.asset.ipprincipal.ipsrc.artifact.ipsrc.asset.ipsrc.iptarget.artifact.iptarget.asset.iptarget.ip |
namespace |
principal.namespacesrc.namespacetarget.namespace |
process_id |
principal.process.parent_process.pidprincipal.process.parent_process.product_specific_process_idprincipal.process.pidprincipal.process.product_specific_process_idtarget.process.parent_process.pidtarget.process.parent_process.product_specific_process_idtarget.process.pidtarget.process.product_specific_process_id |
user |
about.user.useridobserver.user.useridprincipal.user.user_display_nameprincipal.user.useridprincipal.user.windows_sidsrc.user.useridtarget.user.user_display_nametarget.user.useridtarget.user.windows_sid |
Use the Events panel
Use the Events panel to view, sort, and manage the events that match your UDM search.
For information about the supported functions and tools for the Events panel, see Use common tools for tables. Supported functions include managing the columns in the table that the tab displays, downloading search results, and more.
By default, after you run a search, the Events table displays key columns (referred to as quick fields), for example, Event Status, Timestamp, Type (udm.metadata.event_type), Summary, User (udm.principal.user.userid or target.user.userid), Hostname (udm.principal.hostname or target.hostname). Depending on your query scope and log source, the table can also dynamically surface relevant quick fields such as Action (udm.security_result.action).
Inspect granular details of a single event (Event Viewer and raw log correlation)
To inspect granular details of a single event, click in the row. The Event Viewer opens.
For more information, see Use the Event Viewer for UDM and RAW results.
Pivot tab—build a pivot table
You can use a pivot table to perform multidimensional mathematical grouping and summarization against your search results.
To open and configure a pivot table, do the following:
- Run a UDM search.
- On the Results tab, click the Pivot sub-tab. The Pivot Settings panel opens.
Under Group By, click add Field to select up to five UDM fields for row grouping. Special transform options appear based on the field type:
- String fields: Option to force lowercase. You can display the results using the Default capitalization or using lowercase only by selecting Lowercase from the menu.
- Hostname fields:
- Registered domain: Displays only the registered domain name (such as
google.com,nytimes.com,youtube.com). - Top N-level domain: Specify which level of the domain to display.
For example, using a value of
1displays only the top level domain (such ascom,gov, oredu). Using a value of3displays the next two levels of the domain names (such asgoogle.co.uk).
- Registered domain: Displays only the registered domain name (such as
- IP fields: Option to group by CIDR prefix length in bits. You can specify 1 through 32 for IPv4 addresses. For IPv6 addresses, you can specify values up to 128.
- Timestamp fields: Option to group by time resolution (milliseconds, seconds, minutes, hours, days).
Under Values, specify a value for your pivot from the list of fields in your results. You can specify up to five values.
For each field that you specify for Values, you must select one of the following Summarize By options:
- Avg (average)
- Count
- Count distinct
- Max
- Min
- Sum
- Stddev (standard deviation)
The Summarize options aren't universally compatible with the Group by fields. For example, the Sum, Avg, Stddev, Min, and Max options can only be applied to numeric fields. If you attempt to associate an incompatible Summarize option with a Group By field, you receive an error message.
Specify a value of Event count to return the number of events identified for this particular search and pivot table.
Under Order by, specify one or more UDM fields and select one or more sorts by using the Ascending or Descending option.
Click Apply when you're ready. The results are displayed in the Pivot panel.
Optional: To download and save the contents of the pivot table, see Download search results from a table.
Use the Raw Logs panel
Use the Raw Logs panel to view, sort, and manage the logs that match your search, which evaluates raw, unparsed log telemetry. The primary diagnostic objective is monitoring ingestion and parsing health—that is, monitoring how many logs were parsed versus how many logs were unparsed versus unknown (which means that one or more logs were detected at a certain time but the number is indeterminate).
For information about the supported functions and tools for this tab, see Use common tools for tables. Supported functions include managing the columns in the table that the tab displays, downloading search results, and more.
Inspect granular details of a single raw log (Event Viewer and raw log correlation)
To inspect granular details of a single raw log, click in the row. The Event Viewer opens.
For more information, see Use the Event Viewer for UDM and RAW results.
Use the Stats panel
Use the Stats panel to view, sort, and manage the statistics that match your search.
The Stats panel supports only a Column Selector where you can add or remove columns.
For information about the supported functions and tools for this tab, see Use common tools for tables. Supported functions include downloading search results, and more.
Use the Joins panel
Use the Joins panel to view, sort, and manage the items that match your search.
For information about the supported functions and tools for this tab, see Use common tools for tables. Supported functions include managing the columns in the table that the tab displays, downloading search results, and more.
Use the Cases panel
Use the Cases panel to view, sort, and manage the cases that match your search.
For information about the supported functions and tools for this tab, see Use common tools for tables. Supported functions include managing the columns in the table that the tab displays, downloading search results, and more.
Use the Case History panel
Use the Case History panel to view, sort, and manage the case histories that match your search.
For information about the supported functions and tools for this tab, see Use common tools for tables. Supported functions include managing the columns in the table that the tab displays, downloading search results, and more.
Use the Event Viewer for UDM and RAW results
- To inspect granular details of a single event or raw log, click in a row of the Events table or Raw Logs table. The Event Viewer opens.
The Event Viewer includes the following tabs:
- Event Fields
- Raw Log
- Alerts: Displayed only for UDM results from the Events table
- Entities
Use the Event Fields tab
By default, the Event Fields tab displays UDM event fields in a hierarchical tree structure, which is labeled Selected.
Use the Event Fields tab to do the following:
- View a field definition. Hold the pointer over the field name to view its definition.
- Pin a field for quick access. In the Selected list, select a field, and click keep pin. The field is then displayed in the Pinned list. Fields remain in the Selected list, and their hierarchy in the Pinned list is shown in dot-delimited notation with the
udmprefix (for example,udm.metadata.event_type). - Add to columns or copy multiple fields. Select the checkbox next to a node or field, then choose Add to Columns or Copy.
Perform the following actions:
- Filters: Apply the following filters to selected items (check_box) in the Selected list:
- Fields
- Show unenriched fields
- Show enriched fields
- Show additional fields
- Show extracted fields
- Enrichment Log Sources: The available options depend on the event.
- Fields
- Copy: To copy the selected UDM fields and UDM values to the system clipboard.
- Add to Columns: Add the UDM field as a column.
- Filters: Apply the following filters to selected items (check_box) in the Selected list:
Each UDM field is labeled with an icon indicating whether the field contains enriched or unenriched data. The icon labels are the following:
- U: Unenriched fields contain values populated during the normalization process using data from the original raw log.
E: Enriched fields contain values that Google SecOps populates to provide additional context about artifacts in a customer environment. For more information, see Enrich event and entity data with Google SecOps.
The display of each enriched field can show all associated sources. This information is useful for validation and troubleshooting, and may be required for auditing and compliance purposes. You can also filter fields according to their enrichment source.
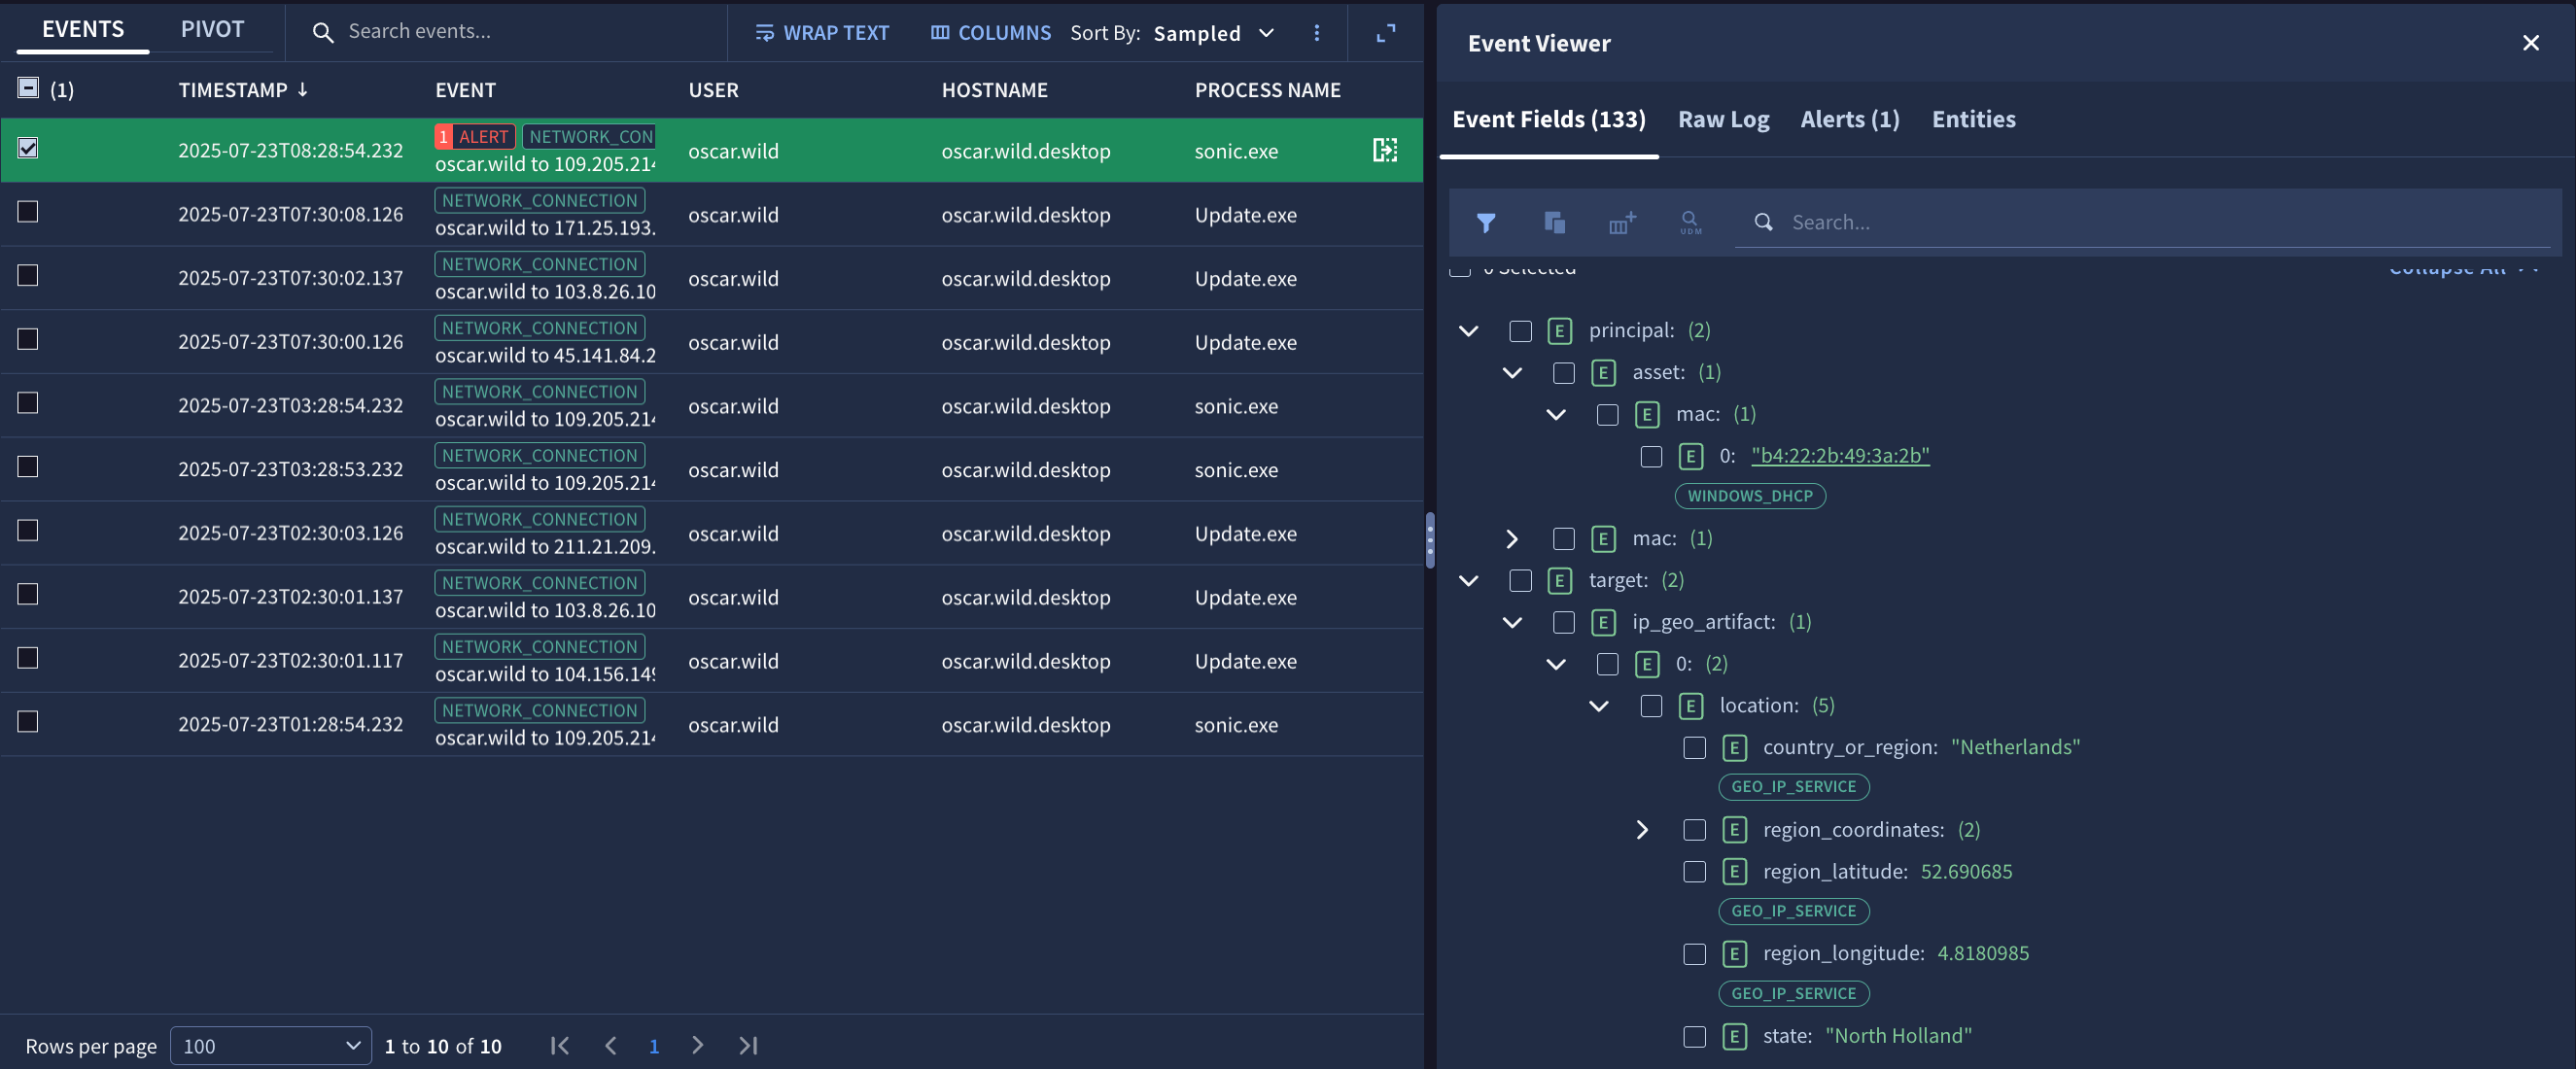
Figure 6. Enriched and unenriched UDM fields in the Event Fields tab of the Event Viewer, showing sources of enriched fields.
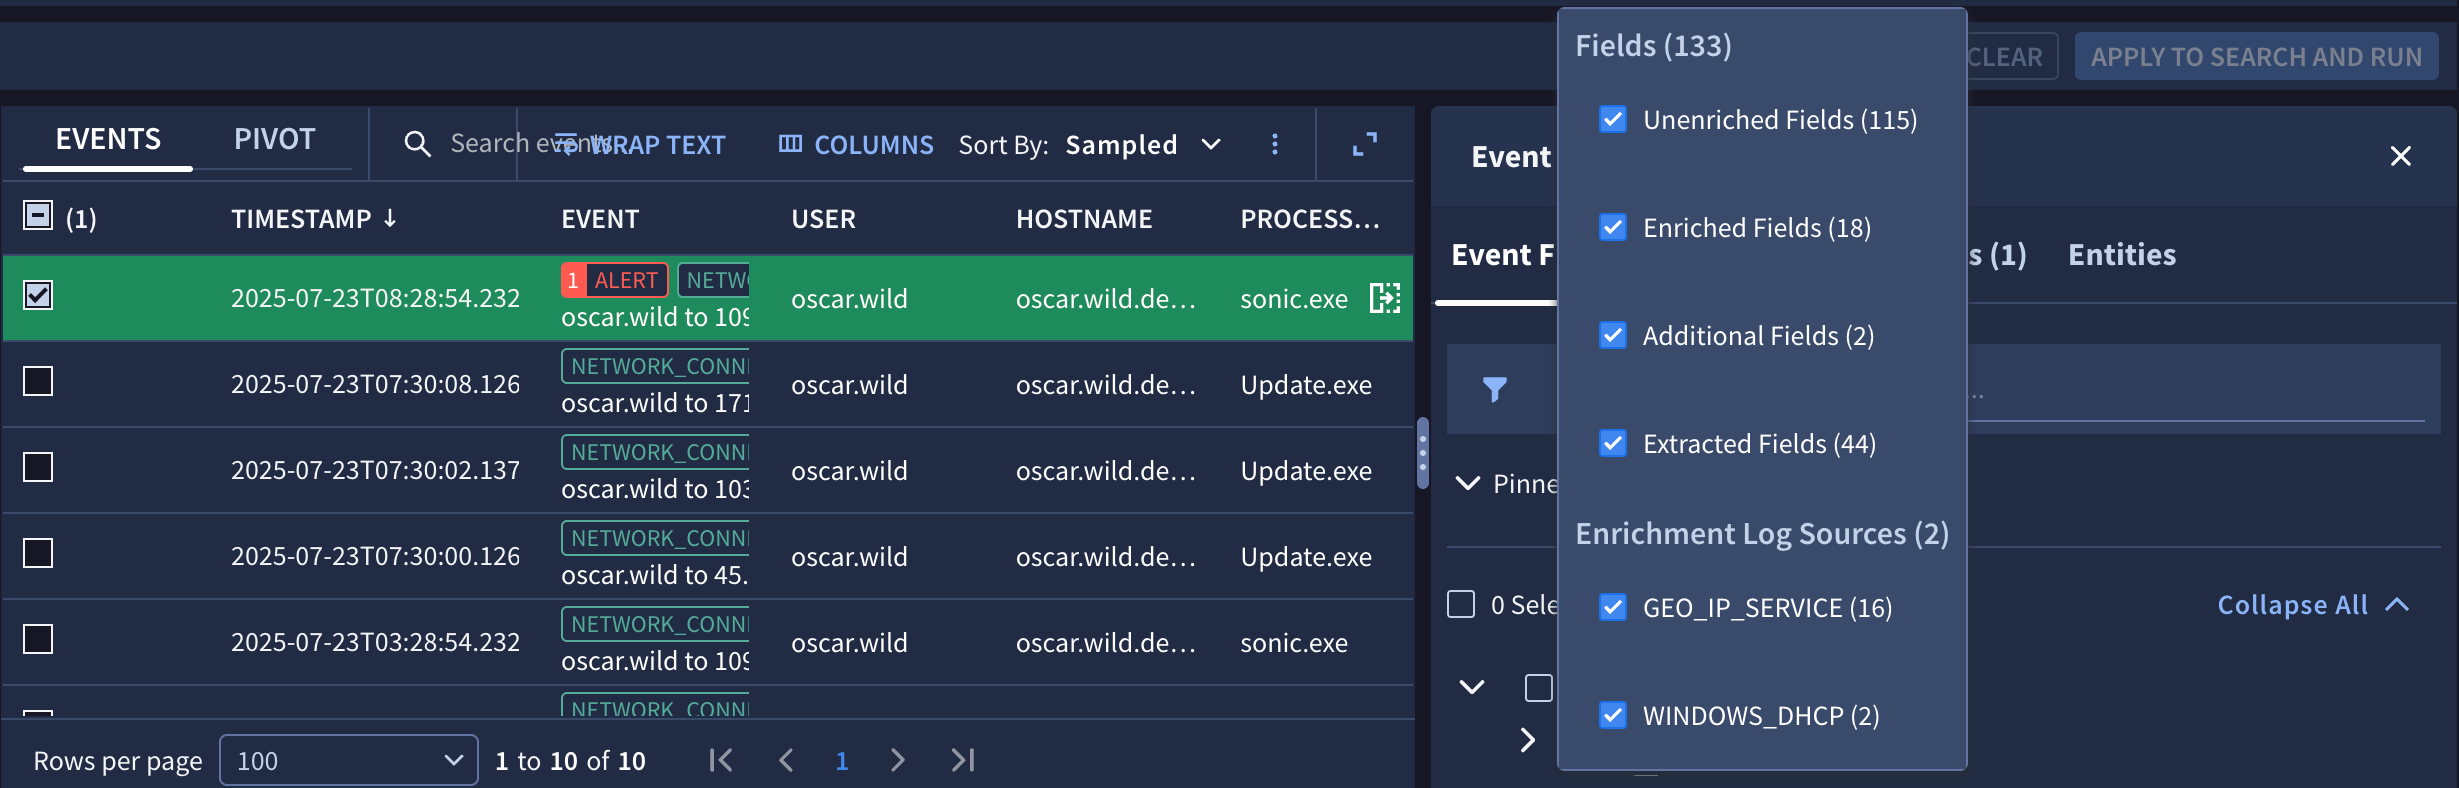
Figure 7. Use the filter in the Event Fields tab to show or hide fields according to various attributes.
Use the Raw Log tab
The Raw Log tab displays the original raw sign in any of the following formats:
- Raw
- JSON
- XML
- CSV
- Hex/ASCII
Use the Alerts tab
The Alerts tab displays the alerts associated with the event.
The Alerts tab is displayed only for UDM results from the Events table.
Use the Entities tab
The Entities tab displays the entities associated with the event.
Click an entity to display the Entity context dialog, which can include the following items:
- Asset name
- First time seen
- Last time seen
- IP addresses
- MAC addresses
- Number of alerts
- Highest alert count by rule
- Alerts-over-time bar graph
- Open Alerts & IOCs link
- View in Alerts Tab link
View and manage information in the Alerts & Detections tab
Use the Alerts & Detections tab for:
- Threat hunting across all rule executions
- Comparing actionable alerting triggers against low-noise behavioral precursors
- Scoping incident boundaries in one consolidated view
The Alerts & Detections tab surfaces both alerts and detections that match your active search criteria. By combining both alerts and detections in one tab, you can inspect high-severity alerts right alongside underlying behavioral rule hits to uncover low-noise precursors that didn't cross the alerting threshold independently.
Alerts are UDM events and third-party connector telemetry tagged with alerting thresholds or high-severity notifications. The Alerts count displays UDM log telemetry that triggered an alerting rule (alert_state = "ALERTING"), along with high-priority notifications ingested from third-party security connectors (such as CrowdStrike or SOAR webhooks).
Detections are all alerting (ALERTING) and non-alerting (NOT_ALERTING) rule execution outputs generated by YARA-L 2.0 rules across your environment. The tab surfaces the comprehensive rule execution outputs generated by your YARA-L 2.0 detection engine across both alerting and non-alerting rule hits. Every rule-generated alert is also a detection (ALERTING), but the Detections count also includes all informational, background, or non-alerting rule hits (NOT_ALERTING).
The count in the tab header categorizes rule execution matches by alert status. For example, if the tab header is Alerts (43) & Detection (0), this means there are 43 matches where alerting_rule = true and zero non-alerting (NOT_ALERTING) rule executions.
The Alerts & Detections tab includes the following panels:
Use the Trend over time chart
The Trend over time tab in the Alerts & Detections tab includes a chart (a histogram) of detection volume over time. The width of each vertical bar dynamically scales based on your overall search window (for example, each bar might represent 10 minutes for a 24-hour search window).
The chart groups all rule execution matches across time under a single aggregated series labeled Detections.
The chart supports the following:
- Time range adjustment: Drag the slider controls on the timeline to narrow the visible time window instantly. The results grid and aggregations update without rerunning the query against the backend.
- View the aggregations and detections for a single bar's time-window: Click a bar to narrow the focus of the chart, the Aggregations tab, and the Detections tab to the time-window of that bar. This action creates a filter, which is displayed next to the filter_list Add filter button. Delete the filter to display all the results again.
- Details popup: Clicking one of the bars opens a dialog with the time, and the values for Queried Detections and Filtered Detections.
Use the Aggregations panel to refine detections
The contents of the Aggregations panel in the Alerts & Detections tab summarize high-frequency detection-result values, which you can use to refine your search results.
The Aggregations panel includes three collapsible lists: Detection fields, UDM fields (which is a list of matching UDM fields), and Entity Fields.
Each field displays the "match count", that is, the number of alert-detections that have the same value for that field. The contents of the lists are sorted from highest to lowest match count, and in alphabetical order within the same match count. You can search the lists for fields and expand a field item.
You can pin a field to the top of the Aggregations list by holding the pointer over a field and clicking the keep Keep icon.
Search alert-detection results in the Aggregations panel
You can search for specific fields or field values using the Aggregations panel's searchSearch field. This can help you focus on the alerts that are most important to you.
The following are key alert attributes for filtering alerts in the Aggregations panel:
- Case
- Name
- Priority
- Severity
- Status
- Verdict
Filter alert-detection results in the Aggregations panel
To filter alert-detection results with aggregations, do the following:
In the Aggregations panel, select a field from a list to display a list of values for that field.
Select a value from that list and click more_vert More.
Select a filter option:
- Show only: The Detections table updates to display only matching alerts, and the
= "value"filter is displayed next to the filter_list Add filter button. - Filter out: The Detections table updates with the matching alerts filtered out, and the
!= "value"filter is displayed next to the filter_list Add filter button. - Greater than (for integer fields only): The Detections table updates to display alerts with a value greater than this one, and the
> "value"filter is displayed next to the filter_list Add filter button. - Greater than or equal to (for integer fields only): The Detections table updates to display alerts with a value greater than or equal to this one, and the
>= "value"filter is displayed next to the filter_list Add filter button. - Less than (for integer fields only): The Detections table updates to display alerts with a value less than this one, and the
< "value"filter is displayed next to the filter_list Add filter button. - Less than or equal to (for integer fields only): The Detections table updates to display alerts with a value less than or equal to this one, and the
<= "value"filter is displayed next to the filter_list Add filter button. - Copy: Copies the field-value pair to your clipboard.
- Show only: The Detections table updates to display only matching alerts, and the
- To delete a filter and update the alert-detection results, delete the filter that is displayed next to the filter_list Add filter button.
Use the Detections panel
Use the Detections panel to view, sort, and manage the items that match your search.
For information about the supported functions and tools for this tab, see Use common tools for tables. Supported functions include managing the columns in the table that the tab displays, downloading search results, and more.
Inspect granular details of a single alert (Alert Viewer)
- To inspect granular details of a single alert, click in a row of the Detections table. The Alert Viewer opens.
The Alert Viewer includes the following tabs:
- Detection Fields
- Details
- Variables
To go to another page in the Google SecOps console with details of the alert, click View details.
Use the Detection Fields tab
By default, the Detection Fields tab displays detection fields in a hierarchical tree structure, which is labeled Selected.
Use the Detection Fields tab to do the following:
- View a field definition. Hold the pointer over the field name to view its definition.
- Pin a field for quick access. In the Selected list, select a field, and click keep pin. The field is then displayed in the Pinned list. Fields remain in the Selected list, and their hierarchy in the Pinned list is shown in dot-delimited notation with the
collectionprefix (for example,collection.created_time). - Add to columns or copy multiple fields. Select the checkbox next to a node or field, then choose Add to Columns or Copy.
Perform the following actions:
- Apply filters to the Selected list.
- Add to Columns: Add the field as a column.
- Copy: To copy the selected fields and values to the system clipboard.
Use the Details tab
The Details tab displays the details of the alert. The set of detail fields vary according to the specific alert.
Example detail fields:
- Name (always Alert)
- Type
- Severity
- Risk Score
- Status
- Priority
- Detected
- Detection window
- Created
- Rule
- Rule Set
- Description
- Tags
Use the Variables tab
The Variables tab displays the field, type, and value of each variable associated with the alert.
Use the Entities tab
The Entities tab is displayed only when there's an entity associated with the alert.
The Entities tab displays the entities associated with the alert.
Click an entity to display the Entity context dialog, which can include the following items:
- Asset name
- First time seen
- Last time seen
- IP addresses
- MAC addresses
- Number of alerts
- Highest alert count by rule
- Alerts-over-time bar graph
- Open Alerts & IOCs link
- View in Alerts Tab link
View and manage information in the Overview tab
Use the Overview tab to do the following:
- Check entity history (First seen, Last seen, MAC addresses)
- Verify if observed indicators overlap with active security operation cases or alerts
The Overview tab displays the consolidated Entity Context Graph (ECG), asset or user details, and investigation overview for indicators of compromise (IOCs) or entities matching your active search window. The information presented varies depending on the information type.
The Overview tab displays entity information in one of the following predefined information types:
View the Asset details in the Overview tab
When the query includes a condition that returns a specific asset—for example, principal.hostname="laptop-will" or principal.ip="10.0.0.76"—the Overview tab displays the Asset View with information in the following panels:
- Search summary: Displays the following information:
- Details about the entity, including the IP address and MAC address associated with the asset during the search time range. The IP address and MAC address can also be used to identify an entity and can be clicked to display additional information in the entity viewer. It also displays the first time the asset was seen in your enterprise and when it was last (most recently) seen. You can click either timestamp (first or last) to run a new search using that time.
- Details about alerts, including a graph showing the number of alerts that involved the entity within the search time range. The panel also lists a subset of rules with the highest number of alerts.
- Click Open Alerts & IOCs to see all alerts generated during the same search time range.
- Click View in Alerts Tab to switch to the Alerts & Detections tab on this page and start a new search against the selected entity.
- Click one of the bars on the chart to switch to the Alerts & Detections tab on this page and start a new search against the selected entity, using the time range of the clicked bar.
- Click the View more link to open the Entity fields view and display all of the entity fields associated with the asset. To copy an entity field to the clipboard, click the checkbox next to the entity field, click View actions, and click Copy entity. Click the checkbox at the top to select all of the entities.
- Relevant IOCs: Displays IOCs associated with the asset. IOCs assigned a higher severity are displayed first. Clicking the IOC name opens the entity viewer to the right.
- Associated Entities: Displays other entities that this asset is related to, such as users who signed in to the asset. The panel displays the type of entity, when it was first seen in the environment, and when it was last (most recently) seen. It also displays any namespaces associated with an asset. Click an entity to open the Entity context panel. Click Show all time to display the associated entities over the entire available time period as opposed to the range specified in the UDM search.
- Entity context: Displays details about the entity you selected in the Associated Entities panel. This panel displays different information depending on the type of entity you selected in the Associated entities panel (for example, user or domain).
View the Domain details in the Overview tab
When the query includes a condition that specifies a specific domain,
for example, target.hostname="example.com", the Overview tab displays the
Domain details with information in the following panels:
- Search summary: Displays the following information:
- Details about the domain, including the WHOIS information associated with the registered domain, the first time it was seen in your enterprise, and the last (most recent) time it was seen. Click VT Context to view information about the domain from VirusTotal.
- Details about alerts, including a graph showing the number of alerts that involved the entity within the search time range. The panel also lists a subset of rules with the highest number of alerts.
- Click Open Alerts & IOCs to see all alerts generated during the same search time range.
- Click View In Alerts Tab to switch to the Alerts & Detections tab on this page and start a new search against the selected entity.
- Click one of the bars on the chart to switch to the Alerts & Detections tab on this page and start a new search against the selected entity, using the time range of the clicked bar.
- Click the View more link to open the Entity fields view and display all of the entity fields associated with the domain. To copy an entity field to the clipboard, click the checkbox next to the entity field, click View actions, and click Copy entity. Click the checkbox at the top to select all of the entities.
- Resolved IPs: Displays all resolved IP addresses that have been
seen in your enterprise for the fully qualified domain name (FQDN). For
example, if you search for
target.hostname="test.altostrat.com", the search results might display two resolved IP addresses (198.51.100.81and203.0.113.81). - Sub-domains and sibling domains: Displays all associated subdomains
that have been seen in your enterprise for a given FQDN. Many adversaries
use the same domain and subdomain for their attacks. For example, if you
search for
target.hostname="sandbox.altostrat.com", this panel displays two subdomains,test.sandbox.altostrat.comandstaging.sandbox.altostrat.com. - Prevalence of Assets: Shows the number of assets in your enterprise that have connected to the domain for the entire time period of the data stored in your Google Security Operations account. Each bar of the graph represents the number of unique assets in your enterprise that have connected to the domain on a UTC day. Hovering over a bar displays the related entities on the UTC day represented by the bar. Click the entity name to see the entity summary and overview in the entity context panel displayed to the right. Click View events to see the events related to the selected entity in the search events tab.
- Associated Entities: Displays other entities that this domain is related to, such as assets that have contacted this domain. The list includes the type of entity, when it was first seen in your enterprise, and when it was last (most recently) seen. Click an entity to open the Entity context panel.
- Entity context: Displays details about the entity you selected in the Associated Entities panel. This panel displays different information depending on the type of entity you selected in the Associated Entities panel (for example, IP address or domain).
View the File details
When the query includes a condition that returns a single file, for
example principal.process.file.md5="a00000a75f2a35130aa7a7aaa09aaa7a", the
Overview tab displays the File details with information in the following
panels:
- Search summary: Displays the following information:
- Details about the file, including hash values, file size, the first time it was seen in your enterprise, and the last (most recent) time it was seen. Click VT Context to view information about the file from VirusTotal.
- Details about alerts, including a chart showing the number of alerts that involved the entity within the search time range. The panel also lists a subset of rules with the highest number of alerts.
- Click Open Alerts & IOCs to see all alerts generated during the same search time range.
- Click View In Alerts Tab to switch to the Alerts & Detections tab on this page and start a new search against the selected entity.
- Click one of the bars on the chart to switch to the Alerts & Detections tab on this page and start a new search against the selected entity, using the time range of the clicked bar.
- Click the View more link to open the Entity fields view and display all of the entity fields associated with the file. To copy an entity field to the clipboard, click the checkbox next to the entity field, click View actions, and click Copy entity. Click the checkbox at the top to select all of the entities.
- Relevant IOCs: Displays IOCs associated with the file. IOCs assigned a higher severity are displayed first. Clicking the IOC name opens the entity viewer to the right.
- Prevalence of Assets: Shows the number of assets in your enterprise associated with the file for the entire time period of the data stored in your Google SecOps account.
- Associated Entities: Displays other entities that this file is related to, such as an asset where this file was executed or users who accessed the file. The list includes the type of entity, when it was first seen in your enterprise, and when it was last (most recently) seen. Click an entity to open the Entity context panel.
- VirusTotal properties & metadata: Displays information about the file from the VirusTotal database. Click View more to open a VirusTotal dialog and display additional information about the file.
- Associated Entities: Displays different information depending on the type of entity you selected in the Associated Entities panel (for example, user or asset).
- Entity context: Displays details about the entity you selected in the Associated Entities panel. This panel displays different information depending on the type of entity you selected in the Associated Entities panel (for example, user or asset).
View the IP details in the Overview tab
When the query includes a condition that returns a specific external
IP address, for example, target.ip="203.0.113.254", the
Overview tab displays the IP details with information in the following
panels:
- Search summary: Displays the following information:
- Details about the IP address, including the first time it was seen in your enterprise and the last (most recent) time it was seen. Click VT Context to view information available about this IP address from VirusTotal.
- Details about alerts, including a graph showing the number of alerts that involved the entity within the search time range. The panel also lists a subset of rules with the highest number of alerts.
- Click Open Alerts & IOCs to see all alerts generated during the same search time range.
- Click View In Alerts Tab to switch to the Alerts & Detections tab on this page and start a new search against the selected entity.
- Click one of the bars on the chart to switch to the Alerts & Detections tab on this page and start a new search against the selected entity, using the time range of the clicked bar.
- Click the View more link to open the Entity fields view and display all of the entity fields associated with the IP address. To copy an entity field to the clipboard, click the checkbox next to the entity field, click View actions, and click Copy entity. Click the checkbox at the top to select all of the entities.
- Relevant IOCs: Displays IOCs associated with the IP address. IOCs assigned a higher severity are displayed first. Clicking the IOC name opens the entity viewer to the right.
- Prevalence of Assets: Shows the number of assets in your enterprise that have connected to the IP address over the time period specified in the UDM search.
- Associated Entities: Displays other entities that this IP address is related to, such as domains the IP address is registered to. The list includes the type of entity, when it was first seen in your enterprise, and when it was last (most recently) seen. Click an entity to open the Entity context panel.
- Entity context: Displays details about the entity you selected in the Associated Entities panel. This panel displays different information depending on the type of entity you selected in the Associated Entities panel (for example, domain or asset). If the link is displayed, click VT Context to view information about the entity from VirusTotal.
View the User details in the Overview tab
When the query includes a condition that returns a specific user, for
example principal.user.userid="alice", the Overview tab displays the
User details with information in the following panels:
- Search summary: Displays the following information:
- Details about the entity, including the full name, first time seen in your enterprise and the last (most recent) time seen, title, and email address.
- Details about alerts, including a graph showing the number of alerts that involved the entity within the search time range. The panel also lists a subset of rules with the highest number of alerts.
- Click Open Alerts & IOCs to see all alerts generated during the same search time range.
- Click View In Alerts Tab to switch to the Alerts & Detections tab on this page and start a new search against the selected entity.
- Click one of the bars on the chart to switch to the Alerts & Detections tab on this page and start a new search against the selected entity, using the time range of the clicked bar.
- Click the View more link to open the Entity fields view and display all of the entity fields associated with the user. To copy an entity field to the clipboard, click the checkbox next to the entity field, click View actions, and click Copy entity. Click the checkbox at the top to select all of the entities.
- Associated entities: Displays entities that this user is related to, such as domains the user contacted or assets the user accessed. The list includes the type of entity, when it was first seen in your enterprise, and when it was last (most recently) seen. Click an entity to open the Entity context panel.
- Entity context: Displays details about the entity you select in the Associated Entities panel. The information in this panel is different depending on the type of entity (for example, asset or domain).
View and manage information in the Visualize tab
Use the Visualize tab to turn the data from your STATS search results into a chart, graph, or table.
Use common tools for tables
On the SIEM Search page, most panels that contain a single table support the same common functions and tools.
This section describes the following common functions and tools:
- Search box. Use the search box to find matching results in the adjacent table.
- Manage table columns and share column sets (Column Manager).
- Wrap Text - Unwrap Text button. It's useful to wrap text to see entire long strings in a column.
- Download search results from a table.
- Rows per page tool at the bottom of the table. You can use this tool to improve browser stability and performance when loading a large number of result records (rows), Google SecOps provides paginated search results. Use the Rows per page list, on the Events table, to select the number of rows to display per page (25 to 1,000 events).
Manage table columns and share column sets (Column Manager)
To use a consistent view when analyzing event data, you can create, save, and share custom column sets for the following tables on the SIEM Search page:
- In the Results panel, for the following tables: Events, Raw Logs, Joins
- In the Alerts & Detections tab, for the Detections table.
To use this functionality, your user account or Identity and Access Management role must have all five of the following permissions:
chronicle.googleapis.com/savedColumnSets.createchronicle.googleapis.com/savedColumnSets.updatechronicle.googleapis.com/savedColumnSets.deletechronicle.googleapis.com/savedColumnSets.listchronicle.googleapis.com/savedColumnSets.get
Create a column set
The steps to create a column set differ slightly depending on which table you are working with.
To create a column set for the Events, Raw Logs, or Joins table, do the following:
- Click Columns to open the Column Manager.
- Click the filter_alt Filter icon to specify whether to show non-applicable columns.
- Click the Show selected toggle to display only the selected columns in the Events Columns tab.
- On the Events Columns tab, add or remove columns for your column set. You can browse or search fields across collapsible sections (which vary depending on the type of the search result)—for example, Quick fields (the most-common fields per data type), Grouped Fields, All Event Fields, and All Entity Fields. Toggle checkboxes to show or hide columns.
- Arrange the columns, and then click Save. The Save Column Set dialog opens.
- Select one of the following options:
- Save: Enter a new name for your column set.
- Replace: If you have modified a previously saved set, you can overwrite the existing set with your changes.
- Click Save. The column set is listed in the Columns Sets tab.
To create a column set for the Detections table, do the following:
- Click Columns to open the Column Manager.
- Click the filter_alt Filter icon to specify whether to show non-applicable columns.
From the Table Type list, select the table type for which you want to create a column set:
- Detections
- Events
- Entities (View columns by expanding table rows.)
Making changes to a specific table type will only apply to tables and subtables of that type.
Click the Show selected toggle to display only the selected columns in the corresponding tab (Detections Columns, Events Columns, or Entities Columns).
On the corresponding tab, add or remove columns for your column set. You can browse or search fields across collapsible sections (which vary depending on the type of the search result). Toggle checkboxes to show or hide columns.
Arrange the columns, and then click Save. The Save Column Set dialog opens.
Select one of the following options:
- Save: Enter a new name for your column set.
- Replace: If you have modified a previously saved set, you can overwrite the existing set with your changes.
Click Save. The column set is listed in the Columns Sets tab.
Share a column set
To share a column set with all other users in your Google SecOps tenant:
- Click Columns to open the Column Manager.
- On the Events Columns tab, add or remove columns for your column set. You can browse or search fields across collapsible sections (which vary depending on the type of the search result)—for example, Quick fields (the most-common fields per data type), Grouped fields, All event fields, and All entity fields. Toggle checkboxes to show or hide columns.
- Arrange the columns, and then click Share. The Share Column Set dialog opens.
- Select one of the following options:
- Share New: Enter a new name for the column set to be shared.
- Share Existing: Select a previously saved set from the list.
- Click Share. The column set is listed in the Columns Sets tab with a SHARED badge.
Load a saved column set
To load a saved set of columns, do the following:
- Click Columns to open the Column Manager.
- Select the Columns Sets tab.
- Select the column set to load and click Apply.
Delete a saved column set
To delete a saved set of columns, do the following:
- Click Columns to open the Column Manager.
- Select the Columns Sets tab.
- Select the column set, click More > Delete.
Download search results from a table
You can download and save a CSV file that contains the contents of a table displayed in the SIEM Search page. For the Events table or a pivot table, there's also an option to bundle the original raw logs, which gives you precise correlation between parsed UDM records and their source telemetry. This feature is designed for teams that require external analysis processing, audit trails for compliance where you must preserve the relationship between normalized data and original ingestion, or external correlation.
To download search results (up to the specified maximum number of search results) from the Events table:
- Optional: Use the Column Manager to specify which UDM fields to include in the CSV. The Raw Log column is appended based on your selection.
Click Download at the top of the table and select one of the following:
- Download as CSV: Downloads the matching events (and according to the displayed exact number of specified events).
- Download as CSV (with raw logs): Downloads the matching events and appends original unparsed log strings as a dedicated column next to each normalized UDM record (and according to the displayed exact number of specified events).
Save the file.
To download search results (up to the specified maximum number of search results) from tables on the Result tab, other than the Events panel or Pivot panel:
- Click Download at the top of the table and select Download as CSV. This downloads the matching results (and according to the displayed exact number of specified events).
- Save the file.
To download search results (up to the specified maximum number of search results) from the Detections table:
- Click Download at the top of the table and select Download as CSV. This downloads the matching results (and according to the displayed exact number of specified events).
- Save the file.
Supported fields when saving a CSV
You can download the following fields to a CSV file from the platform:
userhostnameprocess nametimestampraw log: Valid only when raw logs are enabled for the customer- All fields starting with
udm.additional
Valid field types when saving a CSV
You can download the following field types to a CSV file:
doublefloatint32uint32int64uint64boolstringenumbytesgoogle.protobuf.Timestampgoogle.protobuf.Duration
Unsupported fields when saving a CSV
Fields meeting any of the following criteria can't be downloaded to CSV:
- Field type: Data types defined as a Message or Group in the UDM proto.
- Field depth: Fields nested more than 10 levels deep.
Specific UI fields: The following fields shown in the UI aren't supported for direct download:
Event Fields:
- Event Status
- Event Summary
Event Type
Entity Context Graph:
- First Seen
- Last Seen
- Timestamp
Federated Search:
- Instance Code
Limits and quotas
Google SecOps enforces limits on search queries to ensure platform stability and consistent performance across programmatic and web interfaces. These limits apply to both Backstory and Chronicle APIs.
Search and API quotas
The following limits apply to the number of search queries and simultaneous operations per tenant:
- Queries per hour (QPH): Web console interface limit of 1,000 QPH; programmatic API access limit of 2,000 QPH.
Simple queries (spanning < 24 hours, single source, no stats): Maximum concurrency limit of 180 simultaneous queries per tenant.
If your simple-query concurrency pool exhausts, your operations will automatically overflow into your available complex-query quota.
Complex queries (spanning > 24 hours, multi-source, or including stats): Maximum concurrency limit of 180 simultaneous queries per tenant.
UDM field prompt limit: A single query is limited to referencing a maximum of 100 UDM fields inside the prompt.
Quota errors
When a limit is reached, the web interface displays a persistent quota error notification. For programmatic access, API calls (such as instances.udmSearch) return an HTTP status 429 RESOURCE_EXHAUSTED error containing a google.rpc.QuotaFailure message that details the specific limit you exceeded.
Result-set and display limits
To ensure consistent platform stability and fast response times across web and API interfaces, Google SecOps enforces the following limits:
| Search type or data source | Maximum number of returned results | Web console display behavior |
|---|---|---|
| UDM event search (Results > Events) | 1,000,000 records | Displays the latest records across paginated rows (25 to 1,000 per page).Use Search Settings > Max Results to Return to adjust the backend limit (1 to 1,000,000, default 30,000). |
| Entity Context Graph and overview (Overview) | 1,000,000 records | Organized into independent Timed and Timeless views inside the Overview tab with separate pagination. The Timed tab displays entities that have a defined time range. The Timeless tab displays entities that don't have a specific time range. |
| Data Tables and Joins | 1,000,000 records | Correlated rows surface in Results > Events panel based on theColumn Manager configuration. |
| Cases and Case History | 1,000,000 records | Surfaced directly in the Cases and Case History panels.Surfaced in the Overview context or using Search Cases queries. |
| Stats (Results > Stats) | 100,000 records (UI and long-running operation API only) | Charts render top values for readability; displays warning notice when exceeding visual limits. |
| Pivot aggregations (Results > Pivot) | 100,000 records | Charts render top values for readability; displays warning notice when exceeding visual limits. |
| Rule detections (Alerts and Detections) | 100,000 records | Surfaced directly in the combined Alerts and Detections tab. |
Optimize and refine your search results
This section outlines performance limitations and expectations, and provides self-service fixes for common issues with the SIEM Search page in Google Security Operations.
Performance optimization and best practices
To optimize query speed and minimize timeout risks:
- Narrow your time window first: Time is the most effective filter. Querying the exact 2-hour window of an incident runs exponentially faster than searching a 30-day window.
- Query exact UDM fields instead of grouped aliases: Although grouped fields (
ip = "1.2.3.4") are convenient, they force the engine to check 15+ underlying fields (principal.ip,target.ip,observer.ip). If you know an IP address belongs to the destination server, querytarget.ip = "1.2.3.4"directly. - Avoid leading wildcards in regular expressions: Queries starting with a wildcard (
principal.hostname = /.*server-.*/) prevent index lookups and force full table scans. Anchor your regular expression whenever possible (principal.hostname = /^prod-server-.*/). - Leverage indexed metadata: Filter by
metadata.event_type(NETWORK_CONNECTION,PROCESS_LAUNCH,USER_LOGIN) ormetadata.log_typeearly in yourANDchain to prune irrelevant log sources instantly. - Use
limit: Nfor rapid data sampling and quick previews: You can add thelimit: Nkeyword directly to your query (for example,metadata.event_type = "USER_LOGIN" limit: 50) for rapid data sampling and quick previews.
Best practices for broad searches
If your search is too broad, Google SecOps displays a warning message indicating that not all search results can be shown. In such cases, the system retrieves only the latest results, up to the search limit of one million events and 1,000 alerts. However, there may be many more matching events and alerts that aren't displayed.
To capture all relevant results, refine your search by applying additional filters, for example:
- Narrow the time range to reduce the dataset size.
- Use specific search queries or filters instead of broad terms.
- Query precise UDM fields instead of grouped fields when you need results for a single field.
Debug and refine queries
This section describes how to debug and refine queries.
View runtime errors
If your query returns an error, the specific runtime error message appears persistently in the Results panel. This persistent display ensures the error context remains visible, helping you troubleshoot and resolve the error.
Limit your search results
You can limit search results by adding the limit keyword with the maximum
number of search results you want to display. This is useful for generating
quick previews of data, performance optimization, or when you only need a subset
of the results. For example, if you add limit: 25 to your search, it limits the results to a maximum of 25.
Investigate large datasets
Google SecOps supports returning and navigating up to 1 million results. This lets you investigate large datasets directly in the web interface without exporting results. For large searches, the visible fields are limited by default.
Result limits for data sources
The following table lists the maximum number of results returned for each data source:
| Search type or Data source | Maximum number of events or rows in search results |
|---|---|
| UDM | 1,000,000 |
| ECG | 1,000,000 |
| Data table | 1,000,000 |
| UDM to UDM join | 1,000,000 |
| UDM to ECG join | 1,000,000 |
| UDM to Data table join | 1,000,000 |
| Cases and case history | 1,000,000 |
| Stats | 100,000 |
| Detections | 100,000 |
Add a filter to refine your query
To add a filter to refine your query, do the following:
- On the SIEM Search page, click filter_listAdd filter. A dialog opens that lets you select a field, and show (
=) or filter-out (!=) field values. Configure the dialog parameters.
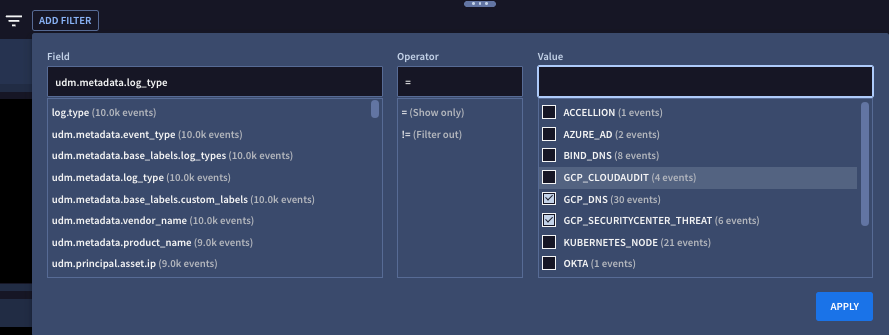
Figure 8. Example of the filter dialog.
Click Apply. The filter is displayed next to the filter_list Add filter button and any search results are filtered accordingly.
Optional: Do one of the following:
- If you want to automatically incorporate the filter into the query editor and run the search, click Apply to search and run.
- If you want to delete the filter, click Clear.
Troubleshooting
If you receive a generic error message, such as Error: Search has encountered an error and could not load data, take the following steps to resolve the issue:
- Connect to Google SecOps from a different network. For example, use a cloud VM to help identify any network issues.
- Make sure Chronicle API calls are allowed by your organization's firewall or proxy configuration or policy.
- Verify that no data limit is configured for Search API calls, as searches can return large datasets.
- Check for any configured timeouts. Search queries can run asynchronously and can require more time to return data. If timeouts are set, ensure they allow a sufficient duration, such as 60 minutes, before the query times out.
If the error persists, contact Customer Support.
What's next
For more information about search queries, see the following:
- Understand search syntax contains details and examples on the YL2 syntax needed to construct and query data values, escapes, and operators in the query editor.
- Search best practices.
- Search cases and case history in unified search.
- Generate UDM Search queries with Gemini.
- Use context-enriched data in search.
For more information about search results, see the following:
- Investigate an entity using UDM search.
- Investigate detections in Search describes how to use the Alerts & Detections tab on the SIEM Search page.
- Understand data availability for search details the data ingestion lifecycle, including end-to-end data flow and latency, and how these factors impact the availability of recently ingested data for querying and analysis.
- UDM search compared with rule results describes how to compare UDM search query results with live detection rules.
Need more help? Get answers from Community members and Google SecOps professionals.