
Collect SOAR platform logs
You can manage and monitor Google Security Operations SOAR logs in the Google Cloud Logs Explorer. You can also use Google Cloud tools to set up special metrics and alerts that are triggered by specific events in your SOAR operation logs.
The logs capture essential data from SOAR's Extract, Transform, Load (ETL), playbook, and Python functions. The logs capture data types including the running of Python scripts, alert ingestion, and playbook performance.
Enable SOAR log collection
Google SecOps provides operational logs for SOAR activities, including playbook executions, connector runs, and Python script outputs.
Google SecOps (SIEM + SOAR Unified): By default, the system enables collection of SOAR logs. The platform automatically configures log sinks to route these logs to Cloud Logging in your Google Cloud project. You don't need to perform any manual configuration.
SOAR Standalone: You must manually configure a service account and provide the credentials to Google SecOps Support to enable log export. See the following section for instructions.
The system automatically routes SOAR logs to the _Default cloud
logging bucket. Because this incurs costs, Google recommends setting up exclusion filters
to drop low-value logs or to adjust retention periods. For more information on collecting
logs and setting up filters, see Logging overview.
Set up SOAR logs for SOAR Standalone
To set up SOAR log collection for SOAR Standalone, follow these steps:
Create a Service Account in the Google Cloud project where you plan to view the logs. For details, see Create service accounts.
In the Google Cloud console, go to IAM & Admin > IAM.
Locate the Service Account you created and click edit Edit principal.
In the Assign Roles section, add the Logs Writer role. For more information, see the predefined Logs Writer role.
Click Save.
Go to IAM & Admin > Service Accounts.
Select the service account you created.
Click More and select Manage Permissions.
In the Permissions section, click Grant Access.
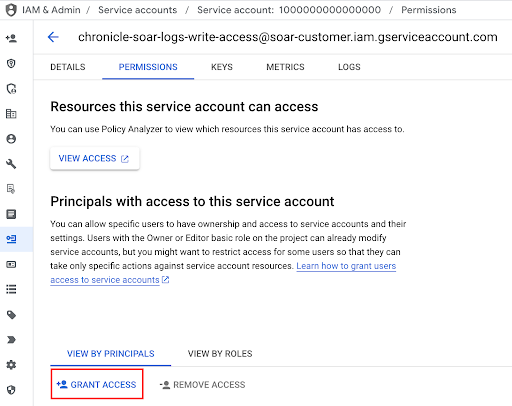
In the New principals field, add the following principal:
gke-init-backgroundservices@{SOAR-GCP-Project-Id}.iam.gserviceaccount.comReplace
{SOAR-GCP-Project-Id}with your SOAR Google Cloud Project ID. If you don't know theSOAR-GCP-Project-Id, submit a ticket through Google Support.In Assign Roles, select Service Account Token Creator. For more information, see Service Account Token Creator.
Click Save.
Provide the name of the configured Service Account to the Google SecOps support team.
Access Google SecOps SOAR logs
Google SecOps writes SOAR logs in a separate namespace called
chronicle-soar and categorizes them by the service that generated the log.
To access Google SecOps SOAR logs, do the following:
In the Google Cloud console, go to Logging > Logs Explorer.
Select the Google SecOps Google Cloud project.
Enter the following filter in the query field and click Run Query:
resource.labels.namespace_name="chronicle-soar"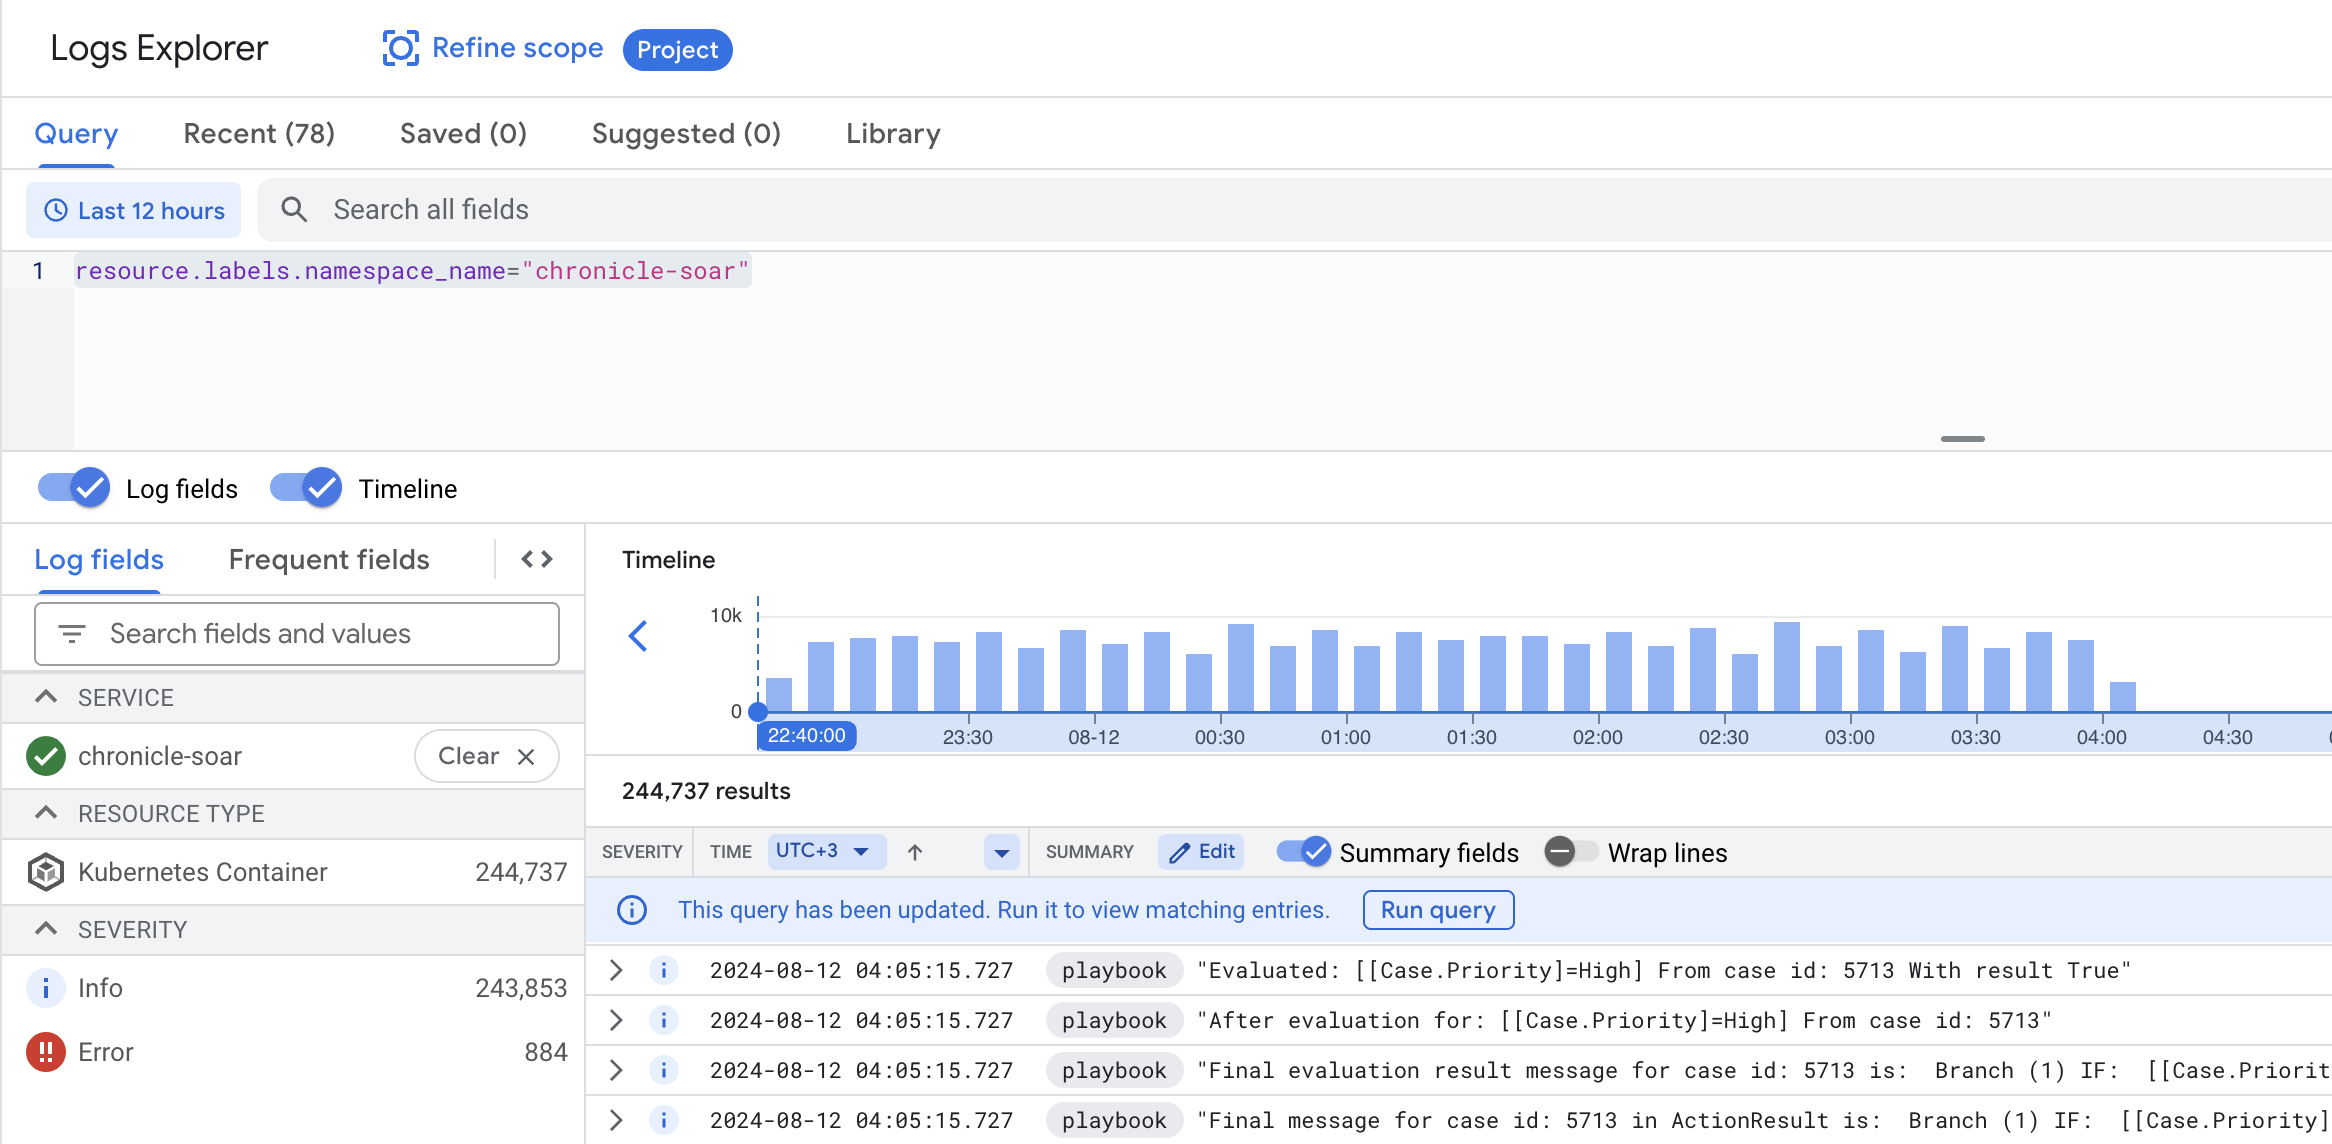
To filter logs from a specific service, enter the following filters in the query field and click Run Query:
resource.labels.namespace_name="chronicle-soar"
resource.labels.container_name="<CONTAINER_NAME>"
Replace
<CONTAINER_NAME>with the relevant service container:playbook,python, oretl.
Playbook step debugging
You can view execution logs for an individual playbook step directly from the Playbook tab in the Cases page. This lets you inspect the logic and outcome of every step, regardless of its execution status.
To view logs for a specific step:
- In the Case View, open the Playbook tab.
- Select a step to view its results.
Click View Logs Explorer.
The link opens the Logs Explorer in the Google Cloud console with a pre-configured filter for the specific execution ID of that step.
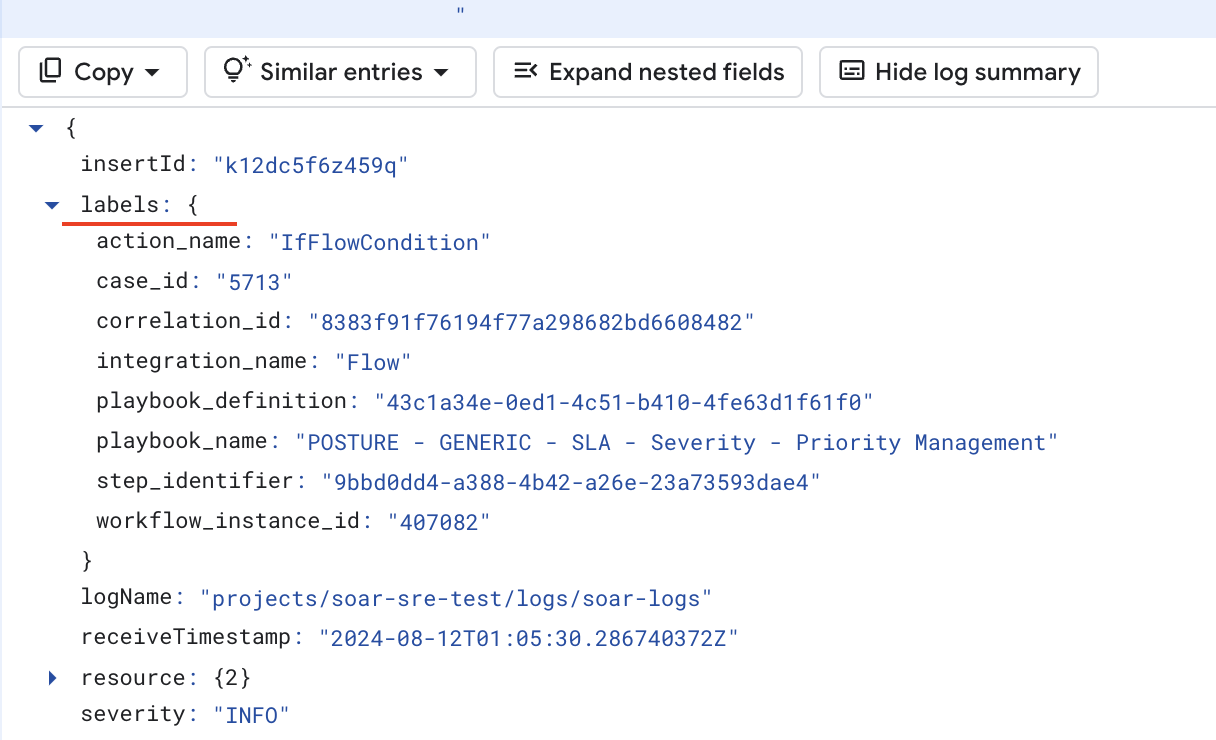
Filter logs using labels
Log labels provide an efficient and convenient way to refine a query
scope. You can find all labels in the labels section of each
log message.
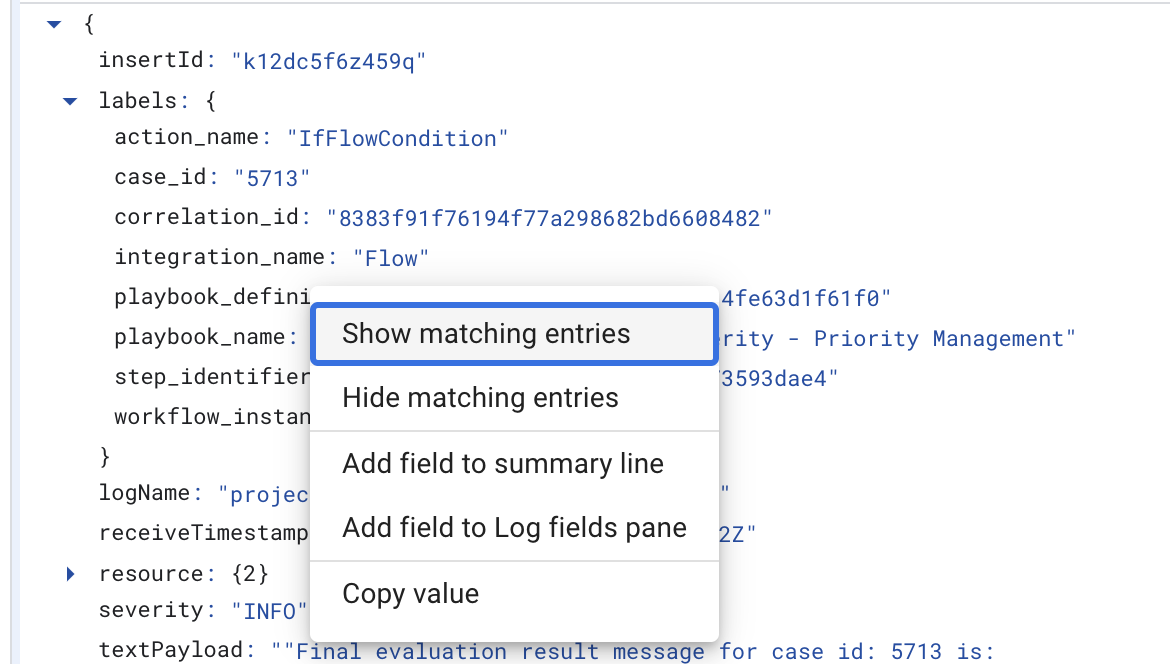
To narrow the log scope, expand the log message, right-click each label, and hide or show specific logs:
Playbook log labels
The following labels are available for the playbooks:
playbook_definitionplaybook_nameblock_nameblock_definitioncase_idcorrelation_idintegration_nameaction_name
Python log labels
The following labels are available for the Python service, filtered by resource.labels.container_name="python":
Integration and Connector labels
integration_nameintegration_versionconnector_nameconnector_instance
Job labels
integration_nameintegration_versionjob_name
Action labels
integration_nameintegration_versionintegration_instancecorrelation_idaction_name
ETL log labels
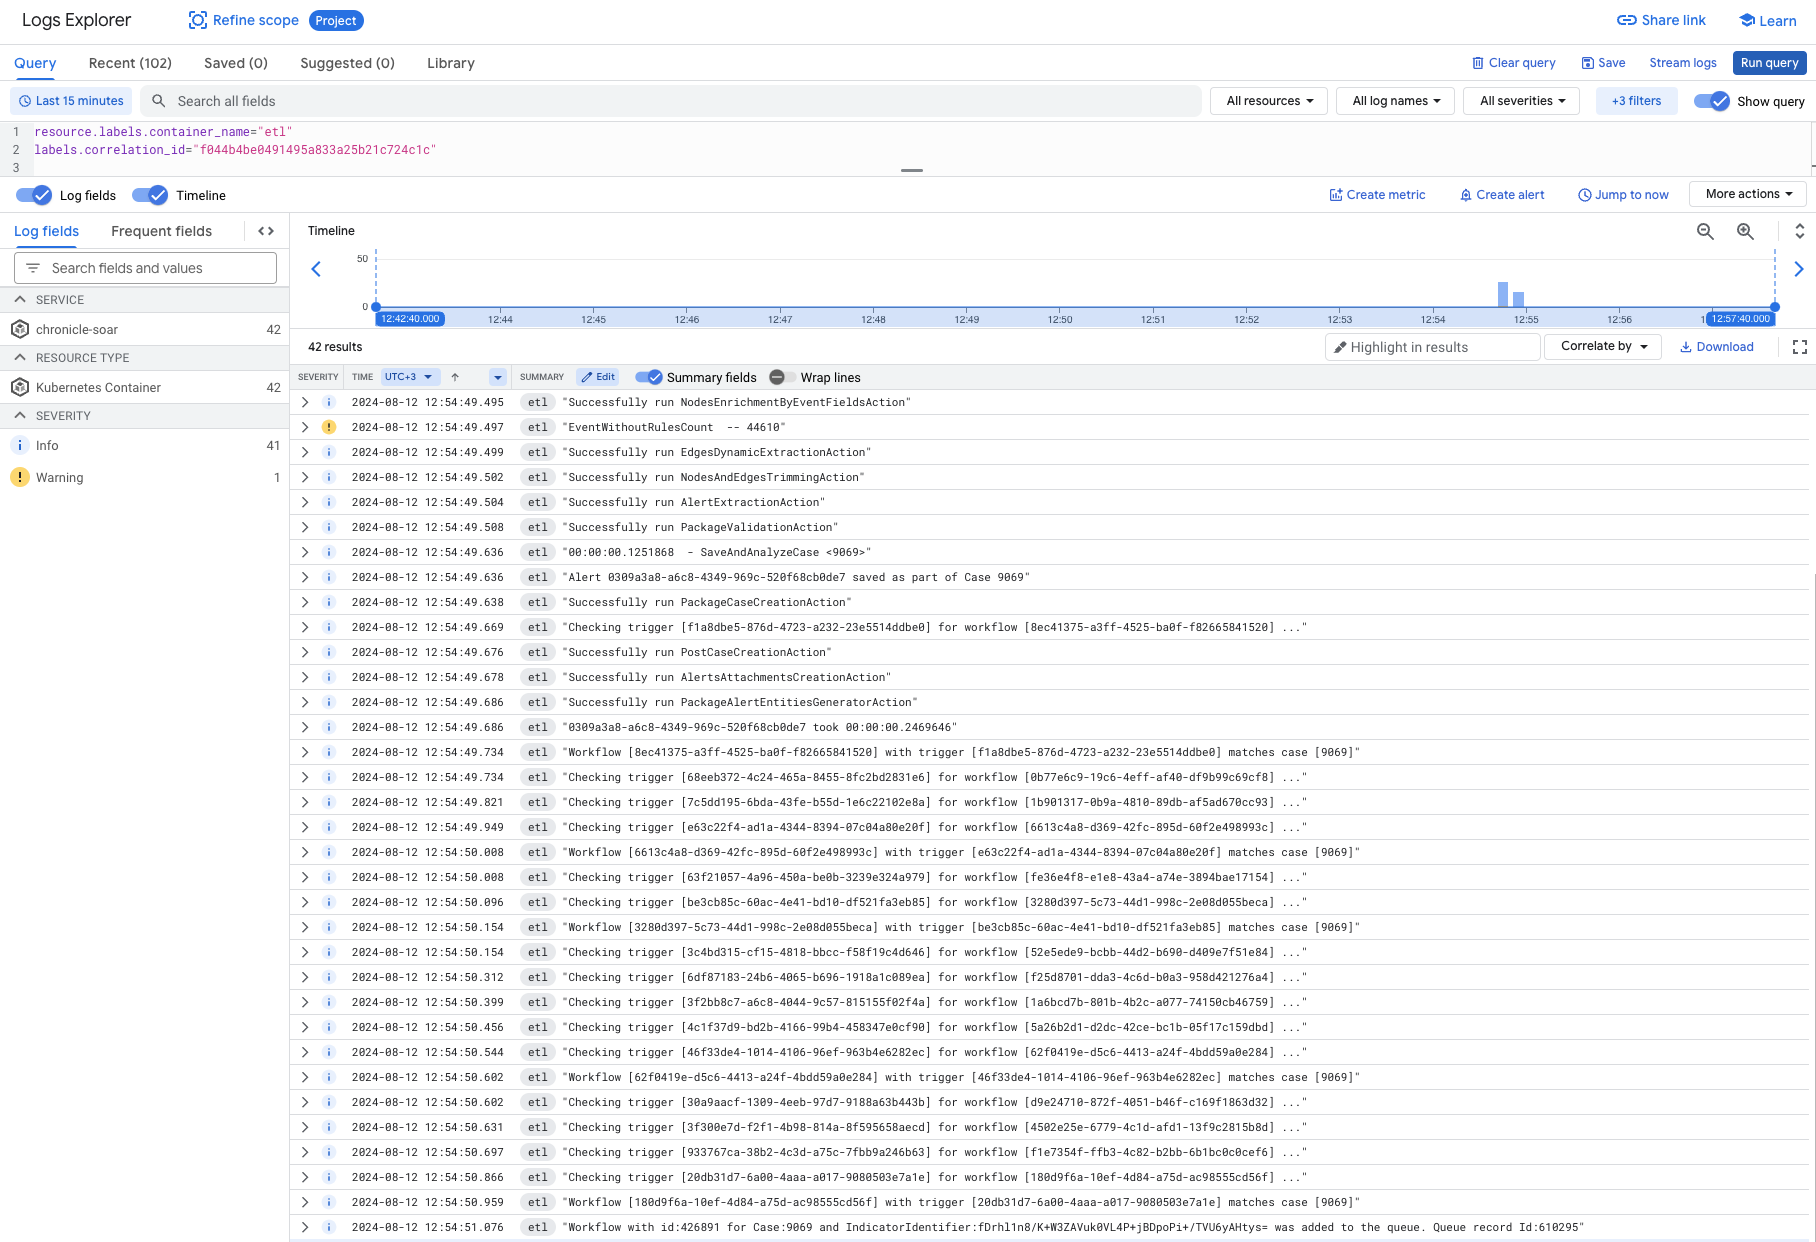
The following labels are available for the ETL service, filtered by resource.labels.container_name="etl":
correlation_id
For example, to trace the ingestion flow for an alert, filter by
correlation_id:
Need more help? Get answers from Community members and Google SecOps professionals.