
This page applies to Apigee and Apigee hybrid.
View
Apigee Edge documentation.

This page describes how to create and view security reports in Apigee in Cloud console.
For an overview of security reports, including limitations, see Security reports overview.
Access security reports
To open the Security reports view in Apigee in Cloud console, go to the Advanced API security > Security reports page.
This displays the main Security reports view:
At the top of the page, you can select:
- The environment in which you want to create a report.
- The Report type filter. The options are:
- All
- Active
- Failed
- Expired
Below those options, the security reports are displayed in table rows. Each row displays these report details:
- The Report Name. Click the report name to view the report.
- The report Status, which can be one of the following:
- running: The report is currently running and cannot be viewed yet.
- completed: The report is completed and can be viewed or exported.
- expired: The report has expired and can no longer be viewed or exported in the UI. To view a report after the expiration date, you must export it before that date. After 30 days, the report is removed from the list of available reports.
The Start time and End time display the start and end dates and times for the report.
- Submitted date: The date and time the request for the report was submitted.
- Expiration time: The date and time when the report expires and can no longer be viewed in the Apigee UI. The expiration date is 7 days after the time when you created the report. After 30 days, the report is removed from the list of available reports. You cannot view or export reports in the UI after their expiration date.
- File size: The report file size. You might need to modify the report criteria in order to create a report with a file size below the maximum file size. See Limitations on security reports for information on the maximum file size and specific ways to reduce the file size.
- Export: Exports/downloads the report in a zip file. Export is only available if the status of the report is completed.
Create a new security report
To create a new security report, start by clicking +Create in the Security reports view. This opens the Create Security Report Job dialog, where you can configure the options for the report as described in the next section.
Security report options
You can specify the following options for a security report:
- Report Name: A name for the report.
- Report Date Range: Start time and end time for the report.
Note: The start and end times of the report must be in the past, and at most one year in the past when the report is created.
- Metrics: Metric for the report. See Metrics and aggregation functions for information on available metrics.
- Dimensions: Dimensions let you group metric values together based on related
subsets of the data. See
Dimensions in security reports for
information on available dimensions.
See dimensions for other dimensions supported by Advanced API Security reports.
To add multiple dimensions, click +Add a Dimension for each dimension you want to add. You can also change the order in which dimensions appear in the report by clicking the up or down arrows to the right of the dimension field.
- Filters: Filters let you restrict results to metrics with specific values.
To create
a filter, set the following fields:
- Select a name for the filter.
- Select a comparison operator.
- Select a value.
See Filters for more information on filters.
After you have selected all the report options, click Create to create the report job. You might need to wait for a while until the report is completed. You can click the Refresh button at the top right of the pane to see the completed report.
View a completed report
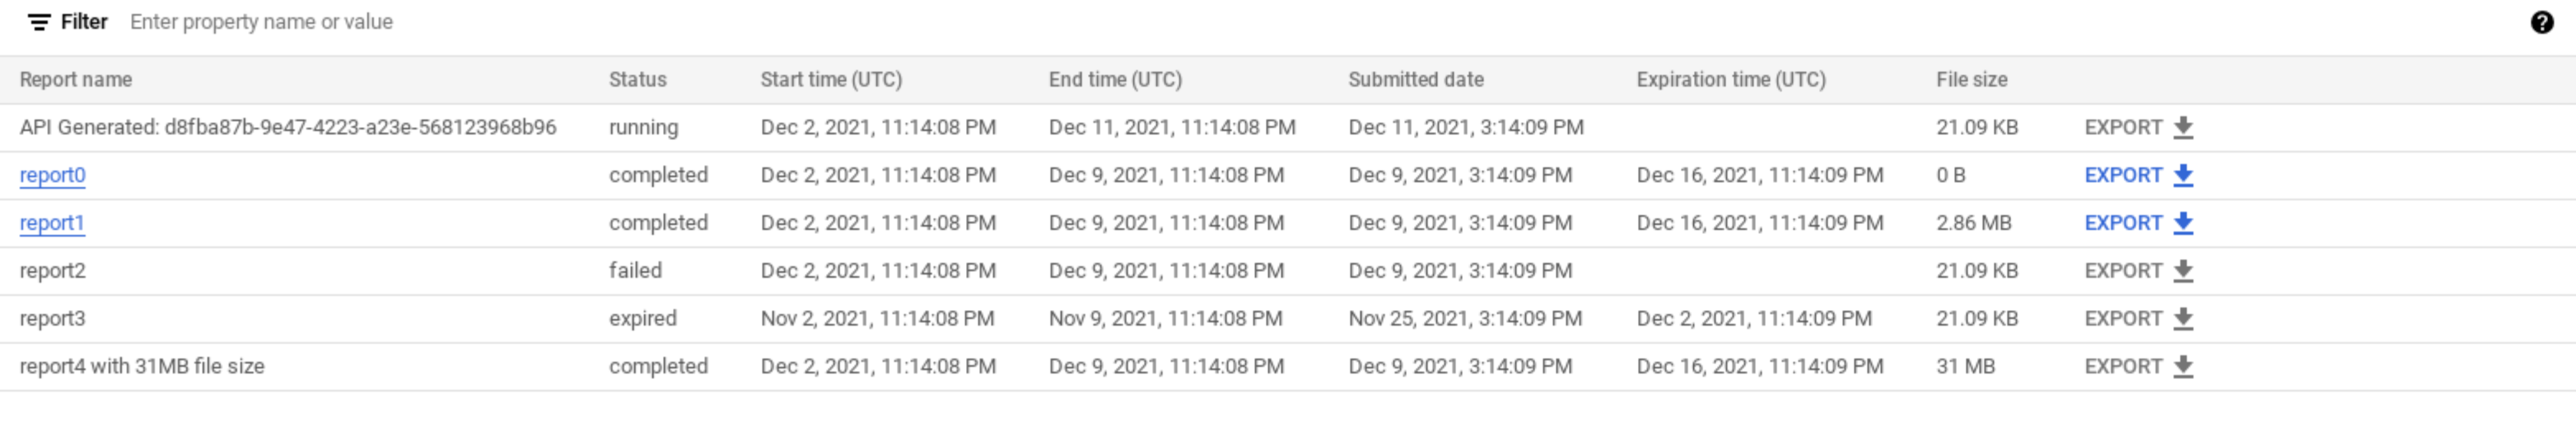
Once a report is completed, it is displayed in the table as shown below:
To view the report, either:
- Click the report name.
- Click Export in the row for that report.
Example: bot IP addresses report
The following example creates a report that shows the IP addresses of detected bots. To create the report, use the following configuration:
- Metric: bot, the number of distinct IP addresses identified as sources of bots.
- Aggregation function: count_distinct
- Dimension: Resolved Client IP
The completed report is shown below:
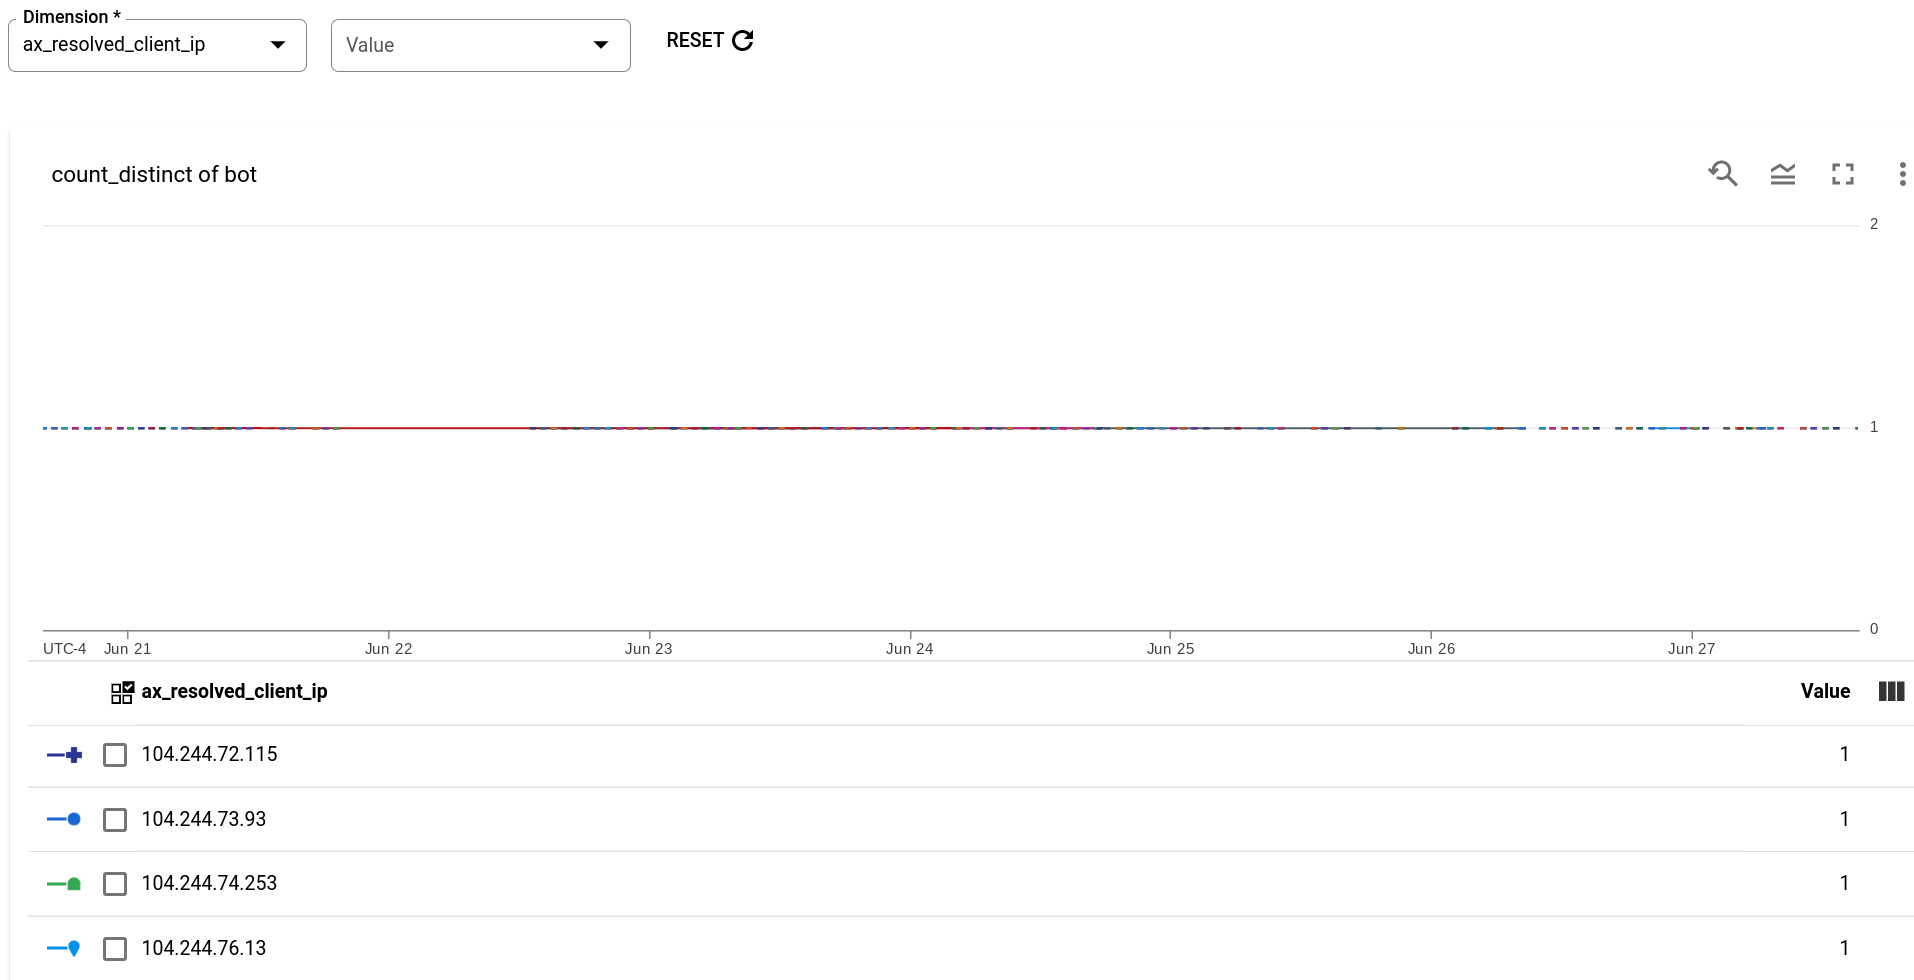
Note that the table at the bottom of the report lists IP addresses that Advanced API Security has identified as bots.
Example: bot traffic by bot reason report
The next example creates a report of bot traffic—the number of requests from IP addresses that have been identified as the sources of bots—by bot_reason—the set of detection rules that led to the bot being detected. To create the report, use the following configuration:
- Metric: bot_traffic
- Aggregation function: sum
- Dimension: bot_reason
The completed report is shown below:
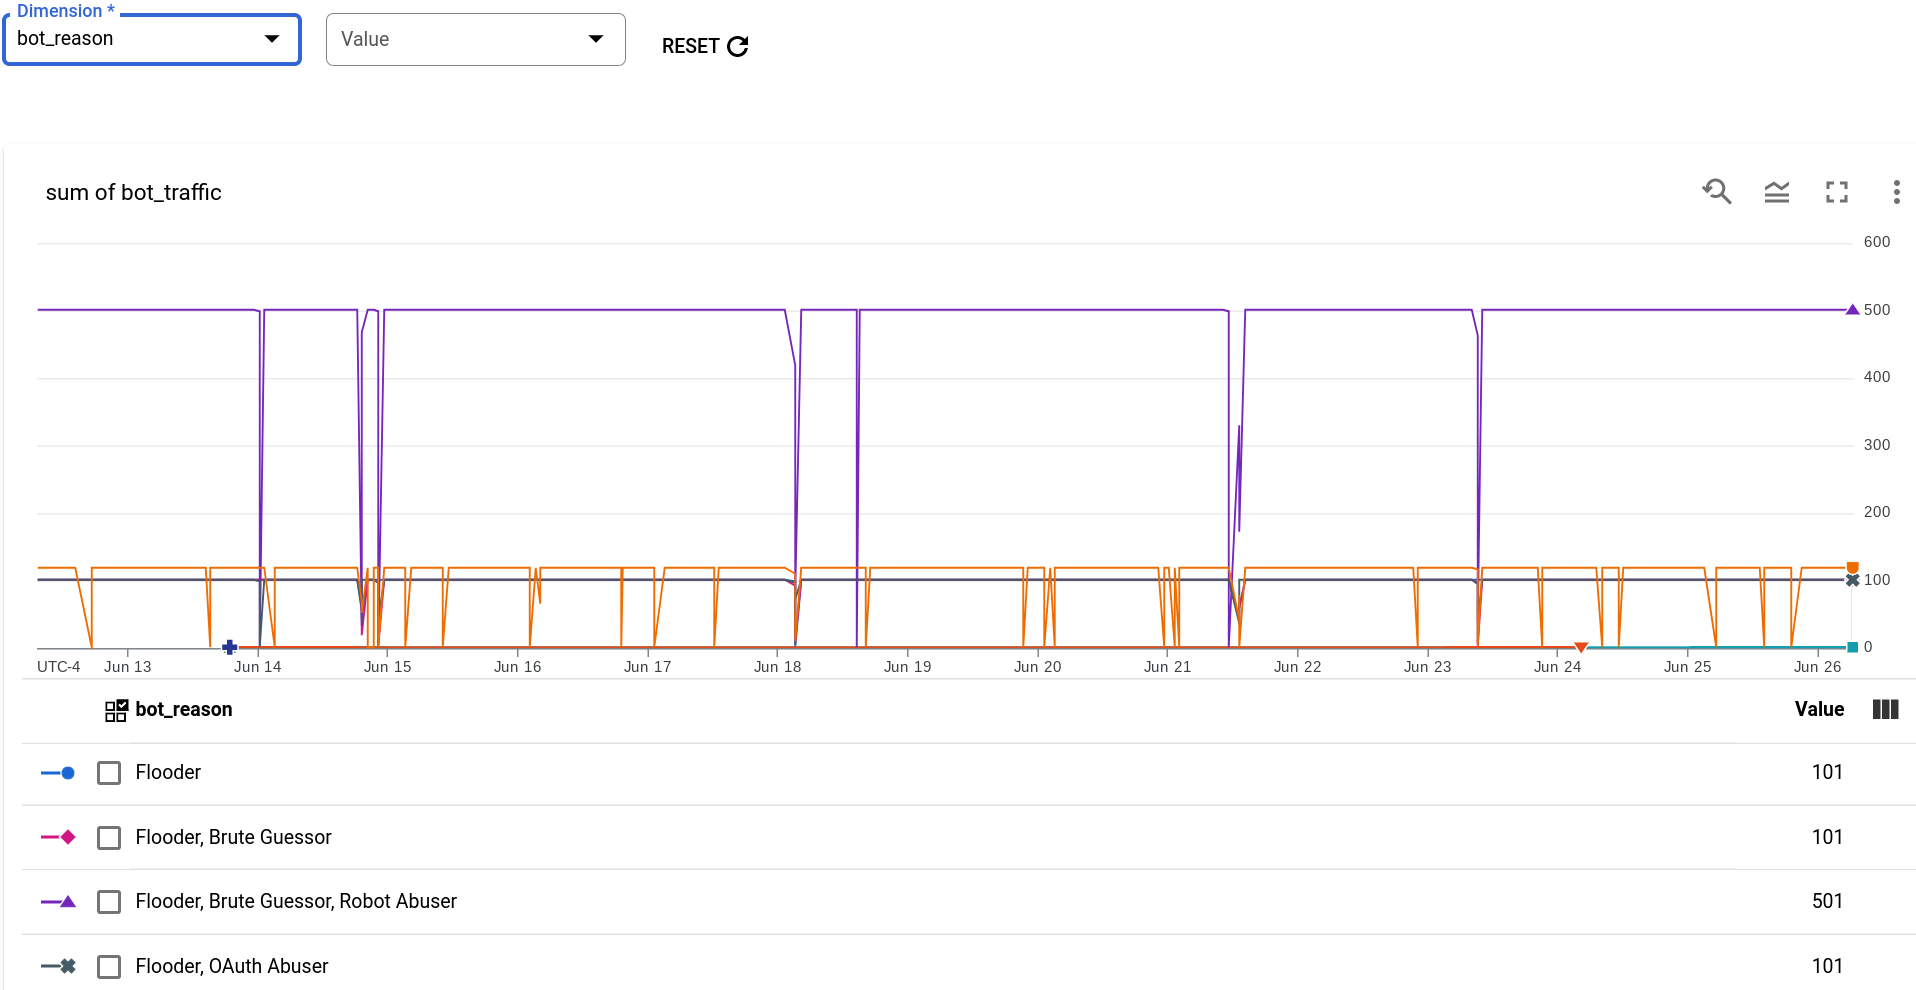
Each bot_reason consists of a subset of the individual detection rules. As you can see in the graph, The detection rule that contributed to the largest amount of bot traffic is the following set of rules:
- Flooder
- Brute Guessor
- Robot Abuser
Example: bot traffic report
The next example creates a report that isn't grouped by a dimension. If you don't want to group data by a dimension, you can set Dimension to environment. Since data is always restricted to the selected environment, this results in a report that has no grouping of data.
- Metric: bot traffic
- Aggregation function: sum
- Dimension: environment
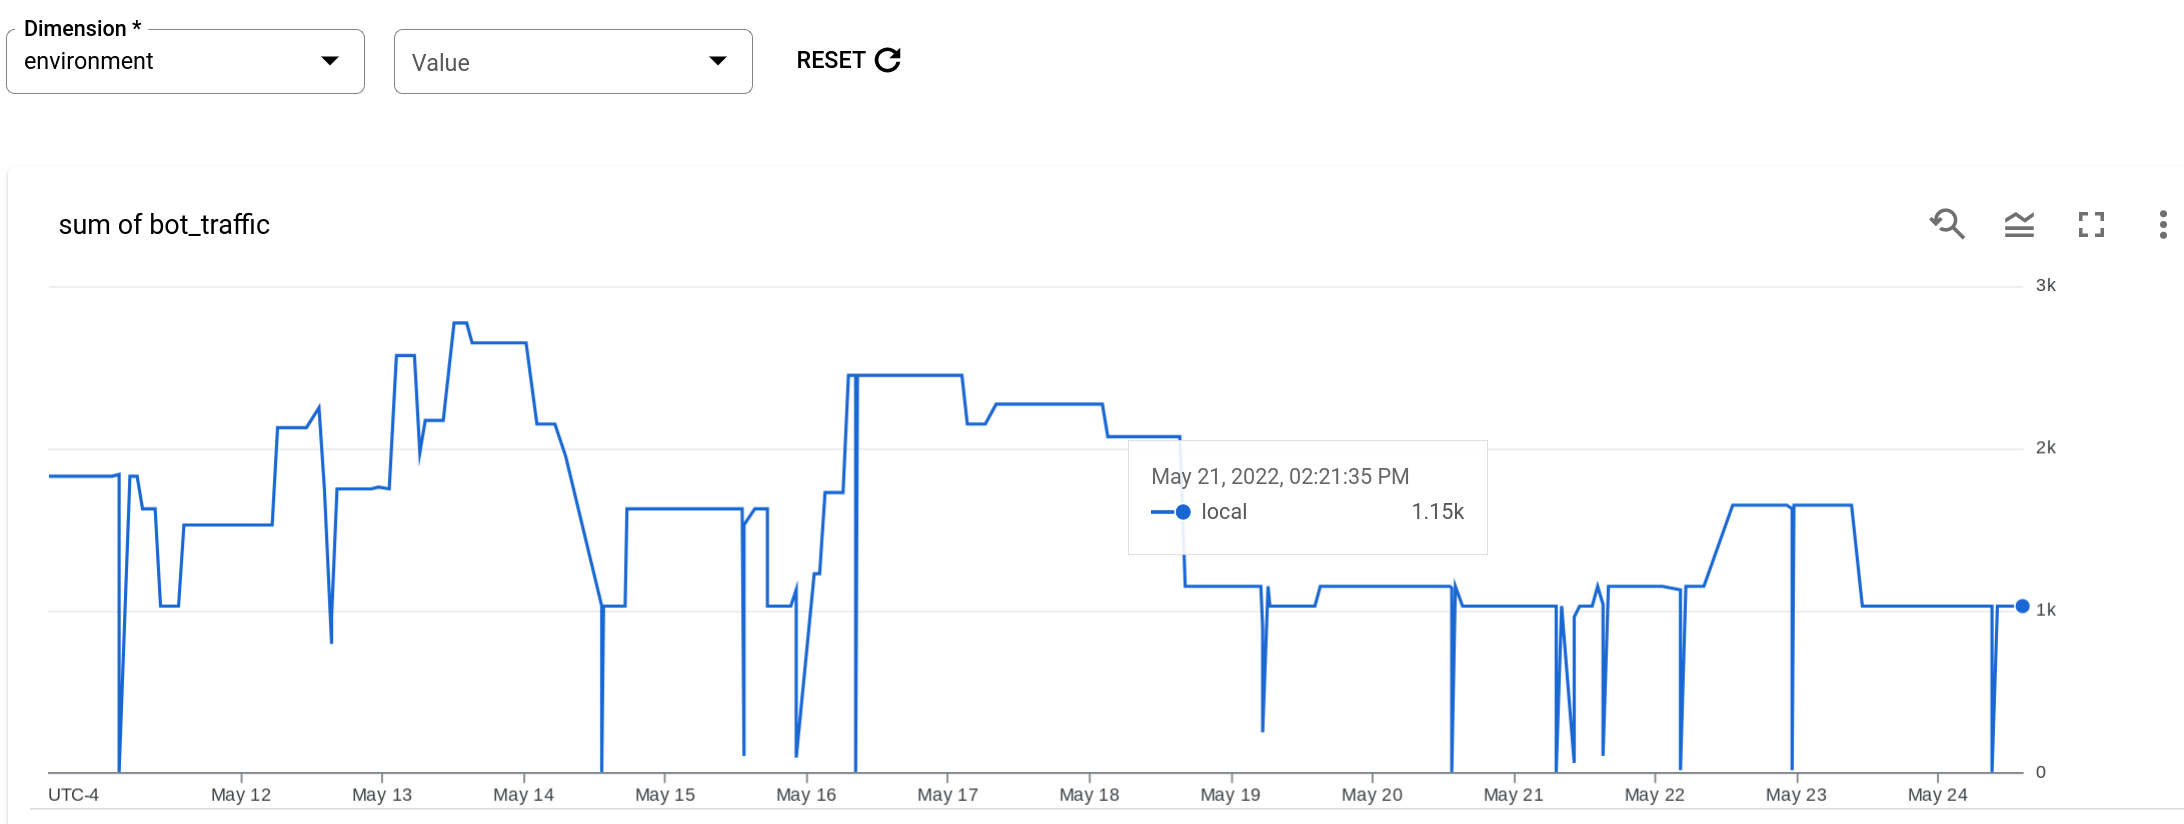
The report displays the total traffic from IP addresses that have been identified as sources of bots, for each one-minute interval throughout the report time range. Note that there is no grouping.