Using Offline Debug

This page applies to Apigee and Apigee hybrid.

View Apigee Edge documentation.

The Offline Debug tool lets you view and analyze "offline" debug sessions that were previously downloaded in the Debug view in the Proxy Editor. A saved debug session is essentially a "recording" of a debug session, and can be useful for cases where troubleshooting and further analysis is required. The UI for the Offline Debug tool is similar to the Debug view in the Proxy Editor.

To learn about the Debug Tool UI and on downloading debug sessions, see Using Debug.

Debug v2 (new)

To view downloaded debug data using Offline Debug:

  1. In the Google Cloud console, go to the Proxy development > Offline Debug page.

    Go to Offline Debug

  2. The Offline Debug view displays:

    Click to view larger image
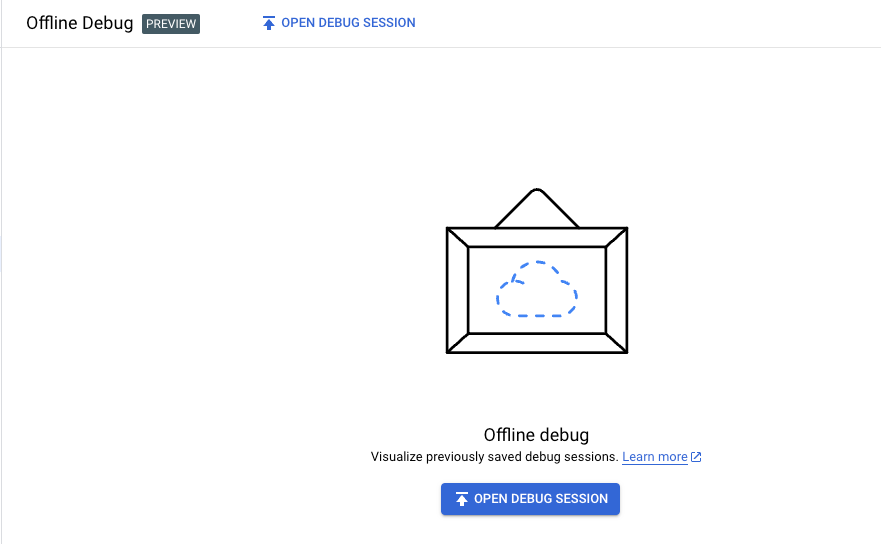
  3. To load data into the Offline Debug view, click Open Debug Session, select a previously downloaded offline debug session file in JSON format, and then click Open.

    Note: When you download a debug session in the Proxy Editor Debug view, the name of the download file has the form debug-{session ID}.json, where {session id} is the ID of the debug session; however, you can rename the file if you wish.

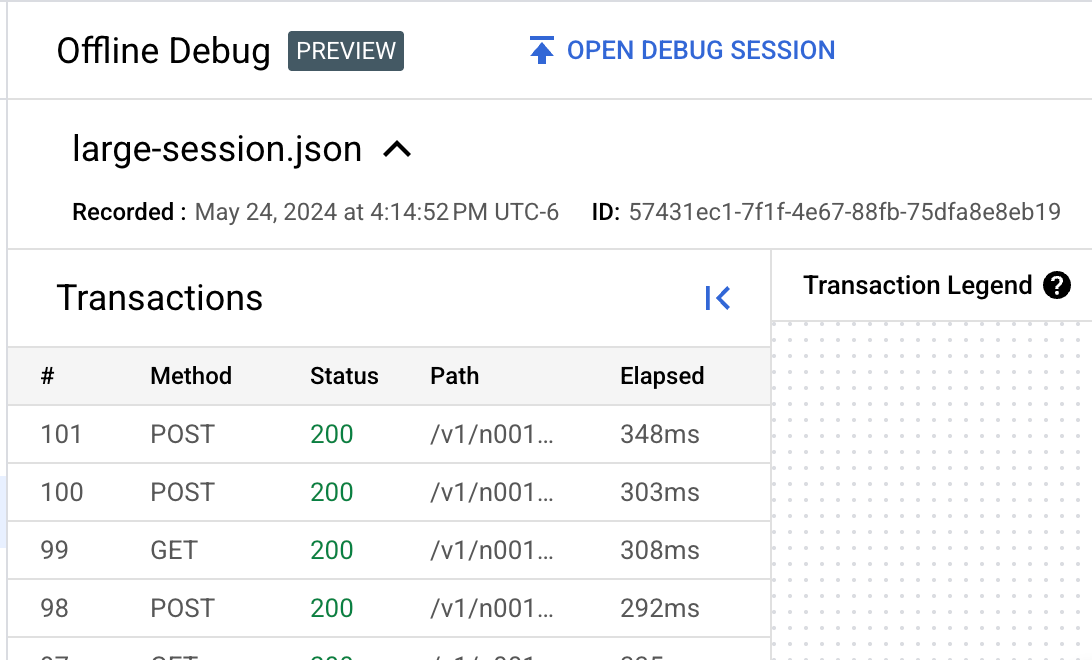
    The Apigee UI loads the debug file's data and displays all of the transactions in the list in the Transactions panel.

    Click to view larger image Offline
                Offline Debug view with debug file loaded
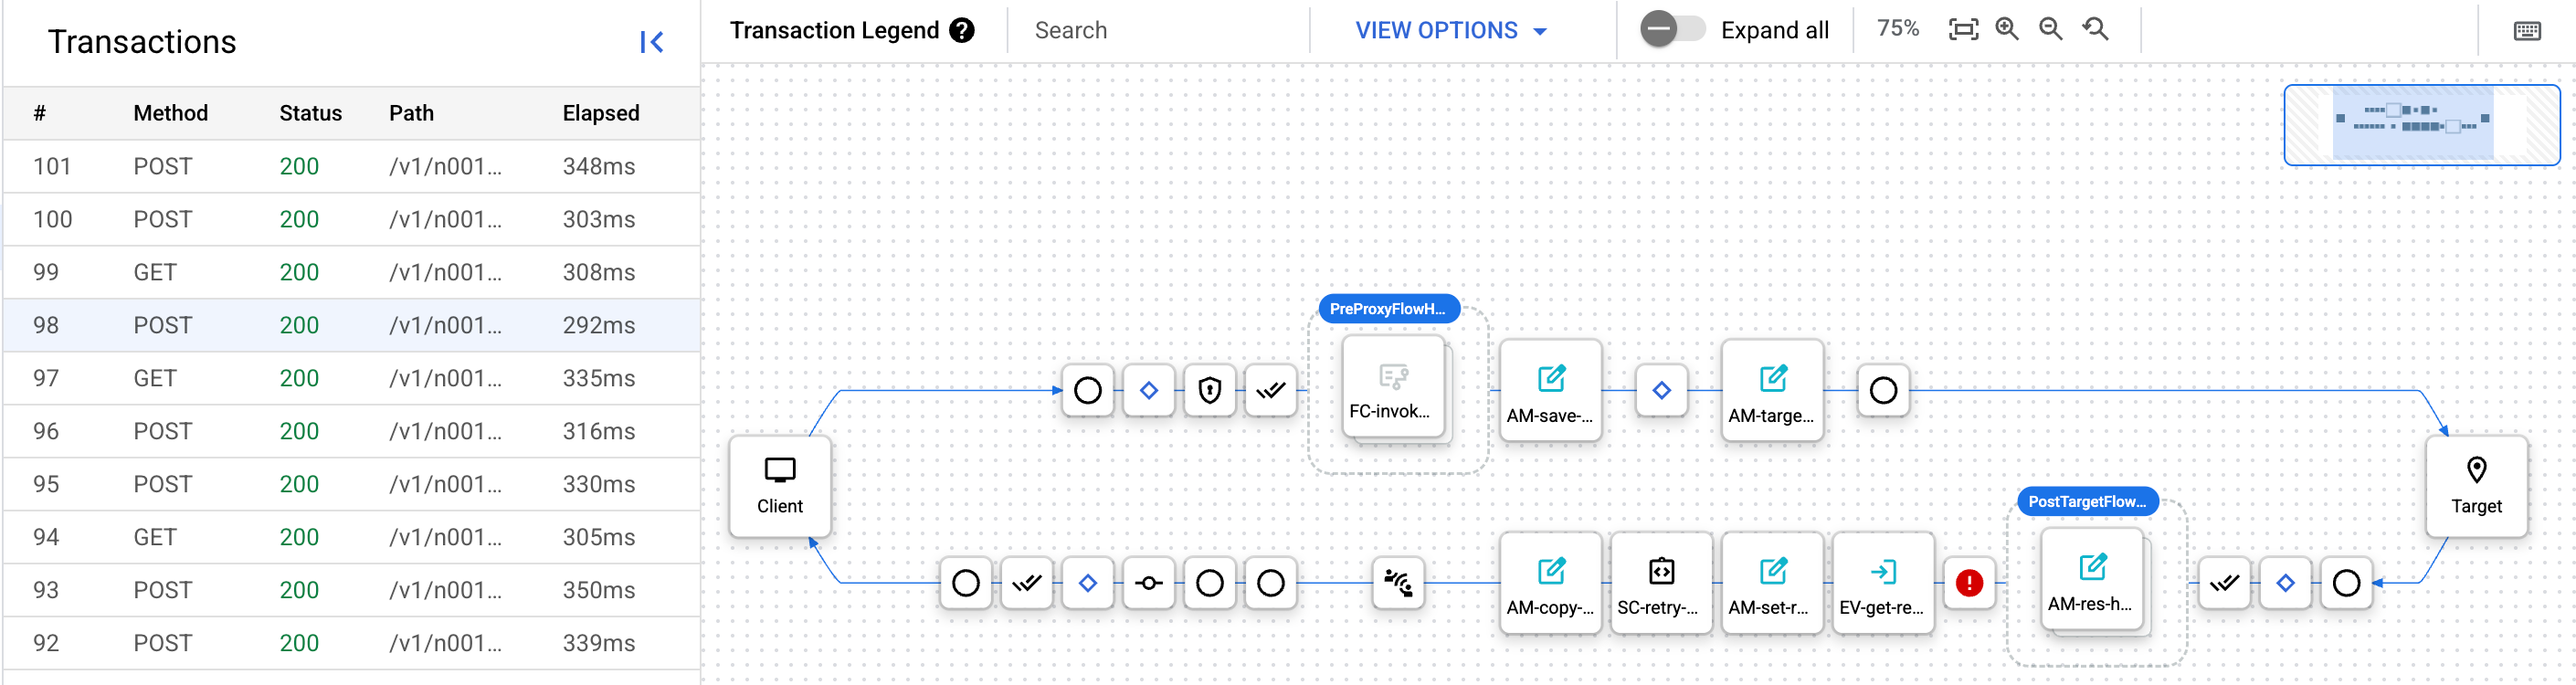
  4. Click the row for the transaction in the Transactions panel to display the transaction in the Transaction Map. Click to view larger image Downloaded transaction map

From here, you can explore the debug session just as you would for a newly-created debug session. See Creating a debug session for more information.

Debug v1

To view downloaded debug data using Offline Debug:

  1. Sign in to the Google Cloud console.
  2. Select API Proxies from the main view.
  3. Select Develop > Offline Debug.

    The Offline Debug view displays:

    Offline
            Offline Debug view in new Proxy Editor

  4. To load data into the Offline Debug view, click the Open Debug Session button and select a previously downloaded offline debug session file in JSON format.

    Note: When you download a debug session in the Proxy Editor Debug view, the name of the download file has the form 'debug-{session ID}.json', where {session id} is the ID of the debug session. However, you can rename the file if you wish.

    The Apigee UI loads the debug file's data and displays a new row for the transaction in the left-hand panel.

    Offline
            Offline Debug view with debug file loaded.

  5. Click the row for the transaction in the left-hand panel to display a Gantt chart of the transaction in a Gantt chart.

    Gantt chart of transaction steps in right-hand pane.

From here, you can explore the debug session just as you would in the Debug view in the new Proxy Editor. See the section "Viewing the Gantt chart for a request and response."