
View alerts and IOC matches
The Alerts & IOCs page displays all the alerts and Indicators of Compromise (IOCs) that are impacting your enterprise.
- To open the Alerts & IOCs page, click Detection > Alerts & IOCs.
The page contains the Alerts tab and the IOC Matches tab:
Use the Alerts tab to view the current alerts in your enterprise.
Alerts can be generated by security infrastructure, by security personnel, or by Google Security Operations rules.
In systems with data RBAC enabled, you can only view alerts and detections that originate from rules that are associated with your assigned scopes. For more information about data RBAC impact on detections, see Detections.
Use the IOC Matches tab to view the IOCs that have been flagged as suspicious and have been seen in your enterprise.
Google Security Operations continuously ingests data from your infrastructure and other security data sources, and automatically correlates suspicious security indicators with your security data. If a match is found (for example, a suspicious domain is seen in your enterprise), Google SecOps labels the event as an IOC and displays it on the IOC Matches tab. For more information, see How Google SecOps automatically matches IOCs.
In systems with data RBAC enabled, you can only view IOC matches for assets that you have permission to access. For more information, see Impact of data RBAC on Google SecOps features.
On the IoC matches dashboard, you can view IOC details, such as the confidence score, severity, feed name, and category.
Configure common view options on the Alerts & IOCs page
This section describes the common view options that you can configure on the Alerts and IOC Matches tabs of the Alerts & IOCs page.
Specify columns to display
Use the Column manager to specify the columns that you want the tab to display.
Configure date and time range
To specify the date and time range for the alerts and IOC matches that you want the Alerts and IOC Matches tabs to display, do the following:
- Click the Calendar icon. The Set Date and Time Range dialog opens. You can specify the date and time range using the pre-set time ranges on the Range tab or choose a specific time of event occurrence on the Event Time tab.
To specify the date and time range using pre-set options, click the Range tab and select one of the following options:
- Today
- Last Hour
- Last 12 Hours
- Last Day
- Last Week
- Last 2 Weeks
- Last Month
- Last 2 Months
- Custom: select the start and end date on the calendar, and then click the Start time and End time fields to select the time.
To specify the date and time range based on events, click the Event Time tab, select the date on the calendar, and then select one of the following options:
- Exact Time: click the Event Time field and select the specific time the events occurred.
- +/- 1 Minute
- +/- 3 Minutes
- +/- 5 Minutes
- +/- 10 Minutes
- +/- 15 Minutes
- +/- 1 Hour
- +/- 2 Hours
- +/- 6 Hours
- +/- 12 Hours
- +/- 1 Day
- +/- 3 Days
- +/- 1 Week
Sort alerts and IOC matches
You can sort the alerts and IOC matches that are displayed in ascending or descending order. Click the column headings to sort the list.
View alerts
The Alerts tab displays a list of the alerts that have been detected in your enterprise within the specified date and time range. You can use this tab to view, at a glance, information about the alerts such as severity, priority, risk score, and verdict. Color-coded icons and symbols help you to quickly identify alerts that need your immediate attention.
View additional information
To view additional information about an alert:
- Expand the alert row to view the event timestamp, type, and summary.
- Click the alert Name in the list to pivot to the Alert view and view additional information about the alert and its status.
Refresh the Alerts table
Use the refresh time menu in the header of the Alerts table to select how often the Alerts table should be refreshed. The following options are available:
- Refresh now
- No auto refresh (default)
- Refresh every 5 minutes
- Refresh every 15 minutes
- Refresh every hour
Alerts generated by composite detections
Alerts can be generated by composite detections, which use composite rules that consume outputs (detections) from other rules combined with events, metrics, or entity risk signals. These rules detect complex, multistage threats that individual rules can miss.
Composite detections can help analyze events through defined rule interactions and triggers. This improves accuracy, reduces false positives, and provides a comprehensive view of security threats by correlating data from different sources and attack stages.
The Alerts tab displays the source of the alert in the Inputs column. When the alert is from composite detections, the column displays Detection.
To view the composite detections that triggered the alert, do one of the following on the Alerts tab:
- Expand the alert row and view the composite detections in the Detections table.
- Click the Rule name to open the Detections page.
- Click the alert Name to open the Alert details tab.
Filter alerts
You can narrow down the list of alerts that are displayed using filters.
Perform the following steps to add filters for the list of alerts:
- Click the Filter icon or Add filter in the upper-left corner of the tab to open the Add filter dialog.
Specify the following information:
- Field: enter the object you want to filter or start typing it in the field and select it from the list.
- Operator: enter = (Show only) or != (Filter out) to indicate how the value should be treated.
- Value: select the check boxes for the fields you want to match or filter out. The list that is displayed is based on the Field value.
Click Apply. The filter is displayed as a chip on the filter bar above the Alerts table. You can add multiple filters, as needed.
To clear a filter, click the x on the filter chip to remove it.
View IOC matches
The IOC Matches tab displays the IOCs that have been detected in your network and matched against a list of known suspicious IOCs in intelligent threat feeds. You can view information about the IOCs, such as type, priority, status, categories, assets, campaigns, sources, IOC ingest time, first seen, and last seen. The color-coded icons and symbols help you to quickly identify which IOCs need your attention.
How Google SecOps automatically matches IOCs
Google SecOps automatically correlates your ingested security data against known threat indicators from various threat intelligence feeds. When security data is ingested, it is first normalized into the Unified Data Model (UDM). The IOC matching engine continuously compares these normalized UDM events against threat indicators from all configured feeds. When a match is found, Google SecOps generates an IOC match alert. This automated matching process is particularly effective for domains and IPv4 addresses.
The following diagram illustrates the end-to-end process:
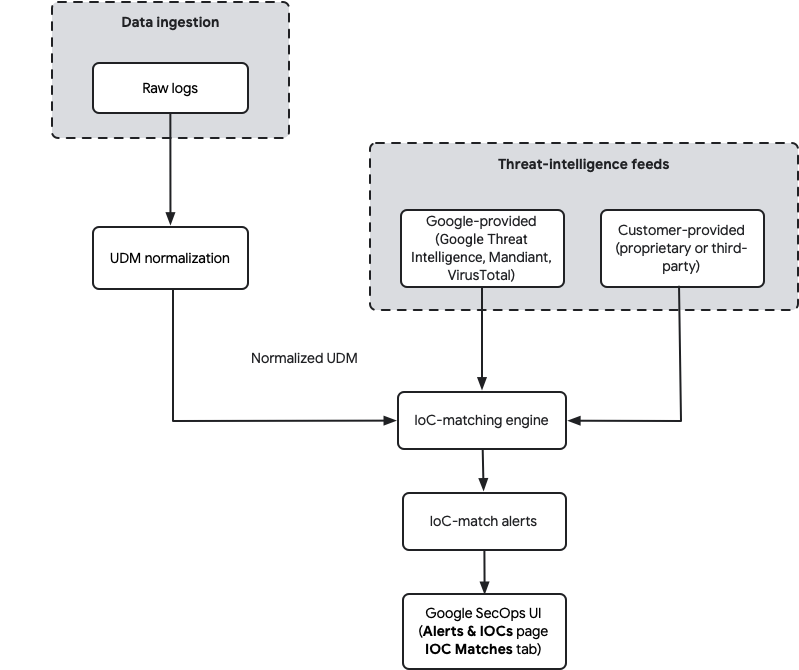
For more information about ingesting data, see Google SecOps data ingestion.
IOC versions
Google SecOps retains all ingested IOC versions and uses the most recently ingested version that is active until a given end date. If you ingest an IOC with no end date, it remains active indefinitely. If you later ingest the same IOC with a specific time range (start and end dates), it overrides the indefinite version during its active period, which includes a five-day lookback before its start date.
After this time-limited IOC expires, Google SecOps automatically reverts to using the previous IOC version if it's still active (for example, the indefinite active version). Ingesting a time-limited IOC doesn't delete or permanently expire a previously ingested indefinite IOC.
After the data is ingested, the UDM event data is continuously analyzed to find IOCs that match known malicious domains, IP addresses, file hashes, and URLs. When a match is found, the IOC is displayed on the IOC Matches tab.
Threat intelligence sources
Google SecOps uses multiple sources for IOC matching:
- Google-provided intelligence: Google SecOps includes integrated threat intelligence from Google's Mandiant, VirusTotal, and Google Threat Intelligence. These feeds are automatically available and provide a wide range of indicators from global threat analysis. Customers with the Enterprise Plus package also gain access to more advanced feeds like Mandiant Breach Analytics.
- Customer-provided feeds: you can ingest your own proprietary or third-party threat intelligence feeds into Google SecOps. These feeds, such as
MISP_IOC, are normalized and included in the same IOC matching process, enabling you to correlate your security data with indicators that are relevant to your organization.
The following threat-intelligence sources are available in Google SecOps out-of-box:
| Google SecOps Enterprise package | Google SecOps Enterprise Plus package |
|---|---|
| Enriched open-source intelligence (OSINT) | Enriched open-source intelligence (OSINT) |
| Mandiant Fusion | |
| VirusTotal |
Real-time and retroactive matching
Google SecOps performs IOC matching in two ways:
- Real-time matching: when new security telemetry is ingested and normalized, it is immediately checked against all available IOC feeds. Any matches trigger alerts in near real time.
- Retroactive matching: when new IOCs are added to any integrated threat intelligence feed (either Google-provided or customer-provided), Google SecOps automatically scans your historical data (up to your full data retention period, typically one year) for any past occurrences of these new indicators. This ensures that historical activities are analyzed for potential compromise, even if the indicator was not known at the time of ingestion.
UDM fields used for matching
The automated IOC matching engine primarily focuses on matching against domain names and IP addresses found in UDM events. The following table details which specific UDM fields are used for automatic IOC matching based on your package:
| Enterprise package | Enterprise Plus package |
|---|---|
about.file |
|
network.dns.answers |
|
network.dns.questions |
network.dns.questions |
principal.administrative_domain |
|
principal.asset |
|
principal.ip |
|
principal.process.file |
principal.process.file |
principal.process.parent_process.file |
principal.process.parent_process.file |
security_result.about.file |
security_result.about.file |
src.file |
src.file |
src.ip |
|
target.asset.ip |
|
target.domain.name |
|
target.file |
target.file |
target.hostname |
target.hostname |
target.ip |
target.ip |
target.process.file |
target.process.file |
target.process.parent_process.file |
Understanding which UDM fields are used helps ensure your data parsers correctly map raw log fields to the appropriate UDM fields for effective IOC matching.
If you have a Google SecOps Enterprise Plus package and the Applied Threat Intelligence (ATI) feature is enabled, IOCs are analyzed and prioritized based on GTI Score. For more information, see Applied Threat Intelligence priority overview.
Advanced IOC matching techniques
Beyond the automated IOC matching visible in the IOC Matches tab, Google SecOps offers several powerful methods for more granular or custom IOC correlation.
Using entity graphs and YARA-L rules
An entity graph lets you ingest various types of contextual entities—including those representing IOCs—and join them with event data using YARA-L detection rules. This enables multi-dimensional IOC matching.
Common entity types used for IOC matching in an entity graph include: IP_ADDRESS, DOMAIN_NAME, FILE (for hashes), and URL.
An entity graph can use two contexts:
- Google-provided context (
GLOBAL_CONTEXT): Google SecOps pre-populates the entity graph with feeds like GCTI, Safe Browsing, and VirusTotal, which are labeled withsource_type = "GLOBAL_CONTEXT". - Customer-provided context (
ENTITY_CONTEXT): you can ingest your own IOC feeds (for example, from Anomali, Recorded Future, STIX) or use the Ingestion API to add custom IOCs. These are generally labeled withsource_type = "ENTITY_CONTEXT".
Important consideration for Entity Graph validity: by default, an entity graph entry is only valid for approximately +/- 5 days from its ingestion timestamp. This means that for continuous matching, context data must be re-ingested at least every five days. However, if the entity includes a metadata.threat field, this +/- 5-day expiration no longer applies, making it suitable for historical IOC matching.
Example YARA-L rule using GLOBAL_CONTEXT:
rule google_safebrowsing_process_launch {
  meta:
    author      = "noam@"
    description = "Detects Process Launch events against Critical or High severity Google's SafeBrowsing database."

  events:
    $e.metadata.event_type = "PROCESS_LAUNCH"
    $e.target.process.file.sha256 = $hash

    $g.graph.metadata.entity_type = "FILE"
    $g.graph.entity.file.sha256 = $hash
    $g.graph.metadata.source_type = "GLOBAL_CONTEXT"
    $g.graph.metadata.threat.severity = "CRITICAL" or
    $g.graph.metadata.threat.severity = "HIGH"

  match:
    $hash over 10m

  condition:
    $e and $g
}
IOC matching with reference lists and YARA-L rules
You can use reference lists within YARA-L rules to match against lists of IOCs. Supported list types include String, regular expression, and CIDR. String lists are highly versatile for IOCs.
Key points about reference lists:
- Maximum list size is 6 MB.
- Maximum line length is 512 characters.
- A rule can use up to seven (7)
instatements, with at most two (2) usingregexorcidr. - The
nocaseoperator does not work with reference lists.
Reference lists are useful for historical retro hunting. Although reference lists can't be deleted, their content can be updated or cleared.
Example YARA-L rule matching IPs from a String reference list:
rule ioc_ip4_matches {
  meta:
    description = "IOC IPv4 matching using reference lists"
  events:
    $ioc.metadata.event_type = "NETWORK_CONNECTION"
    $ioc.target.ip = $dip
    // checks if the IP address is in the reference list named "string_demo_list"
    $dip in %string_demo_list

  condition:
    $ioc
}
For multi-dimensional matching (for example, IP address + port), you can format your String reference list as a CSV and use strings.concat in YARA-L, for example:
rule ioc_ip4_and_port_matches {
  meta:
    description = "Matches on IP address and port using a CSV-formatted reference list"
  events:
    $ioc.metadata.event_type = "NETWORK_CONNECTION"
    $ioc.target.ip = $dip
    $ioc.target.port = $dport
    $artifact = strings.concat($ioc.target.ip, strings.concat(",", $ioc.target.port))

    $artifact in %string_demo_list_1

  outcome:
    $debug = $artifact
  condition:
    $ioc
}
BigQuery for historical IOC analysis
The datalake.ioc_matches table in Google SecOps's data lake (BigQuery) provides a powerful way to query historical IOC match data. While the Google SecOps IOC Matches tab focuses on domains, you can use BigQuery to analyze IP-address matches and more.
Example SQL to query for specific IP-address IOC matches:
-- Add your IP IOC Matches here
DECLARE __IP_IOCS__ ARRAY <STRING>;
SET __IP_IOCS__ = ['40.79.150.120'];
------
SELECT
  MIN(DATE(TIMESTAMP_SECONDS(CAST(day_bucket_seconds AS INT64)), 'UTC')) AS first_observed,
  MAX(DATE(TIMESTAMP_SECONDS(CAST(day_bucket_seconds AS INT64)), 'UTC')) AS last_observed,
  COUNT(4) AS hits,
  ioc_value,
  feed_log_type,
  is_global,
  CONCAT(COALESCE(asset.namespace, "untagged"),":",COALESCE(asset.hostname, asset.asset_ip_address, asset.mac, "-")) AS asset
FROM
  `datalake.ioc_matches`
WHERE
  ioc_value IN UNNEST(__IP_IOCS__)
  AND ioc_type = "IOC_TYPE_IP"
GROUP BY
  4,
  5,
  6,
  7
Here are the truncated results:
| Row | first_observed | last_observed | hits | ioc_value | feed_log_type | is_global | asset | |
|---|---|---|---|---|---|---|---|---|
| 1 | 2025-02-23 | 2025-03-05 | 64 | 40.79.150.120 | CATCH_ALL | false | untagged:192.168.12.16 | |
| 2 | 2025-02-27 | 2025-03-05 | 29 | 40.79.150.120 | CATCH_ALL | false | untagged:192.168.12.129 | |
You can also query the datalake.events table for multi-dimensional IOC matching by constructing a concatenated string, for example:
DECLARE
  __IOC_MULTIPLE_ATTRIBUTES__ ARRAY <STRING>;
SET
  __IOC_MULTIPLE_ATTRIBUTES__ = ['1.2.3.4,80', '1.2.3.4,443'];
SELECT
  MIN(TIMESTAMP_SECONDS(metadata.event_timestamp.seconds)) AS first_seen,
  MAX(TIMESTAMP_SECONDS(metadata.event_timestamp.seconds)) AS last_seen,
  target_ip,
  target.port
FROM
  `datalake.events`,
  UNNEST(target.ip) target_ip
WHERE
  DATE(hour_time_bucket) BETWEEN DATE_SUB(CURRENT_DATE, INTERVAL 60 DAY)
  AND DATE_SUB(CURRENT_DATE, INTERVAL 1 DAY)
  AND target_ip != ""
  AND target.port > 0
  AND CONCAT(target_ip,",",CAST(target.port AS STRING)) IN UNNEST(__IOC_MULTIPLE_ATTRIBUTES__)
GROUP BY 3,4
UDM Search and Search API
- UDM Search: supports using reference lists for single-dimension searches (for example, a list of hashes). However, it doesn't support complex OR logic across multiple distinct groups (for example,
(IP1 AND Port1) OR (IP2 AND Port2)). The UDM Search API also has a default quota of 1 QPS, limiting its use for large-scale IOC matching. - Search API: the older Search API can be effective for IOC matching on hashes, IP addresses, and domain names, returning matching assets.
Filter IOC matches
You can use filters to narrow down the list of IOCs that are displayed in the IOCs table.
Perform the following steps to add filters for the list of IOCs:
- Click the Filter icon in the upper-left corner of the IOCs table to open the Filters dialog.
Configure the following:
- Logical Operator: select OR to match any of the combined conditions (disjunction) or AND to match all of the combined conditions (conjunction).
- Column: select the column to filter by.
- Show Only or Filter Out: in the middle column, select Show Only or Filter Out to specify how the value should be treated.
- Value: select the check boxes for the values to show or filter out based on the Column value.
Click Apply. The filter is displayed as a chip on the filter bar above the IOCs table. You can add multiple filters, as needed.
To clear a filter, click the x on the filter chip to remove it or Clear All.
Example of filtering for critical IOCs
If you're looking for IOCs that have been identified as critically severe, select Severity in the left column, Show only in the middle column, and Critical in the right column.
Example of filtering for Applied Threat Intelligence IOCs
If you want to view only Applied Threat Intelligence IOCs, select Sources in the left column, Show only in the middle column, and Mandiant in the right column.
You can also filter IOCs using the Filters flyout panel on the left side of the tab. Expand the column name, find the value, and click the More icon to select Show only or Filter out.
View and manage IOC-match details
To view the details about an incident, such as priority, type, source, IC-Score, and category, click the IOC to open the IOC details page. On this page, you can do the following:
- View event prioritization
- View associations
View event prioritization
Use the Events tab to view how the events where the IOC was seen is prioritized.
Click the event to open the Event viewer, which displays the priority and rationale and event details.
View associations
Use the Associations tab to view associations for any actor or malware to help investigate breaches and prioritize alerts.
SOAR alerts
For Google SecOps unified customers, SOAR alerts are shown on this page, and include a case ID. Click the case ID to open the Cases page. On the Cases page, you can get information on both the alert and its associated case and take response actions. For more information, see Cases Overview.
To manage alert status or close an alert, do the following:
- Go to the Cases page.
- In the Case details section > alert overview, click Go to case to access the case.
Need more help? Get answers from Community members and Google SecOps professionals.