


개요
이 가이드에서는 Google Distributed Cloud(GDC) 에어 갭 공유 클러스터에 Elastic Stack (Elasticsearch 및 Kibana)을 엔드 투 엔드로 배포하는 방법을 간략히 설명하고 이를 대규모 언어 모델 (LLM) 서비스와 통합하여 Elastic의 생성형 AI 기능을 평가하는 방법을 보여줍니다.
배포에서는 GDC 오프라인 Marketplace에서 제공되는 공식 Kubernetes 기반 Elastic Cloud (ECK) 연산자를 사용합니다. 이 연산자는 공유 Kubernetes 클러스터의 프로젝트 네임스페이스에 설치되며 Elasticsearch 및 Kibana 리소스의 프로비저닝 및 수명 주기 관리를 자동화합니다. 배포되면 Kibana는 LLM 추론 엔드포인트 (예: GDC의 관리형 Gemini 또는 Ollama 또는 vLLM과 같은 자체 관리형 OpenAI 호환 서비스)에 연결됩니다. 이 통합은 Elastic AI Agent, Agent Builder로 빌드된 커스텀 에이전트, Attack Discovery를 포함한 Elastic의 생성형 AI 기능을 지원합니다.
이 가이드는 Elastic v9.4.0, Elastic Kubernetes Operator v3.4.0, GDC v1.16.2를 기준으로 작성되었습니다. 다른 버전을 사용하는 경우 일부 안내가 약간 다를 수 있습니다.
아키텍처
아키텍처는 GDC 공유 사용자 클러스터의 프로젝트 네임스페이스 내에서 ECK 오퍼레이터가 관리하는 Elastic Stack 배포로 구성됩니다. Kibana는 내부 GDC 네트워크를 통해 LLM 추론 엔드포인트와 통신합니다.
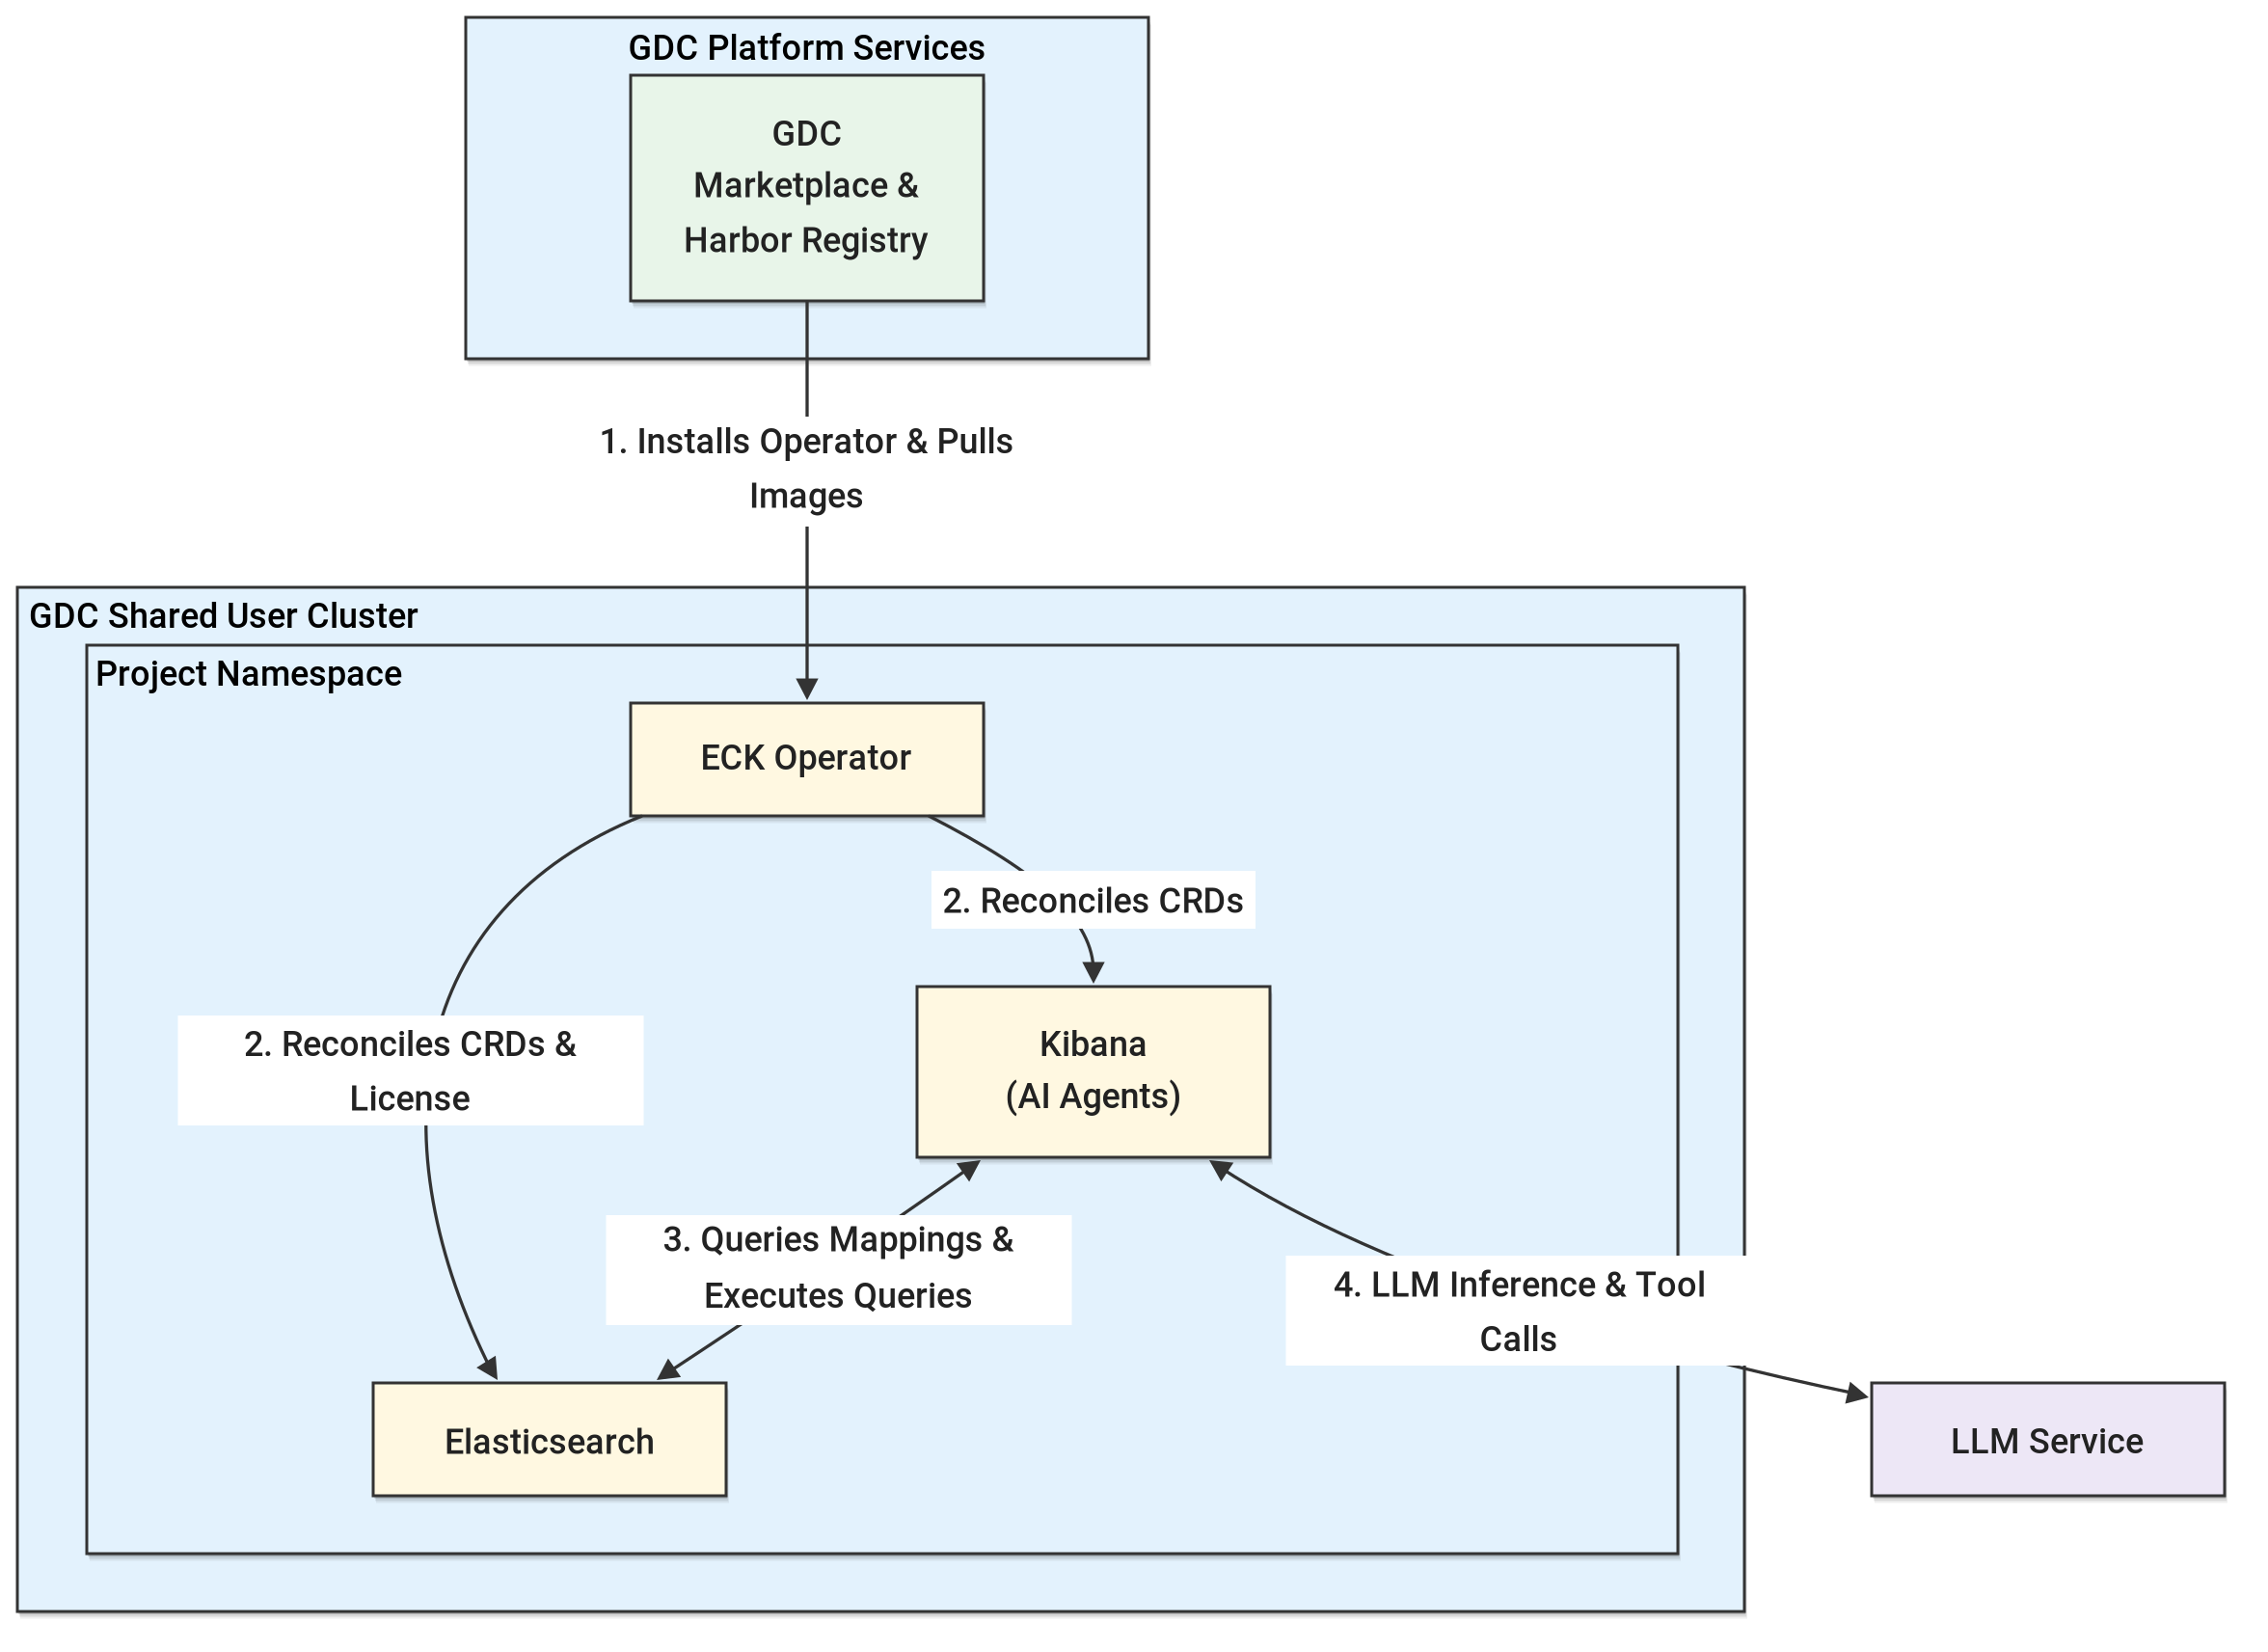
이 아키텍처의 주요 구성요소는 다음과 같습니다.
- GDC 공유 클러스터: 여러 프로젝트에 연결되고 GDC Marketplace 소프트웨어 패키지 및 애플리케이션 워크로드를 호스팅하는 조직 범위의 공유 Kubernetes 클러스터입니다.
- GDC 프로젝트: ECK 연산자, Elasticsearch 클러스터, Kibana 인스턴스, 연결된 Kubernetes 보안 비밀 및 NetworkPolicies를 격리하는 공유 클러스터의 프로젝트 네임스페이스입니다.
- Elastic Cloud on Kubernetes (ECK) 연산자: GDC Marketplace에서 프로젝트 네임스페이스에 설치된 연산자는
Elasticsearch및Kibana커스텀 리소스를 관리하고 생성형 AI 기능 및 외부 LLM 커넥터에 필요한 Elastic 라이선스를 조정합니다. - Elasticsearch: 운영 및 보안 데이터를 저장하고 색인을 생성하며 Kibana의 AI 기능 및 에이전트에서 생성된 검색 및 ES|QL 쿼리를 실행합니다.
- Kibana: Elastic AI 에이전트 (자연어 로그 조사 및 ES|QL 생성용), 에이전트 빌더 (Elasticsearch 데이터에 대한 커스텀 대화형 에이전트 및 도구 빌드용), 공격 검색 (보안 알림 상관관계 및 공격 체인 분석용)을 포함한 Elastic의 생성형 AI 기능을 호스팅합니다. Kibana는 사용자, Elasticsearch, LLM 서비스 간의 다단계 도구 호출을 조정하는 LLM 작업 커넥터도 관리합니다.
- LLM 서비스: 내부 GDC 네트워크를 통해 Kibana에 채팅 완료 및 도구 호출 기능을 제공하는 관리형 LLM 서비스 (예: GDC의 Gemini) 또는 자체 관리형 추론 서버 (예: Ollama 또는 vLLM)입니다.
시작하기 전에
배포를 시작하기 전에 GDC 환경이 다음 기본 요건과 가정을 충족하는지 확인하세요.
- 공유 Kubernetes 클러스터 및 GDC 프로젝트: 기존 GDC 공유 클러스터 및 해당 클러스터에 연결된 GDC 프로젝트에 액세스할 수 있습니다. 프로젝트는 이 가이드에 배포된 모든 Kubernetes 리소스의 네임스페이스 컨테이너 역할을 합니다. 클러스터에 ECK 연산자, Elasticsearch, Kibana 워크로드를 호스팅할 수 있는 충분한 컴퓨팅 및 영구 스토리지 리소스가 있는지 확인합니다.
- LLM 서비스: 관리형 Gemini 서비스 (GDC 환경에서 사용 가능한 경우) 또는 자체 관리형 OpenAI 호환 LLM 서비스 (예: GPU 프로젝트에서 Ollama 또는 vLLM을 통해 제공되는
gemma4:31b) 중 하나에 대한 네트워크 액세스 권한이 있습니다. LLM 인프라 자체를 배포하는 것은 이 가이드의 범위를 벗어나지만 특정 모델 및 API 요구사항은 LLM 서비스 요구사항에 자세히 설명되어 있습니다. GDC 환경과 함께 제공되는 Elastic 버전을 가져옵니다.
export ELASTIC_VERSION=$(curl -sk "https://harbor.${ORG}.${ZONE}.${GDCH_DOMAIN}/api/v2.0/projects/library/repositories/elasticsearch%252Felasticsearch/artifacts" | jq -r '[.[].tags[]?.name] | sort_by(split(".") | map(tonumber)) | last')이 가이드 전체에서 참조할 환경 변수를 구성합니다. 특정 환경에 맞게 필요에 따라 다음 값을 수정합니다.
# GDC environment configuration export PROJECT_ID="your-project-id" export CLUSTER_NAME="your-shared-cluster-name" export ZONE="your-zone-name" export USER_NAME="your-gdc-user-email" # Marketplace package and Elastic Stack configuration export MARKETPLACE_SERVICE_NAME="elastic" # LLM service configuration export LLM_CONNECTOR_NAME="your-llm-connector-name" export LLM_API_URL="http://your-llm-service-host:11434/v1/chat/completions" export LLM_MODEL_NAME="your-llm-model-name" export LLM_API_KEY="your-llm-api-key"gdcloud을 구성합니다.gdcloud config set project ${PROJECT_ID} gdcloud config set core/zone ${ZONE}대상 GDC 프로젝트 (
${PROJECT_ID})에서 사용자에 대해 필요한 프로젝트 수준 IAM 역할을 요청하거나 바인딩합니다. GDC Marketplace 수명 주기 문서 및 GDC 네트워킹 요구사항에 따라 최소한 다음 프로젝트 역할이 필요합니다.- 네임스페이스 관리자 (
namespace-admin): 공유 클러스터의 프로젝트 네임스페이스 내에서 Kubernetes 워크로드, 보안 비밀, 서비스, 맞춤 리소스를 만들고 관리할 수 있는 전체 관리 액세스 권한입니다. - 프로젝트 뷰어 (
project-viewer): GDC 콘솔 및 CLI에서 기존 프로젝트와 해당 리소스를 볼 수 있는 읽기 액세스 권한입니다. - Marketplace 편집자 (
marketplace-editor): 프로젝트에서 GDC Marketplace 소프트웨어 패키지를 설치, 업그레이드, 제거할 수 있는 권한입니다. - 프로젝트 NetworkPolicy 관리자 (
project-networkpolicy-admin): 프로젝트 간 및 외부 트래픽이 Kibana 및 Elasticsearch LoadBalancer 서비스에 도달하도록 허용하는 전역ProjectNetworkPolicy규칙을 구성할 수 있는 권한입니다.
조직 IAM 관리자 또는 프로젝트 IAM 관리자에게 이러한 역할을 부여해 달라고 요청하세요. IAM 관리자 권한이 있는 경우 다음 명령어를 실행하세요.
gdcloud projects add-iam-policy-binding ${PROJECT_ID} \ --member="user:${USER_NAME}" \ --role=namespace-admin gdcloud projects add-iam-policy-binding ${PROJECT_ID} \ --member="user:${USER_NAME}" \ --role=project-viewer gdcloud projects add-iam-policy-binding ${PROJECT_ID} \ --member="user:${USER_NAME}" \ --role=marketplace-editor gdcloud projects add-iam-policy-binding ${PROJECT_ID} \ --member="user:${USER_NAME}" \ --role=project-networkpolicy-admin- 네임스페이스 관리자 (
공유 클러스터의 kubeconfig를 가져오고
kubectl의ku셸 별칭을 구성합니다.KUBECONFIG=kubeconfig-${CLUSTER_NAME}.yaml gdcloud clusters \ get-credentials ${CLUSTER_NAME} \ --zone ${ZONE} alias ku="kubectl --kubeconfig=kubeconfig-${CLUSTER_NAME}.yaml"
Elastic 마켓플레이스 패키지 설치
이 섹션에서는 GDC 마켓플레이스 수명 주기 가이드에 따라 GDC 에어 갭 마켓플레이스에서 프로젝트 네임스페이스에 Kubernetes 기반 Elastic Cloud (ECK) 연산자를 설치합니다.
gdcloud CLI (또는 GDC 콘솔)를 통해 설치
사용 가능한 Marketplace 소프트웨어 패키지를 나열하여 서비스 이름과 사용 가능한 버전을 확인합니다.
gdcloud marketplace services list출력은 다음과 비슷하게 표시됩니다.
SERVICE      LATEST VERSION
confluent    <CONFLUENT_VERSION>
dataproc     <DATAPROC_VERSION>
elastic      <ECK_OPERATOR_VERSION>
mariadb      <MARIADB_VERSION>
mattermost   <MATTERMOST_VERSION>
mongodb      <MONGODB_VERSION>
neo4j        <NEO4J_VERSION>
redis        <REDIS_VERSION>
starboard    <STARBOARD_VERSION>
starburst    <STARBURST_VERSION>
tes          <TES_VERSION>
vault        <VAULT_VERSION>
대상 공유 클러스터에 Elastic Marketplace 패키지를 설치합니다.
gdcloud marketplace services install ${MARKETPLACE_SERVICE_NAME} \
  --cluster=${CLUSTER_NAME} \
  --zone=${ZONE} \
  --project ${PROJECT_ID}
*(또는 GDC 콘솔에서 프로젝트
${PROJECT_ID}를 선택하고 마켓플레이스로 이동한 후 Elastic Cloud on Kubernetes 목록을 선택하고 설치를 클릭하고 클러스터${CLUSTER_NAME}를 선택한 후 설치를 클릭합니다.)*elastic-operatorStatefulSet과 포드가 프로젝트 네임스페이스 (${PROJECT_ID})에서 실행되고 있는지 확인합니다.ku get statefulset,pods -n ${PROJECT_ID}출력은 다음과 비슷하게 표시됩니다.
NAME                                READY   AGE
statefulset.apps/elastic-operator   1/1     3m

NAME                   READY   STATUS    RESTARTS   AGE
pod/elastic-operator-0 1/1     Running   0          3m
Elastic Stack 배포
Elastic Stack 매니페스트 만들기
GDC 마켓플레이스 패키지는 로컬 에어 갭 적용 Harbor 레지스트리에서 Elasticsearch 및 Kibana 컨테이너 이미지를 가져오도록 사전 구성된 ECK 오퍼레이터를 배포합니다.
프로젝트 네임스페이스 (${PROJECT_ID})에 1노드 Elasticsearch 클러스터, Kibana UI 인스턴스, LoadBalancer HTTP 서비스, allow-all NetworkPolicy를 배포하는 elastic-stack.yaml를 만듭니다. 매니페스트에는 아직 자체 엔터프라이즈 라이선스가 없는 경우를 대비하여 여기에서 30일 엔터프라이즈 평가판 (eck-trial-license)으로 구성된 ECK 운영자가 조정하는 라이선스 Secret도 포함됩니다.
cat <<EOF > elastic-stack.yaml
apiVersion: v1
kind: Secret
metadata:
  name: eck-trial-license
  namespace: ${PROJECT_ID}
  labels:
    license.k8s.elastic.co/type: enterprise_trial
  annotations:
    elastic.co/eula: accepted
---
apiVersion: elasticsearch.k8s.elastic.co/v1
kind: Elasticsearch
metadata:
  name: elastic-cluster
  namespace: ${PROJECT_ID}
spec:
  version: ${ELASTIC_VERSION}
  http:
    service:
      spec:
        type: LoadBalancer
  nodeSets:
    - name: default
      count: 1
      config:
        # Disable mmap to avoid requiring privileged host sysctl modifications
        node.store.allow_mmap: false
      podTemplate:
        spec:
          initContainers:
            - name: sysctl
              securityContext:
                privileged: false
                allowPrivilegeEscalation: false
                runAsNonRoot: true
                capabilities:
                  drop:
                    - ALL
              command: ["sh", "-c", "true"]
          containers:
            - name: elasticsearch
              resources:
                requests:
                  memory: 2Gi
                  cpu: 500m
                limits:
                  memory: 4Gi
                  cpu: 2
      volumeClaimTemplates:
        - metadata:
            name: elasticsearch-data
          spec:
            accessModes:
              - ReadWriteOnce
            resources:
              requests:
                storage: 10Gi
---
apiVersion: kibana.k8s.elastic.co/v1
kind: Kibana
metadata:
  name: kibana-ui
  namespace: ${PROJECT_ID}
spec:
  version: ${ELASTIC_VERSION}
  count: 1
  elasticsearchRef:
    name: elastic-cluster
  http:
    service:
      spec:
        type: LoadBalancer
  podTemplate:
    spec:
      containers:
        - name: kibana
          resources:
            requests:
              memory: 1Gi
              cpu: 200m
            limits:
              memory: 2Gi
              cpu: 1
---
apiVersion: networking.k8s.io/v1
kind: NetworkPolicy
metadata:
  name: allow-all
  namespace: ${PROJECT_ID}
spec:
  podSelector: {}
  policyTypes:
    - Ingress
  ingress:
    - from:
        - ipBlock:
            cidr: 0.0.0.0/0
EOF
배포 적용 및 확인
매니페스트를 적용합니다.
ku apply -f elastic-stack.yaml
GDC 방화벽 규칙이 LoadBalancer IP로의 인바운드 트래픽과 프로젝트 간 트래픽 (예: LLM 서비스와의 통신)을 허용하도록 전역 ProjectNetworkPolicy를 적용합니다.
kubectl --kubeconfig=kubeconfig-global.yaml apply -f - <<EOF
apiVersion: networking.global.gdc.goog/v1
kind: ProjectNetworkPolicy
metadata:
  namespace: ${PROJECT_ID}
  name: allow-inbound-traffic-from-external
spec:
  policyType: Ingress
  subject:
    subjectType: UserWorkload
  ingress:
    - from:
        - ipBlock:
            cidr: 0.0.0.0/0
---
apiVersion: networking.global.gdc.goog/v1
kind: ProjectNetworkPolicy
metadata:
  namespace: ${PROJECT_ID}
  name: allow-inbound-traffic-from-all-projects
spec:
  policyType: Ingress
  subject:
    subjectType: UserWorkload
  ingress:
    - from:
        - projects: {}
EOF
Elasticsearch와 Kibana가 모두 Running 및 Ready 상태에 도달하고 ${CLUSTER_NAME}에서 LoadBalancer IP를 가져올 때까지 포드, 서비스, 커스텀 리소스를 모니터링합니다.
ku get pods,svc,elasticsearch,kibana -n ${PROJECT_ID}
리소스가 준비되면 다음과 유사한 결과가 출력됩니다.
NAME                                READY   STATUS    RESTARTS   AGE
pod/elastic-cluster-es-default-0    1/1     Running   0          3m
pod/elastic-operator-0              1/1     Running   0          15m
pod/kibana-ui-kb-869844478d-59ptw   1/1     Running   0          3m

NAME                                                                      TYPE           CLUSTER-IP      EXTERNAL-IP    PORT(S)          AGE
service/elastic-cluster-es-default                                        ClusterIP      None            <none>         9200/TCP         11m
service/elastic-cluster-es-http                                           LoadBalancer   10.101.18.181   <ELASTIC_EXTERNAL_IP>   9200:32159/TCP   11m
service/elastic-cluster-es-internal-http                                  ClusterIP      10.101.18.81    <none>         9200/TCP         11m
service/elastic-cluster-es-transport                                      ClusterIP      None            <none>         9300/TCP         11m
service/g-svc-g-fre-elastic-cluster-es-http-shared-clus-extern-56d5eb67   ClusterIP      None            <none>         9200/TCP         11m
service/g-svc-g-fre-kibana-ui-kb-http-shared-cluster-0b-extern-75a78b1f   ClusterIP      None            <none>         5601/TCP         11m
service/kibana-ui-kb-http                                                 LoadBalancer   10.101.19.86    <KIBANA_EXTERNAL_IP>   5601:32735/TCP   11m

NAME                                                         HEALTH   NODES   VERSION             PHASE   AGE
elasticsearch.elasticsearch.k8s.elastic.co/elastic-cluster   green    1       <ELASTIC_VERSION>   Ready   3m

NAME                                     HEALTH   NODES   VERSION             AGE
kibana.kibana.k8s.elastic.co/kibana-ui   green    1       <ELASTIC_VERSION>   3m
이후 단계에서 사용할 수 있도록 Elasticsearch 및 Kibana에 할당된 외부 LoadBalancer IP를 내보냅니다.
export ELASTICSEARCH_IP=$(ku get svc elastic-cluster-es-http \
  -n ${PROJECT_ID} \
  -o jsonpath='{.status.loadBalancer.ingress[0].ip}')

export KIBANA_IP=$(ku get svc kibana-ui-kb-http \
  -n ${PROJECT_ID} \
  -o jsonpath='{.status.loadBalancer.ingress[0].ip}')

echo "Kibana External URL:        https://${KIBANA_IP}:5601"
echo "Elasticsearch External URL: https://${ELASTICSEARCH_IP}:9200"
사용자 인증 정보 검색 및 Kibana UI 액세스
elastic 슈퍼유저 비밀번호 검색
ECK는 기본 elastic 수퍼유저 비밀번호가 포함된 Kubernetes 보안 비밀(elastic-cluster-es-elastic-user)을 자동으로 생성합니다. 다음을 사용하여 검색하고 디코딩합니다.
export ELASTIC_PASSWORD=$(ku get secret elastic-cluster-es-elastic-user \
  -n ${PROJECT_ID} \
  -o jsonpath='{.data.elastic}' | base64 -d)
echo "${ELASTIC_PASSWORD}"
연결 확인 및 로그인
워크스테이션에서 HTTPS를 통해 Elasticsearch에 연결할 수 있는지 확인합니다.
curl -sk -u "elastic:${ELASTIC_PASSWORD}" "https://${ELASTICSEARCH_IP}:9200"브라우저에서
https://${KIBANA_IP}:5601을 열고 자체 서명 인증서 경고를 수락한 후 다음을 사용하여 로그인합니다.- 사용자 이름:
elastic - 비밀번호:
<output from ELASTIC_PASSWORD above>
- 사용자 이름:
Elastic 라이선스 확인
Elastic의 생성형 AI 기능 (Elastic AI 에이전트, Agent Builder, Attack Discovery 포함) 및 외부 LLM 커넥터에는 엔터프라이즈 라이선스(또는 활성 30일 엔터프라이즈 체험판 라이선스)가 필요합니다.
Elasticsearch 클러스터가 ECK 연산자에 의해 관리되는 경우 ECK의 license-controller는 연산자 네임스페이스 (${PROJECT_ID})의 Kubernetes 보안 비밀과 클러스터 라이선스를 지속적으로 조정합니다. 아직 프로덕션 Enterprise 라이선스가 없는 경우 elastic-stack.yaml (license.k8s.elastic.co/type:
enterprise_trial)에 포함된 eck-trial-license 보안 비밀은 ECK에 30일 Enterprise 체험판 라이선스를 자동으로 프로비저닝하고 유지보수하도록 지시합니다. (ECK 라이선스 보안 비밀 없이 POST
/_license/start_trial를 통해 수동으로 무료 체험판을 시작하면 ECK가 다음 조정 주기에 클러스터를 basic로 되돌립니다.)
CLI를 통해 활성 라이선스를 확인하려면 다음 안내를 따르세요.
curl -sk -u "elastic:${ELASTIC_PASSWORD}" \
  "https://${ELASTICSEARCH_IP}:9200/_license" | jq .
*(또는 Kibana에서 탐색 메뉴를 열고 관리 > 개발 도구로 이동한 다음 콘솔 탭에서 GET /_license를 실행합니다.)*
출력은 다음과 비슷하게 표시되며 "status": "active" 및 "type": "enterprise" (또는 무료 체험판 라이선스를 사용하는 경우 "type": "trial")가 표시됩니다.
{
  "license": {
    "status": "active",
    "uid": "d8c2b566-8c2b-436c-a1ea-5502d6790505",
    "type": "trial",
    "issue_date": "2026-09-17T23:19:25.053Z",
    "issue_date_in_millis": 1789687165053,
    "expiry_date": "2026-10-17T23:19:25.053Z",
    "expiry_date_in_millis": 1792279165053,
    "max_nodes": 1000,
    "max_resource_units": null,
    "issued_to": "elastic-cluster",
    "issuer": "elasticsearch",
    "start_date_in_millis": -1
  }
}
기본 제공 샘플 데이터 세트 로드
커스텀 데이터 수집 파이프라인을 작성하거나 외부 인터넷 액세스를 요구하지 않고 Elastic의 AI 기능을 평가하려면 Kibana의 기본 제공 샘플 웹 로그 데이터 세트 (kibana_sample_data_logs)를 로드하면 됩니다. 샘플 데이터 보관 파일은 Kibana 컨테이너 이미지 내에 번들로 제공되므로 에어 갭 환경에서 몇 초 만에 설치됩니다. 데이터 세트는 클라이언트 IP 주소 (clientip), HTTP 상태 코드 (response), 출발지 및 목적지 국가 (geo.src, geo.dest), 전송된 바이트(bytes), URL, 사용자 에이전트 문자열을 포함하는 14, 074개의 웹 액세스 로그 문서를 채웁니다.
추가 기본 제공 데이터 세트 (flights 및 ecommerce)는 Kibana에 샘플 데이터 추가 및 elastic-datasets-builtin.md를 참조하세요.
데이터 세트 로드
다음 명령어를 실행하여 Kibana의 내부 샘플 데이터 엔드포인트를 통해 kibana_sample_data_logs를 로드합니다.
curl -sk -u "elastic:${ELASTIC_PASSWORD}" \
  -X POST "https://${KIBANA_IP}:5601/api/sample_data/logs" \
  -H "kbn-xsrf: true" \
  -H "x-elastic-internal-origin: Kibana"
샘플 데이터 세트 확인
logs 샘플 데이터 세트가 Kibana에서 installed로 표시되는지 확인하고 지원 데이터 스트림에 Elasticsearch의 14,074 문서가 포함되어 있는지 확인합니다.
curl -sk -u "elastic:${ELASTIC_PASSWORD}" \
  "https://${KIBANA_IP}:5601/api/sample_data" \
  -H "kbn-xsrf: true" \
  -H "x-elastic-internal-origin: Kibana" \
  | jq '.[] | select(.id == "logs") | {id, name, status}'

curl -sk -u "elastic:${ELASTIC_PASSWORD}" \
  "https://${ELASTICSEARCH_IP}:9200/_cat/indices/kibana_sample_data_logs*?v"
출력은 다음과 비슷하게 표시됩니다.
{
  "id": "logs",
  "name": "Sample web logs",
  "status": "installed"
}
health status index                                         uuid                   pri rep docs.count docs.deleted store.size pri.store.size dataset.size
yellow open   .ds-kibana_sample_data_logs-2026.09.22-000001 0YivG3oFQQmb-mYqmULr_g   1   1      14074            0      8.7mb          8.7mb        8.7mb
LLM 서비스 요구사항
GDC 에어 갭 환경에서는 클라우드 호스팅 Elastic 관리 LLM과 외부 공개 SaaS LLM 제공업체에 연결할 수 없습니다. GDC 환경에 따라 다음을 수행합니다.
- GDC의 관리형 Gemini: Gemini를 관리형 LLM 서비스로 제공하는 GDC 환경에서 Kibana를 관리형 Gemini 서비스에 직접 연결할 수 있습니다(제공되는 경우).
- 자체 관리형 LLM 서비스: 또는 GDC 환경 내에서 호스팅되는 자체 관리형 LLM 서비스 (예: GDC GPU 노드)에 Elastic을 연결할 수 있습니다.
자체 관리형 LLM 서비스를 배포하는 것은 이 가이드의 범위를 벗어납니다. Elastic용 자체 관리 LLM 서비스를 프로비저닝하거나 선택할 때는 Elastic의 공식 가이드에서 파생된 요구사항을 충족하는지 확인하세요.
기술 요구사항 요약
다음은 자체 관리형 LLM 서비스가 Elastic의 AI 에이전트, 에이전트 빌더, 공격 탐지와 안정적으로 작동하는 데 필요한 주요 API, 모델 기능, 컨텍스트 윈도우, 런타임 요구사항을 요약한 것입니다. 다음 섹션에 인용된 특정 구성 파라미터 이름 (예: num_ctx, num_predict, repeat_penalty, repeat_last_n, OLLAMA_FLASH_ATTENTION, OLLAMA_NUM_PARALLEL)은 Ollama를 예시로 사용하여 제공됩니다. vLLM과 같은 다른 추론 엔진을 사용하는 경우 동일한 설정을 적용합니다.
- 네이티브 함수 호출이 있는 OpenAI 호환 채팅 자동 완성 API (
/v1/chat/completions):- OpenAI 호환
/v1/chat/completions엔드포인트 ("stream": true를 통한 서버 전송 이벤트 스트리밍 포함)를 노출하는 모든 자체 관리형 추론 서버 (예: Ollama 또는 vLLM)는 제공업체가 기타 (OpenAI 호환 서비스)로 설정된 Kibana의 OpenAI 커넥터를 사용하여 통합할 수 있습니다. - 클라우드 네이티브 도구 호출을 지원하는 모델 (예:
gemma4:31b)을 사용할 때는 Kibana 커넥터에서 네이티브 함수 호출을 사용 설정 ("enableNativeFunctionCalling": true)합니다. 기본적으로("enableNativeFunctionCalling": false) Kibana는 프롬프트 기반 시뮬레이션 함수 호출을 사용하는데, 이는 중첩된 도구 호출 중에 안정성이 떨어지고 파싱 오류 (예:Error: Missing name for tool use)로 인해 실패할 수 있습니다. 네이티브 함수 호출을 사용 설정하면 도구 호출 형식이 추론 서버의 OpenAItools프로토콜에 직접 위임됩니다.
- OpenAI 호환
- 기본 도구 및 함수 호출 기능이 있는 요청 사항에 따라 조정된 모델:
- Elastic AI 에이전트 (
elastic-ai-agent) 및 커스텀 Agent Builder 빌더 에이전트는 멀티스텝 도구 호출 (platform.core.list_indices,platform.core.get_index_mapping,platform.core.search,platform.core.execute_esql,platform.core.cases)을 사용합니다. 이러한 도구를 사용하여 색인 매핑을 검색하고, Elasticsearch에 대해 ES|QL 쿼리를 생성 및 실행하고, 결과를 합성합니다. - 선택한 모델은 명령 조정이 가능하고 유효한 클라우드 네이티브 도구 호출, 구조화된 JSON 출력, ES|QL 쿼리를 생성할 수 있어야 합니다. 모델 평가 기준은 Elastic의 모니터링 가능성을 위한 LLM 성능 매트릭스 및 Elastic Security를 위한 LLM 성능 매트릭스를 참조하세요.
- Elastic AI 에이전트 (
- 최소
128,000토큰의 컨텍스트 윈도우 (예: Ollama의num_ctx: 131072):- Elastic의 일반 자체 관리형 커스텀 LLM 문서에는 최소 64,000개의 토큰이 언급되어 있지만 Elastic AI 에이전트(
elastic-ai-agent)에는 128,000개의 토큰 컨텍스트 윈도우(131,072토큰)를 사용하는 것이 좋습니다. - 다단계 조사 중에 에이전트는 시스템 안내 및 도구 정의를 색인 스키마, ES|QL 문서, 원시 검색 결과와 결합합니다 (예: 집계 전에 필드 값을 검사하기 위해 최대 100개의 샘플 문서 검색). 단일 조사에서 대화 기록이 70,000개 토큰을 초과할 수 있으며, 이로 인해 64,000개 토큰 컨텍스트 윈도우가 대화 중간에 프롬프트를 자르게 됩니다.
- Ollama에서 모델의
Modelfile에 포함된PARAMETER num_ctx지시문은 컨테이너의OLLAMA_CONTEXT_LENGTH환경 변수를 재정의합니다. 모델의Modelfile에서OLLAMA_CONTEXT_LENGTH=131072및PARAMETER num_ctx 131072가 모두 구성되어 있는지 확인합니다 (80GB NVIDIA A100 또는 H100 GPU에서128K컨텍스트의gemma4:31b는 VRAM에 적합함).
- Elastic의 일반 자체 관리형 커스텀 LLM 문서에는 최소 64,000개의 토큰이 언급되어 있지만 Elastic AI 에이전트(
- 출력 토큰 한도 및 완만한 반복 페널티 (예: Ollama의
num_predict: 8192및repeat_penalty: 1.05):- Kibana의 OpenAI 스트림 어댑터는
"finish_reason": "length"를 치명적인Token limit reached오류로 처리하고 모든 요청에서"temperature": 0(그리디 디코딩)를 전송합니다. - 추론 지원 모델 (예: 도구 호출을 내보내기 전에 내부 사고 토큰을 생성하는
gemma4:31b)의 경우 최소8,192토큰의 출력 토큰 한도와 완만한 반복 페널티를 구성합니다. 예를 들어 Ollama에서num_predict: 8192,repeat_penalty: 1.05,repeat_last_n: 64를 설정합니다. 과도하게 공격적인 반복 페널티(예: 큰 창에서1.15+)는 내부 추론 블록에서 최종 도구 호출 JSON으로 ES|QL 쿼리를 복사할 때 모델에 페널티를 주므로 피하세요.
- Kibana의 OpenAI 스트림 어댑터는
- GPU 가속, Flash Attention, 병렬 KV 캐시 슬롯(차례당 60초 미만):
- Kibana의 OpenAI 커넥터는 스트리밍 차례당 기본 60초 HTTP 제한 시간을 적용합니다.
- 단일 에이전트 차례에서 중첩된 LLM 하위 호출을 트리거할 수 있으므로 (예: 기본 에이전트 대화가 활성 상태인 동안 자연어 검색 요청을 ES|QL 쿼리로 변환) 단일 KV 캐시 슬롯만 있는 추론 서버를 실행하면 하위 호출이 기본 대화의 캐시된 컨텍스트를 제거하고 후속 차례를 느리게 만들 수 있습니다.
- Ollama에서
OLLAMA_FLASH_ATTENTION=1및OLLAMA_NUM_PARALLEL=2를 설정하여 Flash Attention이 긴 컨텍스트 평가를 가속화하고 기본 대화와 중첩된 하위 호출이 GPU 메모리에서 별도의 KV 캐시 슬롯을 유지하도록 합니다.
Kibana에서 LLM 커넥터 구성
OpenAI 호환 LLM 서비스가 실행 중이고 Kibana 포드에서 연결할 수 있으면 CLI 또는 Kibana UI를 사용하여 Kibana에서 OpenAI 커넥터를 구성합니다.
옵션 1: CLI를 통해 커넥터 만들기
다음
POST /api/actions/connector명령어를 실행하여 네이티브 함수 호출이 사용 설정된("enableNativeFunctionCalling": true) LLM 서비스 (${LLM_API_URL})를 가리키는 OpenAI (.gen-ai) 커넥터를 만듭니다. Kibana는 고유한 커넥터 ID를 자동으로 생성하고 할당합니다.curl -sk -u "elastic:${ELASTIC_PASSWORD}" \ -X POST "https://${KIBANA_IP}:5601/api/actions/connector" \ -H "kbn-xsrf: true" \ -H "Content-Type: application/json" \ -d "{ \"name\": \"${LLM_CONNECTOR_NAME}\", \"connector_type_id\": \".gen-ai\", \"config\": { \"apiProvider\": \"Other\", \"apiUrl\": \"${LLM_API_URL}\", \"defaultModel\": \"${LLM_MODEL_NAME}\", \"enableNativeFunctionCalling\": true }, \"secrets\": { \"apiKey\": \"${LLM_API_KEY}\" } }" | jq .Kibana의 커넥터를 나열하고 이름으로 필터링하여
${LLM_CONNECTOR_NAME}커넥터가 존재하고 누락된 보안 비밀이 없는지 확인합니다.curl -sk -u "elastic:${ELASTIC_PASSWORD}" \ "https://${KIBANA_IP}:5601/api/actions/connectors" \ -H "kbn-xsrf: true" \ | jq ".[] | select(.name == \"${LLM_CONNECTOR_NAME}\")"출력은 다음과 비슷하게 표시됩니다.
{
  "id": "<GENERATED_CONNECTOR_ID>",
  "name": "<LLM_CONNECTOR_NAME>",
  "config": {
    "apiProvider": "Other",
    "apiUrl": "<LLM_API_URL>",
    "defaultModel": "<LLM_MODEL_NAME>",
    "enableNativeFunctionCalling": true
  },
  "connector_type_id": ".gen-ai",
  "is_preconfigured": false,
  "is_deprecated": false,
  "referenced_by_count": 0,
  "is_missing_secrets": false,
  "is_system_action": false
}
CLI에서 Kibana와 LLM 서비스 간의 실시간 엔드 투 엔드 연결을 테스트하려면 자동 생성된 커넥터 ID를 이름으로 조회하고
_execute엔드포인트를 호출합니다.export CONNECTOR_ID=$(curl -sk -u "elastic:${ELASTIC_PASSWORD}" \ "https://${KIBANA_IP}:5601/api/actions/connectors" \ -H "kbn-xsrf: true" \ | jq -r ".[] | select(.name == \"${LLM_CONNECTOR_NAME}\") | .id") curl -sk -u "elastic:${ELASTIC_PASSWORD}" \ -X POST "https://${KIBANA_IP}:5601/api/actions/connector/${CONNECTOR_ID}/_execute" \ -H "kbn-xsrf: true" \ -H "Content-Type: application/json" \ -d "{ \"params\": { \"subAction\": \"invokeAI\", \"subActionParams\": { \"model\": \"${LLM_MODEL_NAME}\", \"messages\": [ { \"role\": \"user\", \"content\": \"Reply with the single word Pong.\" } ] } } }" | jq .출력은 다음과 비슷하게 표시되며
"status": "ok"및 모델의 응답이 표시됩니다.{ "status": "ok", "data": { "message": "Pong", "usage": { "prompt_tokens": 23, "prompt_tokens_details": { "cached_tokens": 0 }, "completion_tokens": 38, "total_tokens": 61 } }, "connector_id": "<GENERATED_CONNECTOR_ID>" }
옵션 2: Kibana UI를 통해 커넥터 만들기
- Kibana (
https://${KIBANA_IP}:5601)에 로그인합니다. - 기본 탐색 메뉴를 열고 관리 > 알림 및 인사이트 > 커넥터로 이동합니다.
- 커넥터 만들기를 클릭하고 OpenAI를 선택합니다.
- 커넥터 필드를 구성합니다.
- 커넥터 이름:
${LLM_CONNECTOR_NAME}값을 입력합니다 (예:Gemma4-31B). - OpenAI 제공업체 선택: 기타 (OpenAI 호환 서비스)를 선택합니다.
- URL:
${LLM_API_URL}(LLM 서비스의/v1/chat/completions엔드포인트) 값을 입력합니다. - 기본 모델:
${LLM_MODEL_NAME}값을 입력합니다 (예:gemma4:31b). - API 키:
${LLM_API_KEY}값을 입력합니다 (서버에서 Bearer 인증을 적용하지 않는 경우 비어 있지 않은 문자열 또는 서버의 API 키). - 네이티브 함수 호출 사용 설정: 전환 버튼을 사용 설정합니다.
- 커넥터 이름:
- 저장 및 테스트를 클릭하여 커넥터를 저장하고 테스트 탭을 즉시 엽니다.
- 테스트 탭에서 샘플 프롬프트 (예:
Reply with the
single word Pong.
)를 입력하고 실행을 클릭하여 Kibana가 LLM 서비스로부터 유효한 응답을 수신하는지 확인합니다.
LLM 통합 테스트
kibana_sample_data_logs 데이터 세트가 설치되고 LLM 커넥터가 확인되면 Kibana에서 Elastic의 AI 기능을 테스트할 수 있습니다.
Elastic AI Agent
Elastic AI Agent(elastic-ai-agent)는 자연어를 사용하여 Elasticsearch 전반에서 데이터를 탐색하고 분석하기 위해 Kibana에 통합된 기본 대화형 에이전트입니다.
구성된 LLM 커넥터와 기본 제공 Agent Builder 도구를 기반으로 하는 에이전트는 Elasticsearch 색인 및 매핑(platform.core.list_indices, platform.core.get_index_mapping)을 자동으로 검색하고, ES|QL 쿼리 (platform.core.search, platform.core.execute_esql)를 생성 및 실행하며, 기본 스키마를 미리 알 필요 없이 결과를 합성합니다. 맞춤 안내와 도구를 사용하여 자체 커스텀 에이전트를 빌드할 수도 있습니다. 자세한 내용은 Agent Builder를 사용한 커스텀 에이전트를 참조하세요.
Kibana UI에서 Elastic AI 에이전트를 열고 구성하려면 다음 안내를 따르세요.
- Kibana에서 기본 탐색 메뉴를 열고 AI 에이전트를 선택합니다. 또는 상단 헤더 표시줄에서 Ask AI 버튼을 클릭하거나
https://${KIBANA_IP}:5601/app/chat로 직접 이동합니다. - Elastic AI 에이전트가 활성 에이전트로 선택되어 있고 LLM 커넥터 (
${LLM_CONNECTOR_NAME})가 모델 커넥터로 선택되어 있는지 확인합니다.
예시 1: 실패한 HTTP 요청 및 잠재적 스캐너 조사
Elastic AI 에이전트에 kibana_sample_data_logs에서 200 이외의 HTTP 응답을 생성하는 상위 클라이언트 IP 주소, 해당 IP 주소의 출처 국가, 해당 IP 중 HTTP 200 트래픽이 성공한 IP가 있는지 확인하도록 요청합니다.
옵션 1: Kibana UI를 통해: AI 에이전트 채팅 프롬프트에 다음 질문을 입력합니다.
In kibana_sample_data_logs, which client IP addresses had the most
failed HTTP requests (non-200 status codes), what countries did they come
from, and did any of those IPs also have successful HTTP 200 requests?
옵션 2: CLI를 통해
curl -sk -u "elastic:${ELASTIC_PASSWORD}" \
  -X POST "https://${KIBANA_IP}:5601/api/agent_builder/converse" \
  -H "kbn-xsrf: true" \
  -H "Content-Type: application/json" \
  -d "{
    \"agent_id\": \"elastic-ai-agent\",
    \"connector_id\": \"${CONNECTOR_ID}\",
    \"input\": \"In kibana_sample_data_logs, which client IP addresses had the most failed HTTP requests (non-200 status codes), what countries did they come from, and did any of those IPs also have successful HTTP 200 requests?\"
  }" | jq '{
    status: .status,
    tools_called: [.steps[] | select(.type == "tool_call") | {tool_id: .tool_id, params: .params}],
    response: .response.message
  }'
가입 방법:
- 에이전트는
platform.core.get_index_mapping(indices=["kibana_sample_data_logs"])를 호출하여 사용 가능한 필드 (clientip,geo.src,response,bytes,request등)를 검사합니다. platform.core.search를 호출하여 샘플 문서를 검사하고 HTTP 상태 코드가response에 저장되어 있는지 확인한 다음 ES|QL 집계를 실행하여200가 아닌 요청을clientip및geo.src별로 순위를 매기고 상위 IP 중response == "200"트래픽도 기록한 IP를 확인합니다.FROM kibana_sample_data_logs | WHERE response != "200" | STATS failed_count = COUNT(*) BY clientip, geo.src | SORT failed_count DESC | LIMIT 10FROM kibana_sample_data_logs | WHERE clientip IN ("30.156.16.164", "213.235.30.99", "221.241.228.46", "209.94.234.133", "7.127.73.138", "247.240.202.244", "130.125.65.24", "164.85.94.243", "81.194.200.150", "30.145.143.210") AND response == "200" | STATS success_count = COUNT(*) BY clientip
Elastic AI 에이전트 응답은 다음과 비슷하게 표시됩니다.
kibana_sample_data_logs에서 실패한 HTTP 요청 (200 이외의 상태 코드)이 가장 많은 클라이언트 IP 주소는 30.156.16.164이며, 미국에서 시작되었고 실패한 요청이 100건 기록되었습니다.실패한 요청이 있는 다른 상위 IP 주소(모두 미국에서 시작됨)는 다음과 같습니다.
- 213.235.30.99: 6회 실패
- 221.241.228.46: 6회 실패
- 209.94.234.133: 실패 6회
- 7.127.73.138: 실패 5회
- 247.240.202.244: 5회 실패
- 130.125.65.24: 5회 실패
- 164.85.94.243: 4회 실패
- 81.194.200.150: 실패 4회
- 30.145.143.210: 4회 실패
성공적인 요청과 관련하여 위에 나열된 모든 IP에는 성공적인 HTTP 200 응답이 최소한 일부 있었지만 30.156.16.164에는 성공적인 요청이 없었습니다.
예시 2: HTTP 상태 코드별 트래픽 볼륨 및 페이로드 바이트 분석
Elastic AI 에이전트에 kibana_sample_data_logs의 모든 요청에 대한 HTTP 응답 상태 코드 분석과 각 상태 코드에 대해 전송된 총 바이트를 요청합니다.
옵션 1: Kibana UI를 통해: AI 에이전트에서 새 대화를 시작하고 다음 질문을 입력합니다.
In kibana_sample_data_logs, what is the breakdown of HTTP response
status codes across all requests, and how much total data (in bytes) was
transferred for each status code?
옵션 2: CLI를 통해
curl -sk -u "elastic:${ELASTIC_PASSWORD}" \
  -X POST "https://${KIBANA_IP}:5601/api/agent_builder/converse" \
  -H "kbn-xsrf: true" \
  -H "Content-Type: application/json" \
  -d "{
    \"agent_id\": \"elastic-ai-agent\",
    \"connector_id\": \"${CONNECTOR_ID}\",
    \"input\": \"In kibana_sample_data_logs, what is the breakdown of HTTP response status codes across all requests, and how much total data (in bytes) was transferred for each status code?\"
  }" | jq '{
    status: .status,
    tools_called: [.steps[] | select(.type == "tool_call") | {tool_id: .tool_id, params: .params}],
    response: .response.message
  }'
가입 방법:
- 에이전트는
platform.core.get_index_mapping를 통해kibana_sample_data_logs스키마를 검사하여response.keyword및bytes필드를 식별합니다. platform.core.search를 호출하여 다음 ES|QL 집계를 생성하고 실행합니다.FROM kibana_sample_data_logs | STATS request_count = COUNT(*), total_bytes = SUM(bytes) BY response.keyword | LIMIT 100
Elastic AI 에이전트 응답은 다음과 비슷하게 표시됩니다.
HTTP 응답 상태 코드와
kibana_sample_data_logs에서 전송된 총 데이터의 분석은 다음과 같습니다.
| 상태 코드 | 요청 수 | 전송된 총 데이터 (바이트) |
|---|---|---|
| 200 | 12,832 | 75,681,246 |
| 404 | 801 | 4,044,443 |
| 503 | 441 | 0 |
Agent Builder를 사용한 커스텀 에이전트
Agent Builder를 사용하면 커스텀 시스템 안내를 기본 제공 도구 (예: platform.core.cases, platform.core.execute_esql, platform.core.search) 및 사용자 정의 도구 (esql, index_search, workflow, mcp)와 결합하여 특정 운영 워크플로에 맞춤설정된 커스텀 AI 에이전트를 만들 수 있습니다.
다음 예시에서는 kibana_sample_data_logs 데이터 세트에서 직접 작동하는 웹 보안 사고 대응 담당자 에이전트를 빌드합니다. 자연어 프롬프트가 주어지면 에이전트는 다음을 수행합니다.
- 커스텀 ES|QL 도구 (
investigate_suspicious_web_clients)를 실행하여kibana_sample_data_logs의200이외의 HTTP 응답을 클라이언트 IP별로 집계합니다. - 악의적인 정찰 및 악용 활동(
30.156.16.164)을 정상적인 다운로드 실패와 구분합니다. - 커스텀 Kibana 워크플로 도구 (
create_security_case)를 호출하여 발견 항목 및 해결 단계가 포함된 구조화된 Kibana 보안 케이스를 자동으로 엽니다.
커스텀 ES|QL 및 케이스 제작 도구 만들기
kibana_sample_data_logs에서200이외의 HTTP 상태 코드를 생성하는 상위 클라이언트 IP 주소와 상태 코드, 출처 국가(geo.src), 사용자 에이전트 (agent), 요청된 URL (request)을 쿼리하는investigate_suspicious_web_clients라는 커스텀esql도구를 만듭니다.옵션 1: Kibana UI를 통해
- Kibana에서 기본 탐색 메뉴를 열고 Elasticsearch > 에이전트로 이동한 후 모든 도구 관리를 클릭하거나(또는
https://${KIBANA_IP}:5601/app/agent_builder/tools로 직접 이동) 새 도구를 클릭합니다. 도구 필드를 구성합니다.
- 도구 ID:
investigate_suspicious_web_clients - 유형: ES|QL
- 설명:
Finds the top client IP addresses generating non-200 HTTP error responses in kibana_sample_data_logs, returning their error count, status codes, source country, user agents, and requested URL paths. - 라벨:
security,logs ES|QL 쿼리:
FROM kibana_sample_data_logs | WHERE response != "200" | STATS error_count = COUNT(*), status_codes = VALUES(response), country = VALUES(geo.src), user_agents = VALUES(agent), sample_requests = VALUES(request) BY clientip | SORT error_count DESC | LIMIT 5
- 도구 ID:
저장을 클릭합니다.
- Kibana에서 기본 탐색 메뉴를 열고 Elasticsearch > 에이전트로 이동한 후 모든 도구 관리를 클릭하거나(또는
옵션 2: CLI를 통해
curl -sk -u "elastic:${ELASTIC_PASSWORD}" \
  -X POST "https://${KIBANA_IP}:5601/api/agent_builder/tools" \
  -H "kbn-xsrf: true" \
  -H "Content-Type: application/json" \
  -d '{
    "id": "investigate_suspicious_web_clients",
    "type": "esql",
    "description": "Finds the top client IP addresses generating non-200 HTTP error responses in kibana_sample_data_logs, returning their error count, status codes, source country, user agents, and requested URL paths.",
    "tags": ["security", "logs"],
    "configuration": {
      "query": "FROM kibana_sample_data_logs | WHERE response != \"200\" | STATS error_count = COUNT(*), status_codes = VALUES(response), country = VALUES(geo.src), user_agents = VALUES(agent), sample_requests = VALUES(request) BY clientip | SORT error_count DESC | LIMIT 5",
      "params": {}
    }
  }' | jq '{id: .id, type: .type}'
Agent Builder의 내장
platform.core.cases도구는 읽기 전용(기존 케이스를 검색하고 가져오는 데 사용)이므로 Kibana의 기본cases.createCase단계를 호출하는 Kibana 워크플로(create-security-case)를 만들고 이를create_security_case이라는workflow도구로 등록합니다.옵션 1: Kibana UI를 통해:
- 기본 탐색 메뉴를 열고 관리 > 워크플로로 이동하거나
https://${KIBANA_IP}:5601/app/workflows로 바로 이동한 다음 새 워크플로 만들기를 클릭합니다. YAML 편집기에서 다음 워크플로 정의를 붙여넣고 저장을 클릭합니다.
version: "1"
name: Create Security Case
description: Creates a new Kibana Case in Elastic Security
enabled: true
triggers:
  - type: manual
inputs:
  - name: title
    type: string
    required: true
    description: Title of the security case
  - name: description
    type: string
    required: true
    description: Detailed markdown description of the incident findings
  - name: severity
    type: string
    default: high
    description: Severity of the case (low, medium, high, critical)
steps:
  - name: create_case
    type: cases.createCase
    with:
      title: ${{ inputs.title }}
      description: ${{ inputs.description }}
      severity: ${{ inputs.severity }}
      owner: securitySolution
      tags:
        - agent-builder
        - web-logs
Agent Builder 도구 페이지(
https://${KIBANA_IP}:5601/app/agent_builder/tools또는 Elasticsearch > 에이전트로 이동하여 모든 도구 관리 클릭)로 돌아가 새 도구를 클릭합니다.워크플로 도구 필드를 구성하고 저장을 클릭합니다.
- 도구 ID:
create_security_case - 유형: 워크플로
- 워크플로: 보안 케이스 만들기(
create-security-case)를 선택합니다. - 설명:
Creates a new Kibana Case in Elastic Security with a title, markdown description of the incident findings, and severity (low, medium, high, critical). - 라벨:
security,cases
- 도구 ID:
- 기본 탐색 메뉴를 열고 관리 > 워크플로로 이동하거나
옵션 2: CLI를 통해
curl -sk -u "elastic:${ELASTIC_PASSWORD}" \
  -X POST "https://${KIBANA_IP}:5601/api/workflows" \
  -H "kbn-xsrf: true" \
  -H "Content-Type: application/json" \
  -d '{
    "workflows": [
      {
        "yaml": "version: \"1\"\nname: Create Security Case\ndescription: Creates a new Kibana Case in Elastic Security\nenabled: true\ntriggers:\n  - type: manual\ninputs:\n  - name: title\n    type: string\n    required: true\n    description: Title of the security case\n  - name: description\n    type: string\n    required: true\n    description: Detailed markdown description of the incident findings\n  - name: severity\n    type: string\n    default: high\n    description: Severity of the case (low, medium, high, critical)\nsteps:\n  - name: create_case\n    type: cases.createCase\n    with:\n      title: ${{ inputs.title }}\n      description: ${{ inputs.description }}\n      severity: ${{ inputs.severity }}\n      owner: securitySolution\n      tags:\n        - agent-builder\n        - web-logs\n"
      }
    ]
  }' | jq '.created[] | {id: .id, valid: .valid}'

curl -sk -u "elastic:${ELASTIC_PASSWORD}" \
  -X POST "https://${KIBANA_IP}:5601/api/agent_builder/tools" \
  -H "kbn-xsrf: true" \
  -H "Content-Type: application/json" \
  -d '{
    "id": "create_security_case",
    "type": "workflow",
    "description": "Creates a new Kibana Case in Elastic Security with a title, markdown description of the incident findings, and severity (low, medium, high, critical).",
    "tags": ["security", "cases"],
    "configuration": {
      "workflow_id": "create-security-case"
    }
  }' | jq '{id: .id, type: .type}'
커스텀 사고 대응 담당자 에이전트 만들기
web-security-incident-responder 에이전트를 만들고 investigate_suspicious_web_clients, create_security_case, platform.core.cases 도구를 할당합니다.
옵션 1: Kibana UI를 통해:
- 기본 탐색 메뉴를 열고 Elasticsearch > 에이전트로 이동하거나
https://${KIBANA_IP}:5601/app/agent_builder/agents로 직접 이동한 후 새 에이전트를 클릭합니다. 에이전트 세부정보를 구성합니다.
- 상담사 ID:
web-security-incident-responder - Display name(표시 이름):
Web Security Incident Responder - 표시 설명:
Investigates suspicious HTTP error activity in web access logs and opens Kibana Security Cases with the findings. - 라벨:
security,incident-response 맞춤 요청 사항:
You are an automated Web Security Incident Responder. When asked to investigate suspicious web traffic: 1. Call the `investigate_suspicious_web_clients` tool to inspect the top client IPs generating non-200 HTTP responses in `kibana_sample_data_logs`. 2. Identify any client IP exhibiting malicious reconnaissance or exploitation behavior (such as Nmap scans, WordPress login probing, `/etc/passwd` path traversal, or `/level/15/exec` command execution attempts) versus benign download errors. 3. Call the `create_security_case` tool to open a new Kibana Security Case for the malicious client IP. Set an appropriate `title`, `severity` (`high`), and a well-structured Markdown `description` summarizing the source IP, geolocation, total failed requests, observed attack categories (mapped to MITRE ATT&CK where applicable), sample malicious URLs, and recommended remediation steps. 4. Return a concise summary of your investigation and confirm the created Kibana Case details.도구:
investigate_suspicious_web_clients,create_security_case,platform.core.cases을 선택합니다.
- 상담사 ID:
저장을 클릭합니다.
- 기본 탐색 메뉴를 열고 Elasticsearch > 에이전트로 이동하거나
옵션 2: CLI를 통해
curl -sk -u "elastic:${ELASTIC_PASSWORD}" \
  -X POST "https://${KIBANA_IP}:5601/api/agent_builder/agents" \
  -H "kbn-xsrf: true" \
  -H "Content-Type: application/json" \
  -d '{
    "id": "web-security-incident-responder",
    "name": "Web Security Incident Responder",
    "description": "Investigates suspicious HTTP error activity in web access logs and opens Kibana Security Cases with the findings.",
    "labels": ["security", "incident-response"],
    "avatar_color": "#E7664C",
    "avatar_symbol": "IR",
    "configuration": {
      "instructions": "You are an automated Web Security Incident Responder. When asked to investigate suspicious web traffic:\n1. Call the `investigate_suspicious_web_clients` tool to inspect the top client IPs generating non-200 HTTP responses in `kibana_sample_data_logs`.\n2. Identify any client IP exhibiting malicious reconnaissance or exploitation behavior (such as Nmap scans, WordPress login probing, `/etc/passwd` path traversal, or `/level/15/exec` command execution attempts) versus benign download errors.\n3. Call the `create_security_case` tool to open a new Kibana Security Case for the malicious client IP. Set an appropriate `title`, `severity` (`high`), and a well-structured Markdown `description` summarizing the source IP, geolocation, total failed requests, observed attack categories (mapped to MITRE ATT&CK where applicable), sample malicious URLs, and recommended remediation steps.\n4. Return a concise summary of your investigation and confirm the created Kibana Case details.",
      "tools": [
        {
          "tool_ids": [
            "investigate_suspicious_web_clients",
            "create_security_case",
            "platform.core.cases"
          ]
        }
      ]
    }
  }' | jq '{id: .id, name: .name}'
에이전트를 실행하고 Kibana 케이스 확인
웹 보안 사고 대응 담당자 에이전트와 대화를 실행합니다.
옵션 1: Kibana UI를 통해
- 기본 탐색 메뉴를 열고 Elasticsearch > 에이전트로 이동하거나
https://${KIBANA_IP}:5601/app/agent_builder로 직접 이동합니다. - 에이전트 선택기에서 웹 보안 사고 대응 담당자를 선택하고 LLM 커넥터 (
${LLM_CONNECTOR_NAME})가 선택되어 있는지 확인합니다. 다음 프롬프트를 입력합니다.
Investigate the top client IPs generating HTTP errors in our web
logs, identify any attacker performing reconnaissance or
exploitation, and open a high-severity Kibana Security Case with
your findings.
- 기본 탐색 메뉴를 열고 Elasticsearch > 에이전트로 이동하거나
옵션 2: CLI를 통해
curl -sk -u "elastic:${ELASTIC_PASSWORD}" \
  -X POST "https://${KIBANA_IP}:5601/api/agent_builder/converse" \
  -H "kbn-xsrf: true" \
  -H "Content-Type: application/json" \
  -d "{
    \"agent_id\": \"web-security-incident-responder\",
    \"connector_id\": \"${CONNECTOR_ID}\",
    \"input\": \"Investigate the top client IPs generating HTTP errors in our web logs, identify any attacker performing reconnaissance or exploitation, and open a high-severity Kibana Security Case with your findings.\"
  }" | jq '{
    status: .status,
    tools_called: [.steps[] | select(.type == "tool_call") | .tool_id],
    response: .response.message
  }'
출력은 다음과 비슷하게 표시됩니다.
{
  "status": "completed",
  "tools_called": [
    "investigate_suspicious_web_clients",
    "create_security_case"
  ],
  "response": "I have completed the investigation into the web logs. \n\nThe analysis identified client IP **`30.156.16.164`** (located in the US) as a malicious actor. This IP generated 100 failed requests (HTTP 404) exhibiting clear patterns of reconnaissance and exploitation:\n\n*   **Reconnaissance:** Extensive probing for WordPress installations and plugins, as well as Nmap scan signatures (e.g., `/nmaplowercheck...`).\n*   **Path Traversal:** Attempts to access sensitive system files via `/etc/passwd`.\n*   **Remote Command Execution (RCE):** Attempts to execute commands through paths such as `/level/15/exec`.\n*   **Application Probing:** Targeting common management interfaces including Tomcat, Axis2, and JMX consoles.\n\nAs a result, I have opened a **high-severity** Kibana Security Case to track this incident:\n\n*   **Case ID:** `1f0e00a5-cc89-4f62-b305-f286fae3d70e`\n*   **Title:** Malicious Reconnaissance and Exploitation Attempt from 30.156.16.164\n*   **Recommended Action:** Immediately block the IP at the firewall/WAF and verify that no unauthorized access was achieved."
}
새로 만든 Kibana 보안 케이스를 확인합니다.
옵션 1: Kibana UI를 통해
- 기본 탐색 메뉴를 열고 보안 > 케이스로 이동하거나
https://${KIBANA_IP}:5601/app/security/cases로 직접 이동합니다. - 30.156.16.164의 악의적인 정찰 및 악용 시도를 클릭하여 형식화된 마크다운 사고 요약, MITRE ATT&CK 분석, 샘플 악성 URL, 해결 체크리스트를 확인합니다.
- 기본 탐색 메뉴를 열고 보안 > 케이스로 이동하거나
옵션 2: CLI를 통해
curl -sk -u "elastic:${ELASTIC_PASSWORD}" \
  "https://${KIBANA_IP}:5601/api/cases/_find" \
  -H "kbn-xsrf: true" \
  | jq '.cases[0] | {id: .id, title: .title, severity: .severity, status: .status, tags: .tags, description: .description}'
출력은 다음과 비슷하게 표시됩니다.
{
  "id": "1f0e00a5-cc89-4f62-b305-f286fae3d70e",
  "title": "Malicious Reconnaissance and Exploitation Attempt from 30.156.16.164",
  "severity": "high",
  "status": "open",
  "tags": [
    "agent-builder",
    "web-logs"
  ],
  "description": "### Incident Summary\n**Source IP:** `30.156.16.164`\n**Geolocation:** US\n**Total Failed Requests:** 100\n**Status Codes Observed:** 404\n\n### Analysis\nThe client IP exhibited clear patterns of malicious reconnaissance and exploitation attempts:\n\n- **Reconnaissance (MITRE ATT&CK T1595):** Extensive probing for WordPress installations (`/wp-login.php`, various plugin paths) and Nmap scan signatures (`/nmaplowercheck...`).\n- **Path Traversal (MITRE ATT&CK T1083):** Attempted to access sensitive system files via `/cgi-bin/mj_wwwusr?passw=&list=GLOBAL&user=&func=help&extra=/../../../../../../../../etc/passwd`.\n- **Remote Command Execution (MITRE ATT&CK T1203):** Attempts to execute commands via paths like `/level/15/exec/-/configure/http`.\n- **Application Probing:** Targeted common management interfaces such as `/tomcat/manager/html/`, `/axis2/axis2-admin/`, and `/jmx-console/`.\n\n### Sample Malicious URLs\n- `/cgi-bin/mj_wwwusr?passw=&list=GLOBAL&user=&func=help&extra=/../../../../../../../../etc/passwd`\n- `/level/15/exec/-/configure/http`\n- `/nmaplowercheck1331872976`\n- `/wp-login.php`\n\n### Recommended Remediation\n1. **Block IP:** Immediately block `30.156.16.164` at the network firewall/WAF.\n2. **Log Review:** Verify that all requests from this IP resulted in 404 errors and no unauthorized access was gained.\n3. **Hardening:** Ensure that sensitive directories (e.g., `/cgi-bin/`, `/manager/`) are properly restricted."
}
공격 탐지
공격 탐지는 Elastic Security의 AI 기능으로, 열려 있는 보안 알림을 분석하고, MITRE ATT&CK 프레임워크에 매핑하고, 관련 알림, IP 주소, 사용자 계정을 시각적 공격 체인으로 상호 연결합니다. 공격 탐지에는 여러 알림 구조화된 JSON 출력을 안정적으로 합성할 수 있는 대규모 모델이 필요하므로 30B 클래스 이상의 모델 (예: gemma4:31b)을 사용하세요.
샘플 로그에서 보안 알림 생성
기본적으로 kibana_sample_data_logs 데이터 세트에는 원시 웹 액세스 로그가 포함되어 있으며 Elastic Security 보안 알림 색인(.alerts-security.alerts-default)이 채워지지 않습니다. 또한 Kibana의 샘플 데이터 생성기는 30.156.16.164의 100개 스캔 및 악용 요청에 미래 @timestamp 값 (최대 30일 후)을 할당하므로 Elastic Security 감지 규칙에서 쿼리한 now-30d~now 기간 외부에 배치됩니다.
샘플 로그로 공격 탐지를 시연하려면 30.156.16.164 레코드의 @timestamp를 30일 전으로 이동하고, Elastic Common Schema (ECS) source.ip 및 user.name 필드로 보강하고, 이러한 이벤트에서 보안 알림을 생성하는 두 개의 탐지 규칙을 만듭니다.
clientip를source.ip에 매핑하고,user.name(www-data)를 설정하고,kibana_sample_data_logs*의30.156.16.164레코드에서@timestamp을 30일 전으로 이동합니다.curl -sk -u "elastic:${ELASTIC_PASSWORD}" \ -X POST "https://${ELASTICSEARCH_IP}:9200/kibana_sample_data_logs*/_update_by_query?conflicts=proceed&refresh=true" \ -H "Content-Type: application/json" \ -d '{ "query": { "term": { "clientip": "30.156.16.164" } }, "script": { "source": "ctx._source.source = [\"ip\": ctx._source.clientip]; ctx._source.user = [\"name\": \"www-data\"]; ctx._source[\"@timestamp\"] = ZonedDateTime.parse(ctx._source[\"@timestamp\"]).minusDays(30).toString();", "lang": "painless" } }' | jq '{updated: .updated, failures: .failures}'kibana_sample_data_logs*를 타겟팅하는 Elastic Security 감지 규칙 두 개를 만듭니다. 첫 번째 규칙은 Nmap 및 WordPress 로그인 프로빙 (Reconnaissance)을 감지하고 두 번째 규칙은/etc/passwd경로 트래버설 및 원격 명령어 실행 시도 (Initial Access)를 감지합니다.curl -sk -u "elastic:${ELASTIC_PASSWORD}" \ -X POST "https://${KIBANA_IP}:5601/api/detection_engine/rules" \ -H "kbn-xsrf: true" \ -H "Content-Type: application/json" \ -d '{ "name": "Suspicious Web Reconnaissance and Vulnerability Scanning", "description": "Detects Nmap active scanning and WordPress login/plugin probing in web access logs.", "risk_score": 47, "severity": "medium", "type": "query", "language": "kuery", "query": "clientip: \"30.156.16.164\" and (request: *nmap* or request: *wp-login*)", "index": ["kibana_sample_data_logs*"], "from": "now-30d", "interval": "1h", "max_signals": 2, "enabled": true, "threat": [ { "framework": "MITRE ATT&CK", "tactic": { "id": "TA0043", "name": "Reconnaissance", "reference": "https://attack.mitre.org/tactics/TA0043/" }, "technique": [ { "id": "T1595", "name": "Active Scanning", "reference": "https://attack.mitre.org/techniques/T1595/" } ] } ] }' | jq '{id: .id, name: .name, enabled: .enabled}' curl -sk -u "elastic:${ELASTIC_PASSWORD}" \ -X POST "https://${KIBANA_IP}:5601/api/detection_engine/rules" \ -H "kbn-xsrf: true" \ -H "Content-Type: application/json" \ -d '{ "name": "Web Path Traversal and Remote Command Execution Attempt", "description": "Detects path traversal attempts targeting /etc/passwd and Cisco IOS privilege level 15 remote command execution (/level/15/exec).", "risk_score": 73, "severity": "high", "type": "query", "language": "kuery", "query": "clientip: \"30.156.16.164\" and (request: *passwd* or request: *exec*)", "index": ["kibana_sample_data_logs*"], "from": "now-30d", "interval": "1h", "max_signals": 2, "enabled": true, "threat": [ { "framework": "MITRE ATT&CK", "tactic": { "id": "TA0001", "name": "Initial Access", "reference": "https://attack.mitre.org/tactics/TA0001/" }, "technique": [ { "id": "T1190", "name": "Exploit Public-Facing Application", "reference": "https://attack.mitre.org/techniques/T1190/" } ] } ] }' | jq '{id: .id, name: .name, enabled: .enabled}'초기 규칙 실행이 완료될 때까지 약 60초 동안 기다린 후 알림 4개가
.alerts-security.alerts-default에 색인 생성되었는지 확인합니다.curl -sk -u "elastic:${ELASTIC_PASSWORD}" \ "https://${ELASTICSEARCH_IP}:9200/.alerts-security.alerts-default/_search?size=4" \ | jq '.hits.hits[]._source | {rule: .["kibana.alert.rule.name"], source_ip: .source.ip, user_name: .user.name, request: .request}'출력은 다음과 비슷하게 표시됩니다.
{
  "rule": "Web Path Traversal and Remote Command Execution Attempt",
  "source_ip": "30.156.16.164",
  "user_name": "www-data",
  "request": "/cgi-bin/mj_wwwusr?passw=&list=GLOBAL&user=&func=help&extra=/../../../../../../../../etc/passwd"
}
{
  "rule": "Web Path Traversal and Remote Command Execution Attempt",
  "source_ip": "30.156.16.164",
  "user_name": "www-data",
  "request": "/cgi-bin/mj_wwwusr?passw=&list=GLOBAL&user=&func=help&extra=/../../../../../../../../etc/passwd"
}
{
  "rule": "Suspicious Web Reconnaissance and Vulnerability Scanning",
  "source_ip": "30.156.16.164",
  "user_name": "www-data",
  "request": "/nmaplowercheck1331872976"
}
{
  "rule": "Suspicious Web Reconnaissance and Vulnerability Scanning",
  "source_ip": "30.156.16.164",
  "user_name": "www-data",
  "request": "/nmaplowercheck1331873003"
}
공격 검색 실행
- Kibana에서 기본 탐색 메뉴를 열고 보안 > 공격 탐색으로 이동하거나
https://${KIBANA_IP}:5601/app/security/attack_discovery로 직접 이동합니다. - 페이지 상단의 커넥터 메뉴에서 LLM 커넥터 (
${LLM_CONNECTOR_NAME})를 선택합니다. - 생성을 클릭하여
.alerts-security.alerts-default에서 열린 알림을 분석합니다.
CLI에서 공격 탐색을 트리거하고 검사할 수도 있습니다.
export EXECUTION_UUID=$(curl -sk -u "elastic:${ELASTIC_PASSWORD}" \
  -X POST "https://${KIBANA_IP}:5601/api/attack_discovery/_generate" \
  -H "kbn-xsrf: true" \
  -H "elastic-api-version: 2023-10-31" \
  -H "Content-Type: application/json" \
  -d "{
    \"alertsIndexPattern\": \".alerts-security.alerts-default\",
    \"anonymizationFields\": [
      {\"id\": \"_id\", \"field\": \"_id\", \"allowed\": true},
      {\"id\": \"@timestamp\", \"field\": \"@timestamp\", \"allowed\": true},
      {\"id\": \"kibana.alert.original_time\", \"field\": \"kibana.alert.original_time\", \"allowed\": true},
      {\"id\": \"message\", \"field\": \"message\", \"allowed\": true},
      {\"id\": \"kibana.alert.rule.name\", \"field\": \"kibana.alert.rule.name\", \"allowed\": true},
      {\"id\": \"kibana.alert.rule.description\", \"field\": \"kibana.alert.rule.description\", \"allowed\": true},
      {\"id\": \"kibana.alert.severity\", \"field\": \"kibana.alert.severity\", \"allowed\": true},
      {\"id\": \"kibana.alert.risk_score\", \"field\": \"kibana.alert.risk_score\", \"allowed\": true},
      {\"id\": \"kibana.alert.rule.threat.tactic.id\", \"field\": \"kibana.alert.rule.threat.tactic.id\", \"allowed\": true},
      {\"id\": \"kibana.alert.rule.threat.tactic.name\", \"field\": \"kibana.alert.rule.threat.tactic.name\", \"allowed\": true},
      {\"id\": \"kibana.alert.rule.threat.technique.id\", \"field\": \"kibana.alert.rule.threat.technique.id\", \"allowed\": true},
      {\"id\": \"kibana.alert.rule.threat.technique.name\", \"field\": \"kibana.alert.rule.threat.technique.name\", \"allowed\": true},
      {\"id\": \"source.ip\", \"field\": \"source.ip\", \"allowed\": true},
      {\"id\": \"user.name\", \"field\": \"user.name\", \"allowed\": true}
    ],
    \"apiConfig\": {
      \"actionTypeId\": \".gen-ai\",
      \"connectorId\": \"${CONNECTOR_ID}\"
    },
    \"replacements\": {},
    \"size\": 20,
    \"subAction\": \"invokeAI\"
  }" | jq -r '.execution_uuid')

echo "Attack Discovery execution UUID: ${EXECUTION_UUID}"
생성이 완료되면 (약 60~90초) 발견된 공격 체인을 가져옵니다.
curl -sk -u "elastic:${ELASTIC_PASSWORD}" \
  "https://${KIBANA_IP}:5601/api/attack_discovery/_find" \
  -H "kbn-xsrf: true" \
  -H "elastic-api-version: 2023-10-31" \
  | jq '.data[0]'
생성된 공격 검색은 연결된 소스 IP, 사용자 계정, MITRE ATT&CK 전술을 사용하여 4개의 알림을 단일 사고로 연결합니다.
{
  "alert_ids": [
    "05c30118398ea2a8b70c55ce81fdb559dbe14c460a8a95253bd81719415a28b5",
    "73ebaeca440b463ffa5812da5b68a2485d465a648ffaf16385a54d8bae9a53d2",
    "60ae9f16b40cec1bdc27674ade0e5eb69680ccca3d956fbf2a75418843799987",
    "de503ae52444db7712d062c54750f413b90a75521cdfff0de9bdf41a64141346"
  ],
  "alert_rule_uuid": "attack_discovery_ad_hoc_rule_id",
  "alert_start": "2026-10-03T01:05:00.384Z",
  "alert_updated_at": "2026-10-03T01:05:03.460Z",
  "alert_workflow_status": "open",
  "alert_workflow_status_updated_at": "2026-10-03T01:05:03.460Z",
  "connector_id": "<GENERATED_CONNECTOR_ID>",
  "connector_name": "<GENERATED_CONNECTOR_ID>",
  "details_markdown": "- The attack sequence began at `2026-10-01T12:43:41.756Z` when an actor using IP `30.156.16.164` performed active reconnaissance scanning against the server.\n- Following the initial scan, the attacker attempted to exploit a path traversal vulnerability at `2026-10-01T12:43:51.756Z` and again at `2026-10-01T12:44:02.756Z`, specifically targeting the `/etc/passwd` file via the `mj_wwwusr` CGI endpoint.\n- The activity concluded with further reconnaissance scanning at `2026-10-01T12:44:21.756Z` from the same source IP `30.156.16.164`.\n- All requests were associated with the user `www-data` and resulted in 404 errors, suggesting the attempts were unsuccessful.",
  "entity_summary_markdown": "Activity targeting user `www-data` from source IP `30.156.16.164`.",
  "generation_uuid": "<EXECUTION_UUID>",
  "id": "1f71ed004c7340d5088d242ca2483525a164a9ea9a80a3f90bd1f514d43231bc",
  "mitre_attack_tactics": [
    "Reconnaissance",
    "Initial Access"
  ],
  "risk_score": 240,
  "summary_markdown": "An attacker from `30.156.16.164` performed reconnaissance and path traversal attempts against the system.",
  "timestamp": "2026-10-03T01:05:00.384Z",
  "title": "Web Reconnaissance and Exploitation Attempt",
  "user_id": "elastic",
  "user_name": "elastic",
  "users": [
    {
      "id": "elastic",
      "name": "elastic"
    }
  ],
  "index": ".internal.adhoc.alerts-security.attack.discovery.alerts-default-000001"
}