This document explains how to read Cloud DNS metrics dashboards in Google Distributed Cloud (GDC) air-gapped. The metrics dashboard provides graphs and visualization panels for viewing the health and performance of your Managed DNS Zones. Use these dashboards to monitor DNS requests, response rate, and latency.
This document is for developers in platform administrator or application operator groups that need to monitor DNS system health. For more information, see Audiences for GDC air-gapped documentation.
Open the following URL to access the Cloud DNS dashboard:
https://GDC_URL/PROJECT_NAME/grafana/d/cfemcae44701sb/cloud-dns
Replace the following:
GDC_URL: the URL of your organization in Google Distributed Cloud (GDC) air-gapped.PROJECT_NAME: the name of your project.
Cloud DNS dashboard
The Cloud DNS dashboard presents graphs and visualization panels that contain information about the requests, errors, and latency for your Managed DNS Zones.
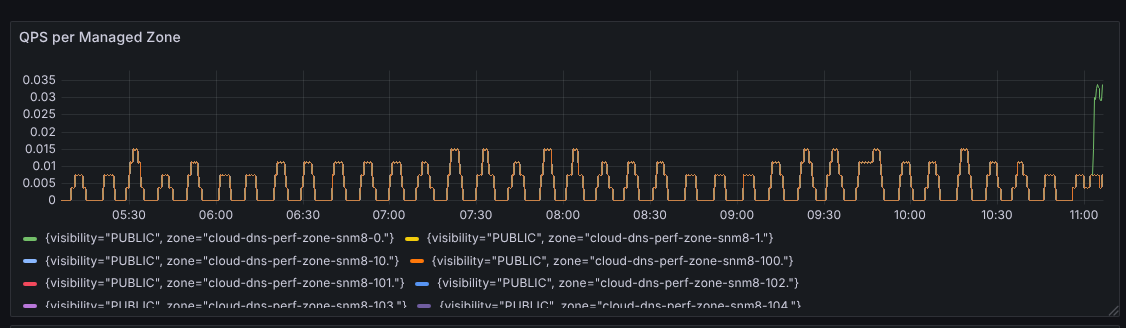
QPS per Managed Zone
This panel displays the queries per second (QPS) for each Managed DNS Zone in the selected project. It helps you visualize the rate of total DNS requests being handled by each zone.
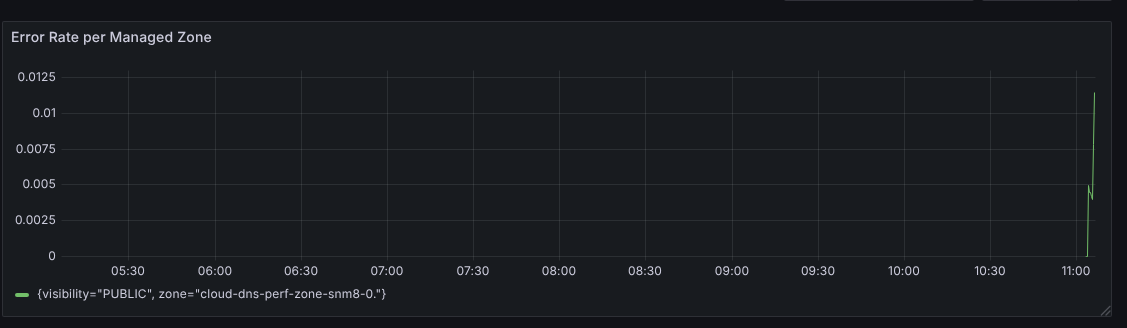
Error Rate per Managed Zone
This panel shows the rate of DNS responses that are not NOERROR (successful
resolution) or NXDOMAIN (hostname not found). Monitoring this metric helps you
identify potential issues with DNS resolution, such as misconfigurations or
server problems.
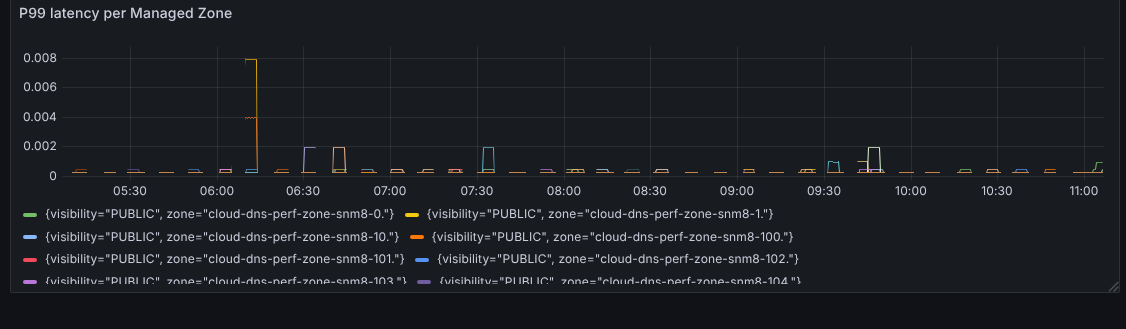
P99 latency per Managed Zone
This panel displays the 99th percentile of DNS request latency. This metric is useful for understanding the performance of your DNS zones and identifying potential bottlenecks that may be impacting request times.