The Customer Real Time Cost dashboard helps you monitor real-time cost and resource usage for your infrastructure as it occurs. This dashboard displays active resource consumption and accumulated costs through line graph panels for costs and usage.
To get the permissions that you need to view the Customer Real Time Cost dashboard, ask your Organization IAM Admin to grant you the corresponding project viewer role for the platform-obs project.
Access the Customer Real Time Cost dashboard
Access the Customer Real Time Cost dashboard in the GDC console:
- Sign in to the GDC console.
- In the navigation menu, select Billing > Reports. The Billing reports page opens.
- In the Real Time Cost section, click View in Dashboard to open the Customer Real Time Cost dashboard.
Real Time Cost dashboard functionalities
The dashboard features the following primary visualization panels:
- Costs: Line graph displaying the active cost incurred for your selected resources. You can view it in discrete or cumulative mode.
- Resource Usage: Line graph displaying the active volume of resource consumption (such as vCPU, memory, or storage allocation) for your selected resources.
The time interval for the panels adjusts dynamically based on your selected time range: hourly for durations of 8 days or less, and daily for durations greater than 8 days.
Filter real-time cost data
The following filters can be applied to the dashboard:
- Aggregation Level: A drop-down list that lets you select the grouping level of the data. You can view costs aggregated by individual SKU, Product Family (such as Compute or Storage), Cloud Service Model (such as IaaS or PaaS) or the Total cost.
- Project Name: A drop-down list that lets you select a specific project name to view. This drop-down defaults to All.
- SKU: A drop-down list that lets you select which SKU to view. This drop-down defaults to All.
Time Range: User can pick any custom time range from the Grafana time picker. There are also some preset time periods (buttons) made available in the dashboard:
- Previous Billing Period
- Current Billing Period
- Year To Date
- Last 7 Days
- Current Day
Download dashboard data
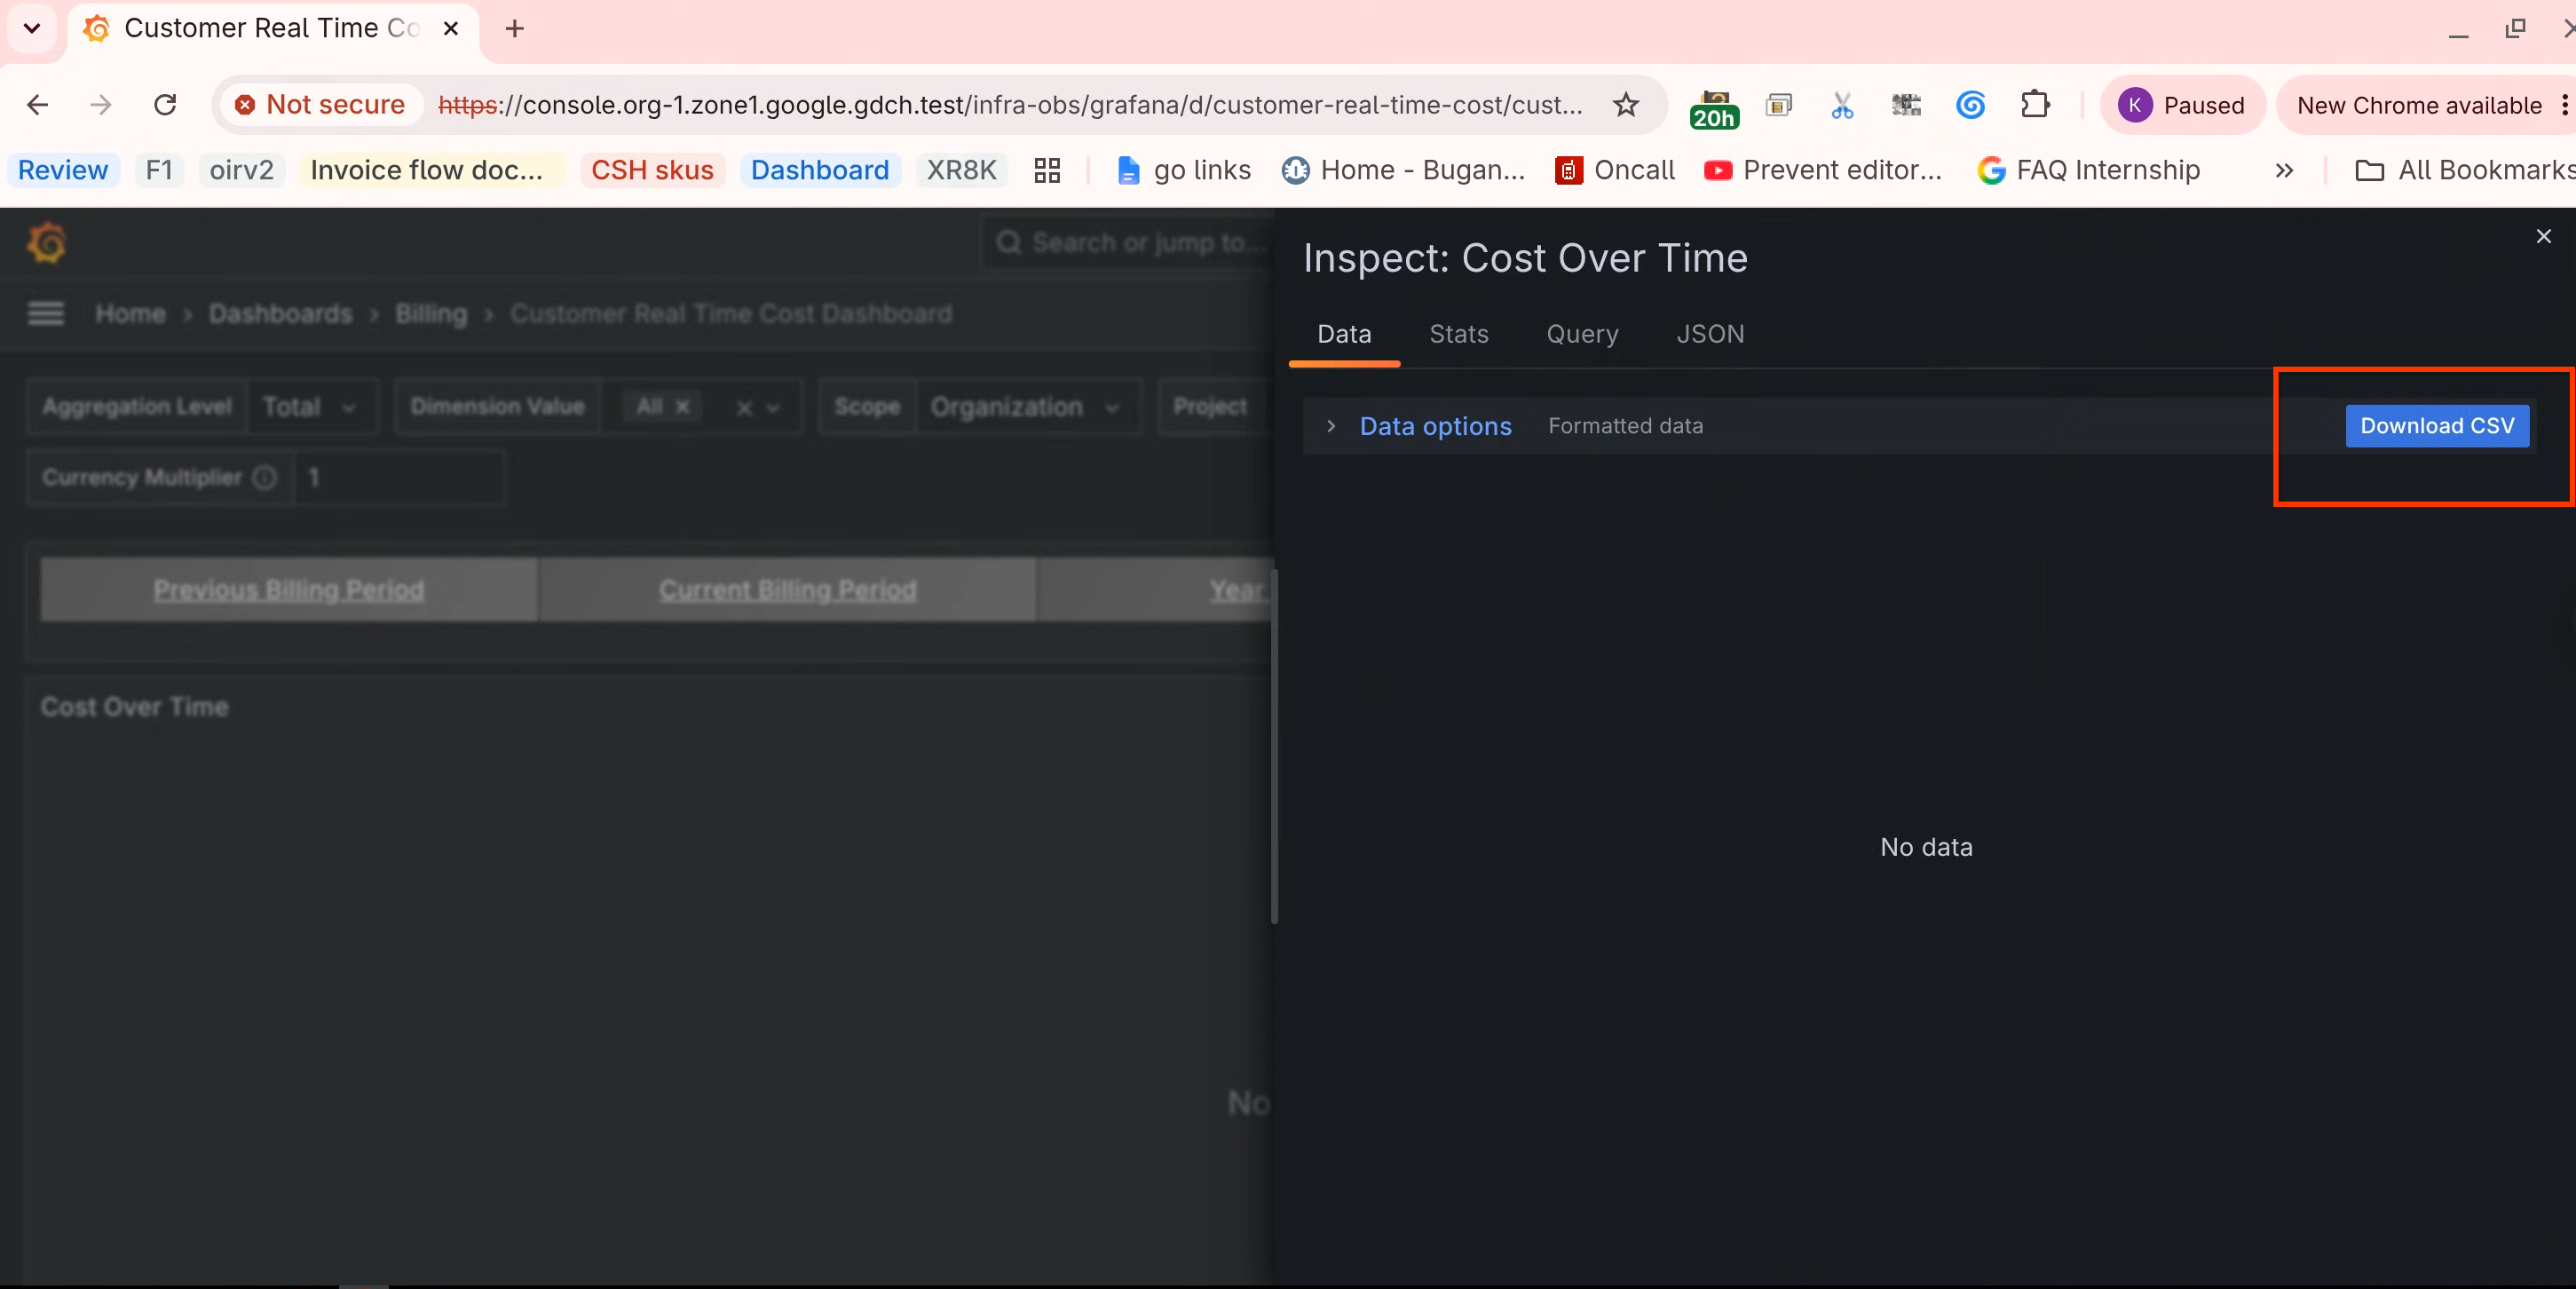
You can download the underlying data from any line graph panel to a comma-separated values (CSV) file for external analysis. To download the data through Grafana, work through the following steps:
- Hover over the title of the line graph panel you want to export, and click the ⋮ icon.
- In the drop-down menu, select Inspect > Data. The data inspection drawer opens.
In the data inspection drawer, click Download CSV. The CSV file downloads to your local system.