

This document provides an overview of the Google Distributed Cloud (GDC) air-gapped VM dashboard and the type of information made available by the different graphs. To learn more about monitoring, visualization, and how to configure alerts, see the following supplemental pages:
- Observability monitoring and visualizing for detailed information about collecting metrics, viewing metrics, and managing your dashboards.
- Alerting for information about, for example, alerts and creating alert rules.
The VM-level metrics dashboard provides you with graphs for viewing VM-specific metrics for your projects. Access the dashboard from this address:
https://GDC_HOST/PROJECT/grafana/d/vm-metrics/workload-vms
- Replace GDC_HOST with your hostname.
- Replace PROJECT with the name of your project.
This document is for developers in platform administrator or application operator groups that monitor VM metrics using dashboards in a Distributed Cloud environment. For more information, see Audiences for GDC air-gapped documentation.
Before you begin
Request IAM roles
To monitor VM metrics with dashboards, contact your Project IAM Admin to request the appropriate monitoring role. Review the list of project-level predefined roles for monitoring resources for more information.
All roles must bind to the namespace of the project where the VM resides.
VM dashboard
The VM dashboard presents graphs that contain information regarding the following for each VM in each of your project namespaces:
These graph types are generated using the VM monitoring metrics. The metrics are named and described according to their type, labels, and meanings.
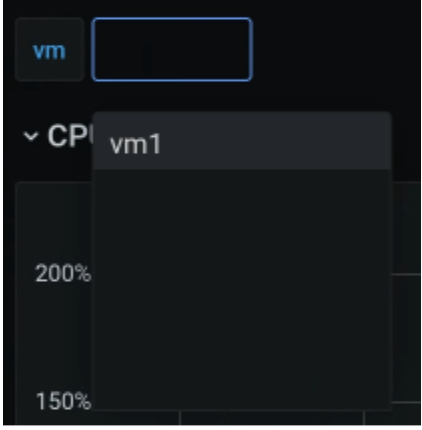
In the dashboard view, from the selection box at the beginning of the page, which is marked in the following image as "vm", choose the VM you want to observe. The image shows that vm1 was selected.
CPU
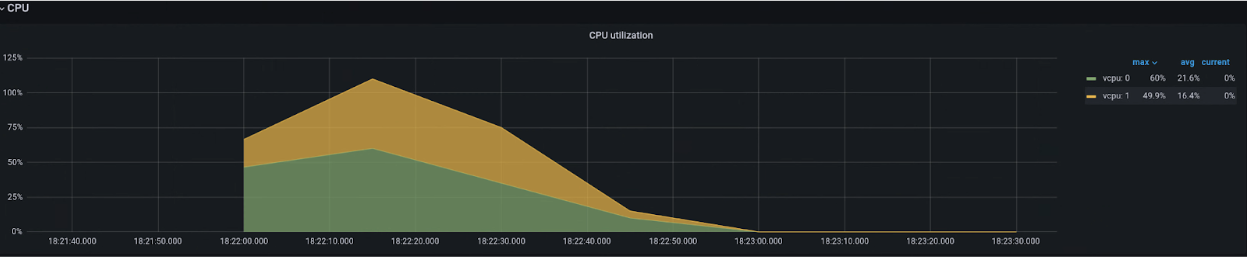
View the CPU utilization - the amount of time that each vCPU spends in different states. The graph displays information for each of the vCPUs specified by your machine type.
Memory
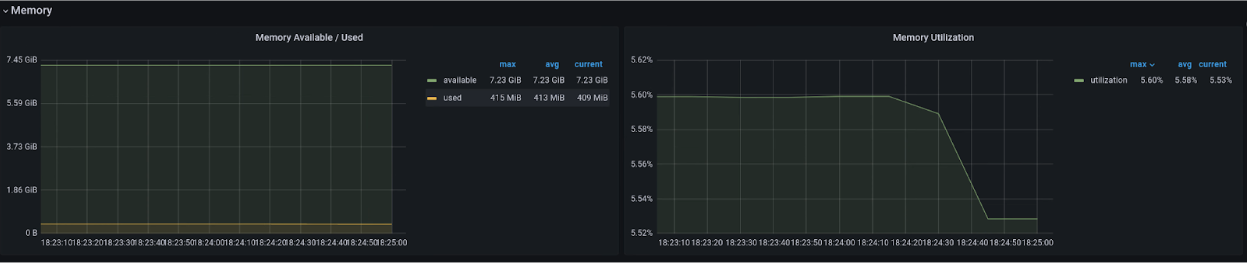
From the memory graph, view attributes like the total memory allocated to the VM, the amount of memory available, and the amount of memory your instances use.
Network
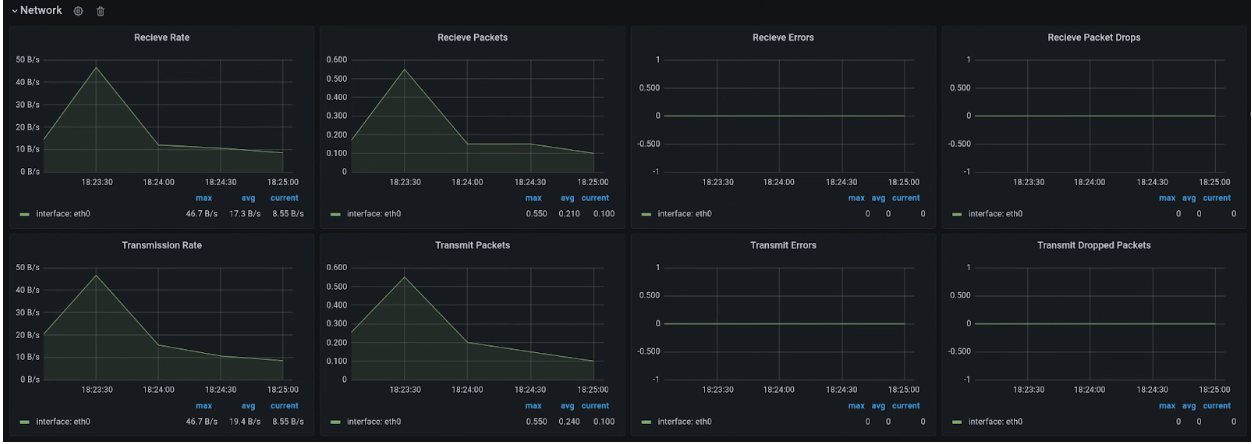
Use the Network page to view the following:
- The number of packets received from and sent to the network.
- The quantity of bytes received from and sent to the network.
- The number of receive and transmit packets that have been dropped on virtual network interface card (vNIC) interfaces.
- The network transmit error packet count.
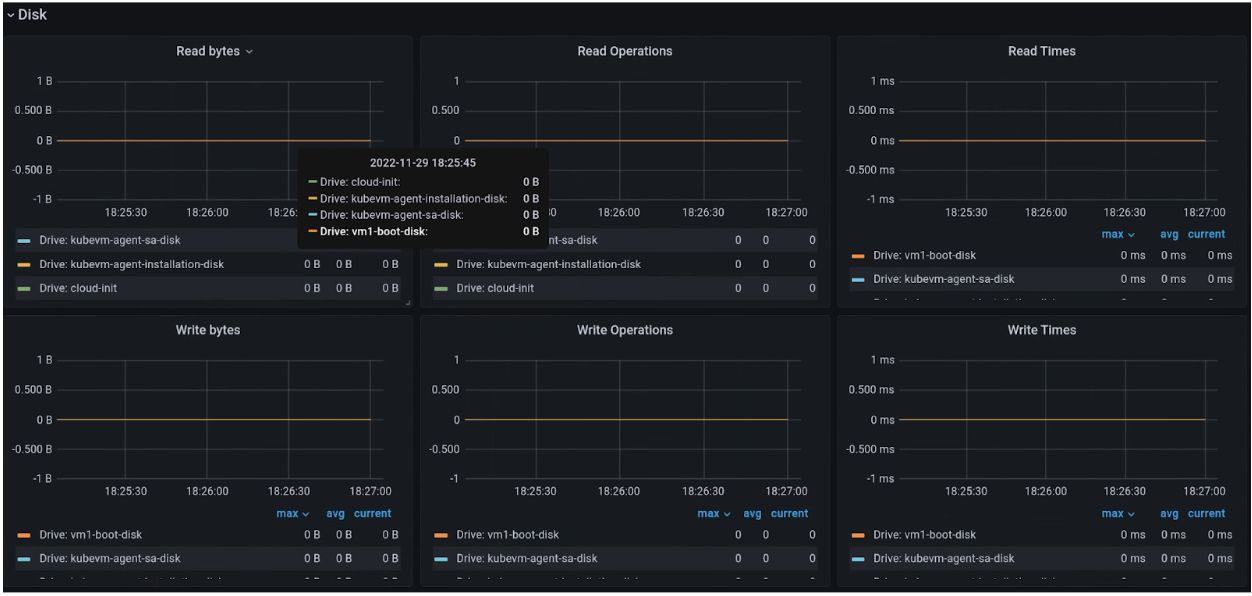
Disk
View the Disk page to see the following:
- A bytes count for reads from or writes to a disk
- A count of write or read IO operations.
- The cumulative time taken for a read or write operation:
- The time the operation is in queue
- The time spent actually executing the operation (disk busy)
- Disk flush request numbers, and the time spent on cache flushing.
Metrics list
To view a list of metrics definitions, see Virtual Machine Management (VMM) .