

Training clusters runs automated health checks on your nodes and intervenes when a check fails. For example, upon identifying a fatal XID error, it may drain the node, requeue the affected Slurm job, and recreate the node. Each of these interventions is written to your project's logs as a resilience event.
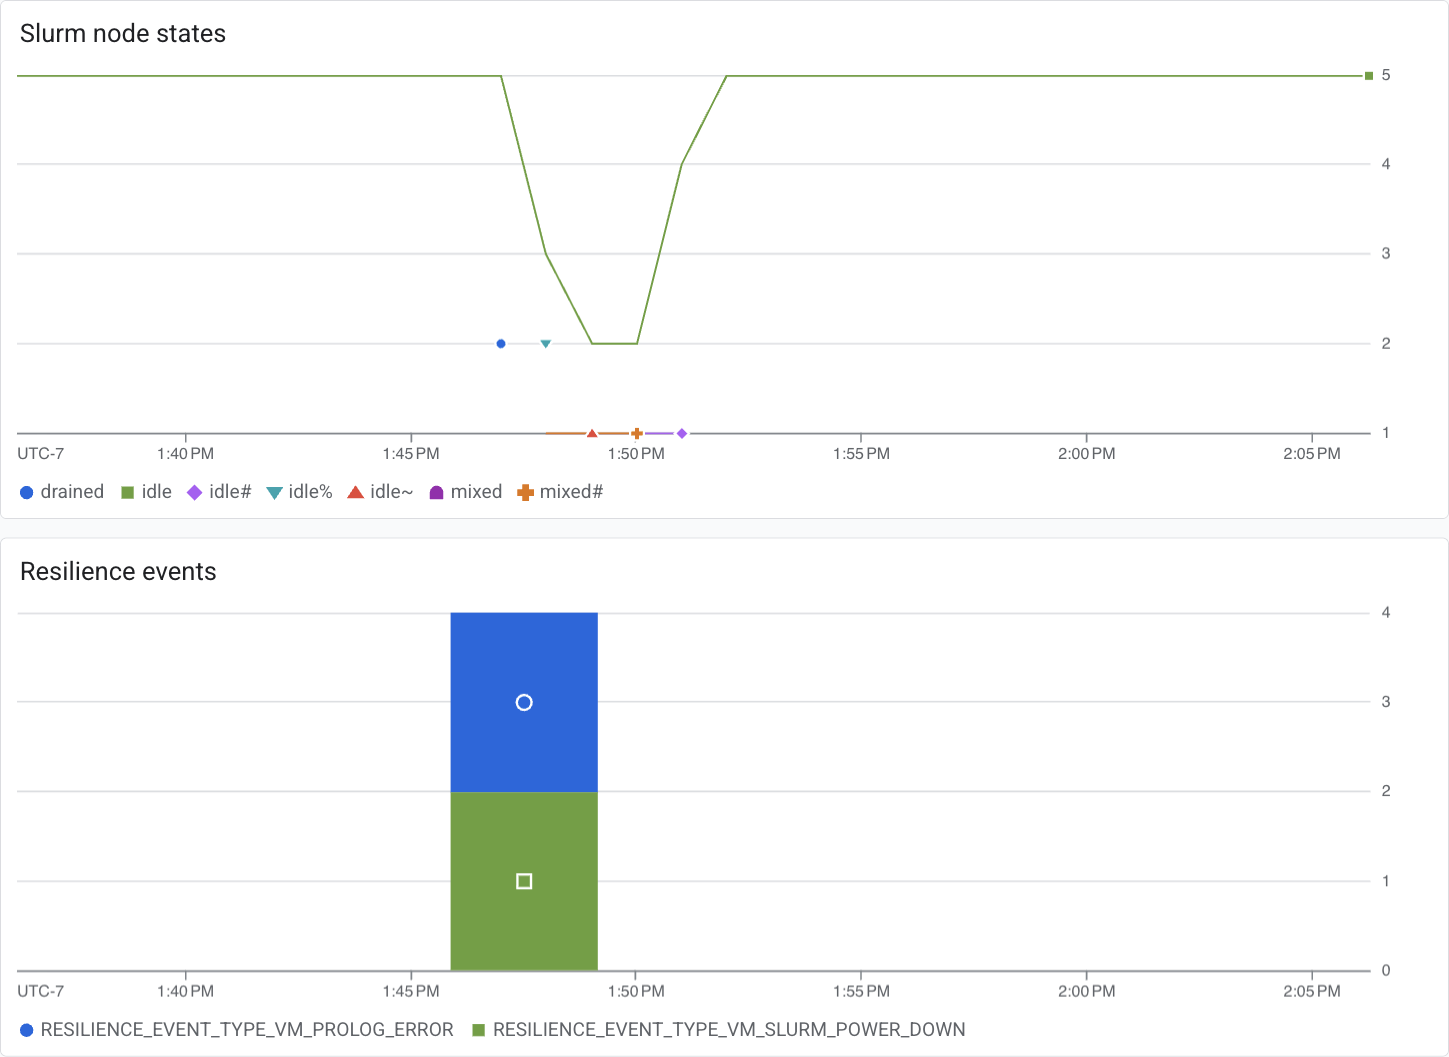
This page shows you how to build a custom Cloud Monitoring dashboard that charts those resilience events next to the Slurm state of your compute nodes, so that you can see which recovery actions the service took and how they correlate with the state of your cluster. The dashboard has two charts:
- Slurm node states: the number of nodes in each Slurm state over time,
taken from the
hypercomputecluster.googleapis.com/slurm/node_statemetric. - Resilience events: a count of resilience events, broken down by event type, taken from a log-based metric that you create in the next section.
Before you begin
Install and initialize the Google Cloud CLI, then set the project that contains your training clusters:
gcloud auth login
gcloud config set project PROJECT_ID
Replace PROJECT_ID with the ID of your project.
Required roles
To get the permissions that you need to create the log-based metric and the dashboard, ask your administrator to grant you the following IAM roles on the project:
-
Create the log-based metric:
Logs Configuration Writer (
roles/logging.configWriter) -
Create the dashboard:
Monitoring Dashboard Configuration Editor (
roles/monitoring.dashboardEditor)
For more information about granting roles, see Manage access to projects, folders, and organizations.
These predefined roles contain the permissions required to create the log-based metric and the dashboard. To see the exact permissions that are required, expand the Required permissions section:
Required permissions
The following permissions are required to create the log-based metric and the dashboard:
-
Create the log-based metric:
logging.logMetrics.create -
Create the dashboard:
monitoring.dashboards.create
You might also be able to get these permissions with custom roles or other predefined roles.
Create the log-based metric
Resilience events are recorded in your project's logs, where each event carries
an event_type label prefixed with RESILIENCE_EVENT_TYPE_. To see the raw
events in the Logs Explorer, use the following query:
labels.event_type=~"RESILIENCE_EVENT_TYPE_.*"
Cloud Monitoring can't chart log entries directly, so you first turn this query into a log-based metric.
Save the following configuration to a file named
resilience_metric.yaml:name: training_cluster_resilience_events description: "Resilience events on training cluster nodes (VM instances)." filter: 'resource.type="gce_instance" AND labels.event_type=~"RESILIENCE_EVENT_TYPE_.*"' metricDescriptor: metricKind: DELTA valueType: INT64 unit: "1" labels: - key: cluster_id valueType: STRING description: "The ID of the training cluster." - key: event_type valueType: STRING description: "The type of resilience event." - key: slurm_job_name valueType: STRING description: "The name of the Slurm job that triggered the resilience event, if applicable." - key: slurm_job_id valueType: STRING description: "The ID of the Slurm job that triggered the resilience event, if applicable." - key: slurm_job_partition valueType: STRING description: "The partition that the resilience event acts on." labelExtractors: cluster_id: "EXTRACT(labels.cluster_id)" event_type: "EXTRACT(labels.event_type)" slurm_job_name: "EXTRACT(labels.slurm_job_name)" slurm_job_id: "EXTRACT(labels.slurm_job_id)" slurm_job_partition: "EXTRACT(labels.slurm_job_partition)"The
labelExtractorsfield copies the labels of each log entry onto the metric, which lets you break the chart down by event type, by cluster, or by Slurm job.Create the metric:
gcloud logging metrics create training_cluster_resilience_events \
    --config-from-file=resilience_metric.yaml
Verify that the metric exists:
gcloud logging metrics describe training_cluster_resilience_eventsYou can also confirm the metric in the Google Cloud console on the Log-based metrics page.
Create the dashboard
Save the following configuration to a file named
resilience_dashboard.json:{ "displayName": "Training Clusters Resilience Dashboard", "mosaicLayout": { "columns": 48, "tiles": [ { "height": 16, "width": 24, "widget": { "title": "Slurm node states", "xyChart": { "chartOptions": { "mode": "COLOR" }, "dataSets": [ { "minAlignmentPeriod": "60s", "plotType": "LINE", "targetAxis": "Y1", "timeSeriesQuery": { "timeSeriesFilter": { "aggregation": { "alignmentPeriod": "60s", "crossSeriesReducer": "REDUCE_SUM", "groupByFields": [ "metric.label.\"state\"" ], "perSeriesAligner": "ALIGN_MEAN" }, "filter": "metric.type=\"hypercomputecluster.googleapis.com/slurm/node_state\" resource.type=\"gce_instance\"" } } } ], "yAxis": { "scale": "LINEAR" } } } }, { "yPos": 16, "height": 16, "width": 24, "widget": { "title": "Resilience events", "xyChart": { "chartOptions": { "mode": "COLOR" }, "dataSets": [ { "minAlignmentPeriod": "60s", "plotType": "STACKED_BAR", "targetAxis": "Y1", "timeSeriesQuery": { "timeSeriesFilter": { "aggregation": { "alignmentPeriod": "60s", "crossSeriesReducer": "REDUCE_COUNT", "groupByFields": [ "metric.label.\"event_type\"" ], "perSeriesAligner": "ALIGN_COUNT" }, "filter": "metric.type=\"logging.googleapis.com/user/training_cluster_resilience_events\" resource.type=\"gce_instance\"" } } } ], "yAxis": { "scale": "LINEAR" } } } } ] } }If you gave the log-based metric a different name in the previous section, change the
logging.googleapis.com/user/filter to match.Create the dashboard:
gcloud monitoring dashboards create \
    --config-from-file=resilience_dashboard.json
In the Google Cloud console, go to the Dashboards page, and then, under My Dashboards, open Training Clusters Resilience Dashboard. The dashboard can take about a minute to appear.
Troubleshooting
The following sections describe the problems you're most likely to hit after creating the metric and the dashboard.
The "Resilience events" chart is empty
A log-based metric isn't backfilled. It only counts log entries that arrive after you create the metric. As the log-based metrics overview explains, a metric isn't retroactively populated with data from log entries that are already in Cloud Logging.
If resilience events have occurred since you created the metric and the chart is still empty, confirm that the events are present in the Logs Explorer by running the query in Create the log-based metric.
The "Slurm node states" chart is missing some clusters
The hypercomputecluster.googleapis.com/slurm/node_state metric is reported
only by clusters running a recent enough version of the cluster software. If a
cluster is missing from the chart,
update the cluster
and then check the chart again.
The "Slurm node states" chart doesn't show login nodes
This is expected. Login nodes don't have a Slurm state, such as idle or
mixed, so they don't report the slurm/node_state metric.
The "Resilience events" chart overcounts events
Cloud Logging processes each log entry at least once, so a transient internal error can cause an entry to be counted more than once. For more information, see Troubleshoot log-based metrics.
The log entries themselves are the source of truth. To get an exact count for a time range, query the events in the Logs Explorer instead of reading them off the chart.
What's next
- Learn how cluster resiliency works
- View the prebuilt observability dashboards for a cluster
- Monitor training jobs on Gemini Enterprise Agent Platform