


總覽
本指南將說明如何在 Google Distributed Cloud (GDC) 的無網路共用叢集上,完整部署 Elastic Stack (Elasticsearch 和 Kibana),並示範如何與大型語言模型 (LLM) 服務整合,評估 Elastic 的生成式 AI 功能。
部署作業會使用 GDC 實體隔離方案市集提供的官方 Elastic Cloud on Kubernetes (ECK) 運算子。運算子會安裝到共用 Kubernetes 叢集上的專案命名空間,並自動佈建及管理 Elasticsearch 和 Kibana 資源的生命週期。部署完成後,Kibana 會連線至 LLM 推論端點 (例如 GDC 上的代管 Gemini,或 Ollama 或 vLLM 等自行管理的 OpenAI 相容服務)。這項整合功能可支援 Elastic 的生成式 AI 功能,包括 Elastic AI 代理、使用 Agent Builder 建構的自訂代理,以及 Attack Discovery。
本指南適用於 Elastic v9.4.0、Elastic Kubernetes Operator v3.4.0 和 GDC v1.16.2。如果您使用不同版本,部分操作說明可能會略有不同。
架構
這個架構包含 Elastic Stack 部署項目,由 GDC 共用使用者叢集內專案命名空間中的 ECK 運算子管理。Kibana 會透過內部 GDC 網路與 LLM 推論端點通訊。
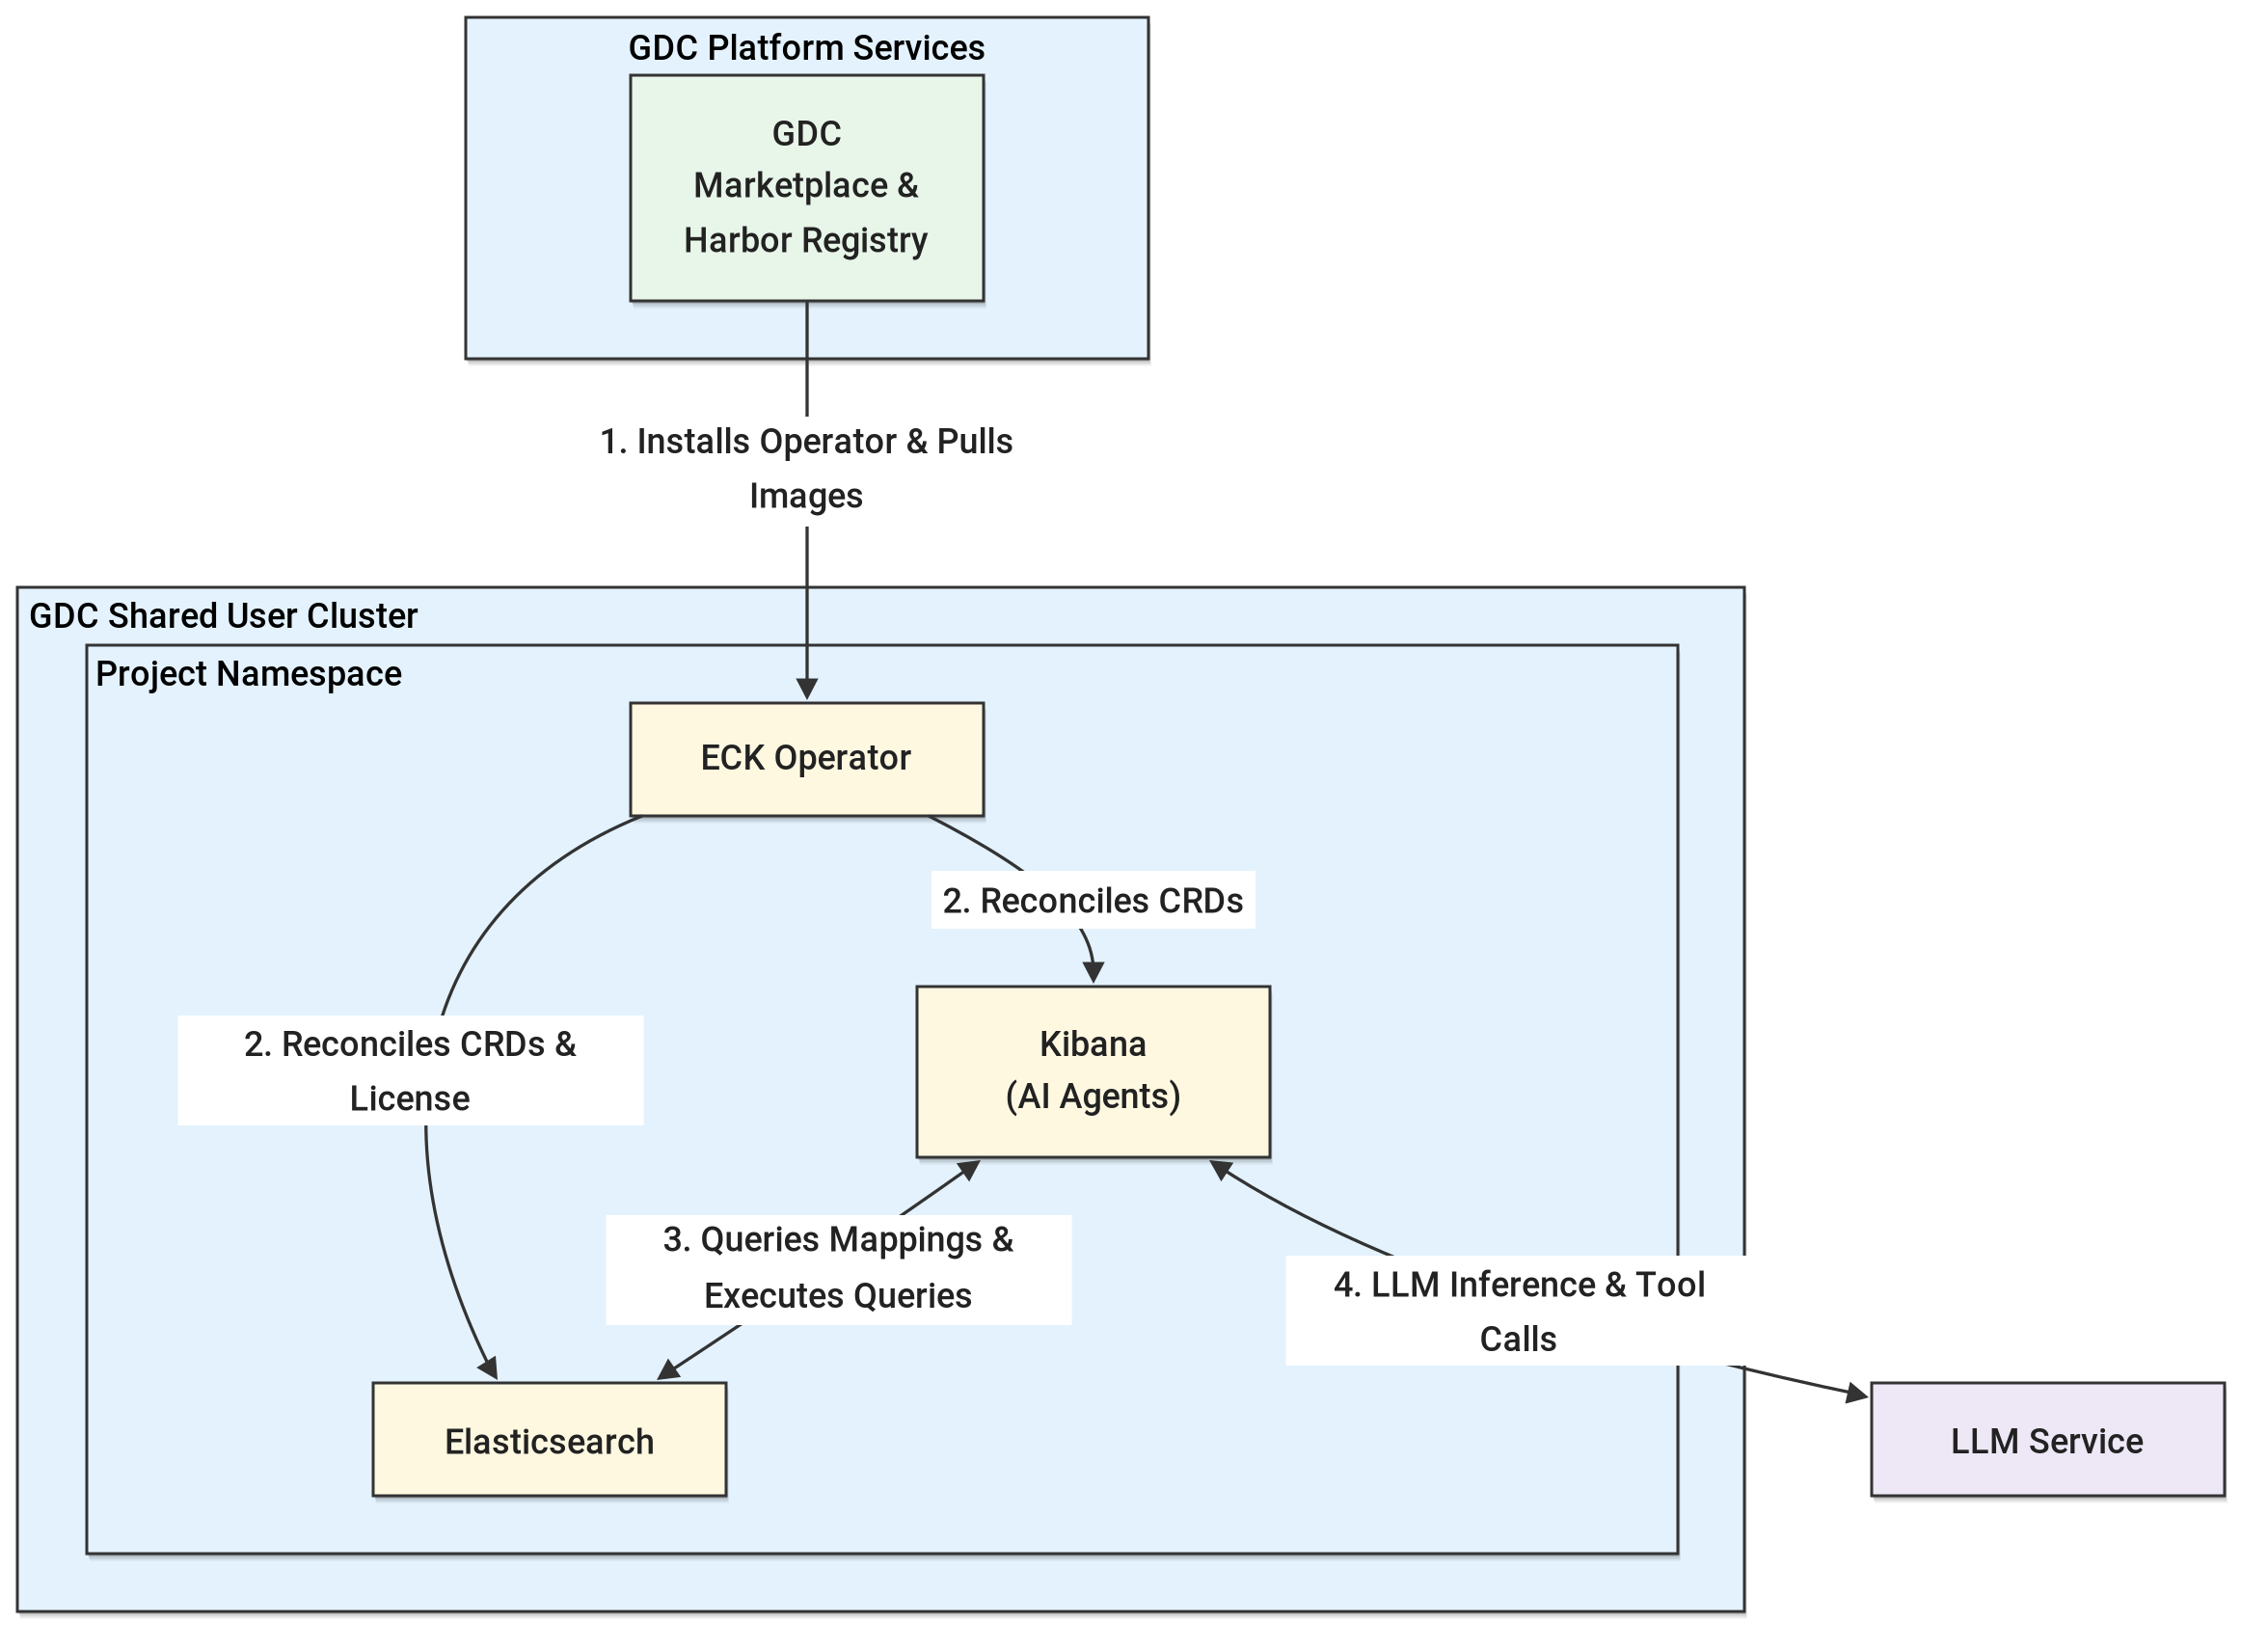
這項架構的主要元件包括:
- GDC 共用叢集:組織範圍的共用 Kubernetes 叢集,連結至多項專案,託管 GDC Marketplace 軟體套件和應用程式工作負載。
- GDC 專案:共用叢集上的專案命名空間,可隔離 ECK 運算子、Elasticsearch 叢集、Kibana 執行個體,以及相關聯的 Kubernetes Secret 和 NetworkPolicy。
- Kubernetes 上的 Elastic Cloud (ECK) 操作器:從 GDC Marketplace 安裝至專案命名空間後,操作器會管理
Elasticsearch和Kibana自訂資源,並調解生成式 AI 功能和外部 LLM 連接器所需的 Elastic 授權。 - Elasticsearch:儲存作業和安全性資料並建立索引,以及執行 Kibana AI 功能和代理程式產生的搜尋和 ES|QL 查詢。
- Kibana:託管 Elastic 的生成式 AI 功能,包括 Elastic AI 代理 (用於自然語言記錄調查和 ES|QL 生成)、Agent Builder (用於在 Elasticsearch 資料上建構自訂對話式代理和工具),以及 Attack Discovery (用於安全性警示關聯和攻擊鏈分析)。Kibana 也會管理 LLM 動作連接器,在使用者、Elasticsearch 和 LLM 服務之間,自動調度管理多步驟工具呼叫。
- LLM 服務:代管 LLM 服務 (例如 Gemini on GDC) 或自行管理的推論伺服器 (例如 Ollama 或 vLLM),可透過內部 GDC 網路為 Kibana 提供對話完成和工具呼叫功能。
事前準備
開始部署前,請確認 GDC 環境符合下列必要條件和假設:
- 共用 Kubernetes 叢集和 GDC 專案:您可以存取現有的 GDC共用叢集,以及附加至該叢集的 GDC專案。本指南中部署的所有 Kubernetes 資源,都會以專案做為命名空間容器。確認叢集有足夠的運算和永久儲存空間資源,可託管 ECK 運算子、Elasticsearch 和 Kibana 工作負載。
- LLM 服務:您可以透過網路存取 LLM 服務,包括受管理的 Gemini 服務 (如果 GDC 環境提供這項服務),或是自行管理的 OpenAI 相容 LLM 服務 (例如透過 GPU 專案中的 Ollama 或 vLLM
gemma4:31b提供服務)。部署 LLM 基礎架構本身不在本指南的討論範圍內,但特定模型和 API 需求會在「LLM 服務需求」中詳細說明。 擷取 GDC 環境隨附的 Elastic 版本:
export ELASTIC_VERSION=$(curl -sk "https://harbor.${ORG}.${ZONE}.${GDCH_DOMAIN}/api/v2.0/projects/library/repositories/elasticsearch%252Felasticsearch/artifacts" | jq -r '[.[].tags[]?.name] | sort_by(split(".") | map(tonumber)) | last')設定本指南中會參照的環境變數。視需要修改這些值,以符合特定環境:
# GDC environment configuration
export PROJECT_ID="your-project-id"
export CLUSTER_NAME="your-shared-cluster-name"
export ZONE="your-zone-name"
export USER_NAME="your-gdc-user-email"

# Marketplace package and Elastic Stack configuration
export MARKETPLACE_SERVICE_NAME="elastic"

# LLM service configuration
export LLM_CONNECTOR_NAME="your-llm-connector-name"
export LLM_API_URL="http://your-llm-service-host:11434/v1/chat/completions"
export LLM_MODEL_NAME="your-llm-model-name"
export LLM_API_KEY="your-llm-api-key"
設定
gdcloud:gdcloud config set project ${PROJECT_ID} gdcloud config set core/zone ${ZONE}在目標 GDC 專案 (
${PROJECT_ID}) 中,為使用者要求或繫結必要的專案層級 IAM 角色。根據 GDC Marketplace 生命週期說明文件和 GDC 網路需求,至少需要下列專案角色:- 命名空間管理員 (
namespace-admin):具備完整管理權限,可在共用叢集的專案命名空間中,建立及管理 Kubernetes 工作負載、Secret、服務和自訂資源。 - 專案檢視者 (
project-viewer):讀取權限,可在 GDC 控制台和 CLI 中查看現有專案及其資源。 - Marketplace 編輯者 (
marketplace-editor):可在專案中安裝、升級及解除安裝 GDC Marketplace 軟體套件。 - 專案 NetworkPolicy 管理員 (
project-networkpolicy-admin): 設定全域ProjectNetworkPolicy規則的權限,允許跨專案和外部流量連線至 Kibana 和 Elasticsearch LoadBalancer 服務。
請要求組織 IAM 管理員或專案 IAM 管理員授予這些角色 (如果您具備 IAM 管理員權限,則可執行下列指令):
gdcloud projects add-iam-policy-binding ${PROJECT_ID} \ --member="user:${USER_NAME}" \ --role=namespace-admin gdcloud projects add-iam-policy-binding ${PROJECT_ID} \ --member="user:${USER_NAME}" \ --role=project-viewer gdcloud projects add-iam-policy-binding ${PROJECT_ID} \ --member="user:${USER_NAME}" \ --role=marketplace-editor gdcloud projects add-iam-policy-binding ${PROJECT_ID} \ --member="user:${USER_NAME}" \ --role=project-networkpolicy-admin- 命名空間管理員 (
擷取共用叢集的 kubeconfig,並為
kubectl設定ku殼層別名:KUBECONFIG=kubeconfig-${CLUSTER_NAME}.yaml gdcloud clusters \ get-credentials ${CLUSTER_NAME} \ --zone ${ZONE} alias ku="kubectl --kubeconfig=kubeconfig-${CLUSTER_NAME}.yaml"
安裝 Elastic Marketplace 套件
在本節中,您將按照 GDC Marketplace 生命週期指南,從 GDC 實體隔離方案 Marketplace 將 Elastic Cloud on Kubernetes (ECK) 運算子安裝到專案命名空間。
透過 gdcloud CLI (或 GDC 控制台) 安裝
列出可用的 Marketplace 軟體套件,確認服務名稱和可用版本:
gdcloud marketplace services list輸出內容應如下所示:
SERVICE      LATEST VERSION
confluent    <CONFLUENT_VERSION>
dataproc     <DATAPROC_VERSION>
elastic      <ECK_OPERATOR_VERSION>
mariadb      <MARIADB_VERSION>
mattermost   <MATTERMOST_VERSION>
mongodb      <MONGODB_VERSION>
neo4j        <NEO4J_VERSION>
redis        <REDIS_VERSION>
starboard    <STARBOARD_VERSION>
starburst    <STARBURST_VERSION>
tes          <TES_VERSION>
vault        <VAULT_VERSION>
將 Elastic 市集套裝方案安裝到目標共用叢集:
gdcloud marketplace services install ${MARKETPLACE_SERVICE_NAME} \
  --cluster=${CLUSTER_NAME} \
  --zone=${ZONE} \
  --project ${PROJECT_ID}
*(或者,您也可以在 GDC 控制台中選取專案
${PROJECT_ID},前往「Marketplace」,選取「Elastic Cloud on Kubernetes」產品,依序點選「Install」(安裝)、選取叢集${CLUSTER_NAME},然後點選「Install」(安裝)。)*確認
elastic-operatorStatefulSet 和 Pod 在專案命名空間 (${PROJECT_ID}) 中執行:ku get statefulset,pods -n ${PROJECT_ID}輸出內容大致如下:
NAME                                READY   AGE
statefulset.apps/elastic-operator   1/1     3m

NAME                   READY   STATUS    RESTARTS   AGE
pod/elastic-operator-0 1/1     Running   0          3m
部署 Elastic Stack
建立 Elastic Stack 資訊清單
GDC 市集套裝方案會部署 ECK operator,並預先設定為從本機實體隔離的 Harbor 登錄檔提取 Elasticsearch 和 Kibana 容器映像檔。
建立 elastic-stack.yaml,在專案命名空間 (${PROJECT_ID}) 中部署 1 節點 Elasticsearch 叢集、Kibana UI 執行個體、LoadBalancer HTTP 服務和 allow-all NetworkPolicy。資訊清單也包含由 ECK 運算子調解的授權 Secret,在此設定為 30 天的 Enterprise 試用版 (eck-trial-license),以防您尚未擁有自己的 Enterprise 授權:
cat <<EOF > elastic-stack.yaml
apiVersion: v1
kind: Secret
metadata:
  name: eck-trial-license
  namespace: ${PROJECT_ID}
  labels:
    license.k8s.elastic.co/type: enterprise_trial
  annotations:
    elastic.co/eula: accepted
---
apiVersion: elasticsearch.k8s.elastic.co/v1
kind: Elasticsearch
metadata:
  name: elastic-cluster
  namespace: ${PROJECT_ID}
spec:
  version: ${ELASTIC_VERSION}
  http:
    service:
      spec:
        type: LoadBalancer
  nodeSets:
    - name: default
      count: 1
      config:
        # Disable mmap to avoid requiring privileged host sysctl modifications
        node.store.allow_mmap: false
      podTemplate:
        spec:
          initContainers:
            - name: sysctl
              securityContext:
                privileged: false
                allowPrivilegeEscalation: false
                runAsNonRoot: true
                capabilities:
                  drop:
                    - ALL
              command: ["sh", "-c", "true"]
          containers:
            - name: elasticsearch
              resources:
                requests:
                  memory: 2Gi
                  cpu: 500m
                limits:
                  memory: 4Gi
                  cpu: 2
      volumeClaimTemplates:
        - metadata:
            name: elasticsearch-data
          spec:
            accessModes:
              - ReadWriteOnce
            resources:
              requests:
                storage: 10Gi
---
apiVersion: kibana.k8s.elastic.co/v1
kind: Kibana
metadata:
  name: kibana-ui
  namespace: ${PROJECT_ID}
spec:
  version: ${ELASTIC_VERSION}
  count: 1
  elasticsearchRef:
    name: elastic-cluster
  http:
    service:
      spec:
        type: LoadBalancer
  podTemplate:
    spec:
      containers:
        - name: kibana
          resources:
            requests:
              memory: 1Gi
              cpu: 200m
            limits:
              memory: 2Gi
              cpu: 1
---
apiVersion: networking.k8s.io/v1
kind: NetworkPolicy
metadata:
  name: allow-all
  namespace: ${PROJECT_ID}
spec:
  podSelector: {}
  policyTypes:
    - Ingress
  ingress:
    - from:
        - ipBlock:
            cidr: 0.0.0.0/0
EOF
套用並驗證部署作業
套用資訊清單:
ku apply -f elastic-stack.yaml
套用全域 ProjectNetworkPolicy,讓 GDC 防火牆規則允許傳入 LoadBalancer IP 的流量,以及跨專案流量 (例如與 LLM 服務通訊):
kubectl --kubeconfig=kubeconfig-global.yaml apply -f - <<EOF
apiVersion: networking.global.gdc.goog/v1
kind: ProjectNetworkPolicy
metadata:
  namespace: ${PROJECT_ID}
  name: allow-inbound-traffic-from-external
spec:
  policyType: Ingress
  subject:
    subjectType: UserWorkload
  ingress:
    - from:
        - ipBlock:
            cidr: 0.0.0.0/0
---
apiVersion: networking.global.gdc.goog/v1
kind: ProjectNetworkPolicy
metadata:
  namespace: ${PROJECT_ID}
  name: allow-inbound-traffic-from-all-projects
spec:
  policyType: Ingress
  subject:
    subjectType: UserWorkload
  ingress:
    - from:
        - projects: {}
EOF
監控 Pod、服務和自訂資源,直到 Elasticsearch 和 Kibana 都達到 Running 和 Ready 狀態,並在 ${CLUSTER_NAME} 上取得 LoadBalancer IP:
ku get pods,svc,elasticsearch,kibana -n ${PROJECT_ID}
資源準備就緒後,輸出內容應如下所示:
NAME                                READY   STATUS    RESTARTS   AGE
pod/elastic-cluster-es-default-0    1/1     Running   0          3m
pod/elastic-operator-0              1/1     Running   0          15m
pod/kibana-ui-kb-869844478d-59ptw   1/1     Running   0          3m

NAME                                                                      TYPE           CLUSTER-IP      EXTERNAL-IP    PORT(S)          AGE
service/elastic-cluster-es-default                                        ClusterIP      None            <none>         9200/TCP         11m
service/elastic-cluster-es-http                                           LoadBalancer   10.101.18.181   <ELASTIC_EXTERNAL_IP>   9200:32159/TCP   11m
service/elastic-cluster-es-internal-http                                  ClusterIP      10.101.18.81    <none>         9200/TCP         11m
service/elastic-cluster-es-transport                                      ClusterIP      None            <none>         9300/TCP         11m
service/g-svc-g-fre-elastic-cluster-es-http-shared-clus-extern-56d5eb67   ClusterIP      None            <none>         9200/TCP         11m
service/g-svc-g-fre-kibana-ui-kb-http-shared-cluster-0b-extern-75a78b1f   ClusterIP      None            <none>         5601/TCP         11m
service/kibana-ui-kb-http                                                 LoadBalancer   10.101.19.86    <KIBANA_EXTERNAL_IP>   5601:32735/TCP   11m

NAME                                                         HEALTH   NODES   VERSION             PHASE   AGE
elasticsearch.elasticsearch.k8s.elastic.co/elastic-cluster   green    1       <ELASTIC_VERSION>   Ready   3m

NAME                                     HEALTH   NODES   VERSION             AGE
kibana.kibana.k8s.elastic.co/kibana-ui   green    1       <ELASTIC_VERSION>   3m
匯出指派給 Elasticsearch 和 Kibana 的外部 LoadBalancer IP,以便在後續步驟中使用:
export ELASTICSEARCH_IP=$(ku get svc elastic-cluster-es-http \
  -n ${PROJECT_ID} \
  -o jsonpath='{.status.loadBalancer.ingress[0].ip}')

export KIBANA_IP=$(ku get svc kibana-ui-kb-http \
  -n ${PROJECT_ID} \
  -o jsonpath='{.status.loadBalancer.ingress[0].ip}')

echo "Kibana External URL:        https://${KIBANA_IP}:5601"
echo "Elasticsearch External URL: https://${ELASTICSEARCH_IP}:9200"
擷取憑證並存取 Kibana UI
擷取 elastic 超級使用者密碼
ECK 會自動產生 Kubernetes Secret
(elastic-cluster-es-elastic-user),其中包含預設的elastic超級使用者
密碼。使用下列指令擷取並解碼:
export ELASTIC_PASSWORD=$(ku get secret elastic-cluster-es-elastic-user \
  -n ${PROJECT_ID} \
  -o jsonpath='{.data.elastic}' | base64 -d)
echo "${ELASTIC_PASSWORD}"
確認連線並登入
確認可從工作站透過 HTTPS 連上 Elasticsearch:
curl -sk -u "elastic:${ELASTIC_PASSWORD}" "https://${ELASTICSEARCH_IP}:9200"在瀏覽器中開啟
https://${KIBANA_IP}:5601,接受自行簽署的憑證警告,然後使用下列資訊登入:- 使用者名稱:
elastic - 密碼:
<output from ELASTIC_PASSWORD above>
- 使用者名稱:
驗證 Elastic 授權
Elastic 的生成式 AI 功能 (包括 Elastic AI 代理、Agent Builder 和 Attack Discovery) 和外部 LLM 連接器需要企業版授權 (或有效的 30 天企業版試用授權)。
當 Elasticsearch 叢集由 ECK 運算子管理時,ECK 的 license-controller 會持續比對叢集授權與運算子命名空間 (${PROJECT_ID}) 中的 Kubernetes Secret。如果您尚未取得正式版 Enterprise 授權,elastic-stack.yaml (license.k8s.elastic.co/type:
enterprise_trial) 中包含的 eck-trial-license Secret 會指示 ECK 自動佈建及維護 30 天的 Enterprise 試用授權。(請注意,如果透過 POST
/_license/start_trial 手動開始試用,但沒有 ECK 授權 Secret,ECK 會在下一個協調週期將叢集還原為 basic)。
如要透過 CLI 驗證有效授權,請按照下列步驟操作:
curl -sk -u "elastic:${ELASTIC_PASSWORD}" \
  "https://${ELASTICSEARCH_IP}:9200/_license" | jq .
*(或者,在 Kibana 中開啟導覽選單,依序前往「Management」(管理) >「Dev Tools」(開發人員工具),然後在「Console」(控制台) 分頁中執行 GET /_license。)*
輸出內容應與下方類似,顯示 "status": "active" 和 "type": "enterprise" (如果使用試用授權,則為 "type": "trial"):
{
  "license": {
    "status": "active",
    "uid": "d8c2b566-8c2b-436c-a1ea-5502d6790505",
    "type": "trial",
    "issue_date": "2026-09-17T23:19:25.053Z",
    "issue_date_in_millis": 1789687165053,
    "expiry_date": "2026-10-17T23:19:25.053Z",
    "expiry_date_in_millis": 1792279165053,
    "max_nodes": 1000,
    "max_resource_units": null,
    "issued_to": "elastic-cluster",
    "issuer": "elasticsearch",
    "start_date_in_millis": -1
  }
}
載入內建範例資料集
如要評估 Elastic 的 AI 功能,但不想編寫自訂資料擷取管道,或需要外部網際網路存取權,可以載入 Kibana 內建的網頁記錄範例資料集 (kibana_sample_data_logs)。由於範例資料封存檔已隨附於 Kibana 容器映像檔中,因此在實體隔離環境中,幾秒內就能完成安裝。資料集會填入 14,074 筆網站存取記錄文件,其中包含用戶端 IP 位址 (clientip)、HTTP 狀態碼 (response)、來源和目的地國家/地區 (geo.src、geo.dest)、傳輸的位元組 (bytes)、網址和使用者代理程式字串。
如需其他內建資料集 (flights 和 ecommerce),請參閱「在 Kibana 中新增範例資料」和「elastic-datasets-builtin.md」。
載入資料集
執行下列指令,透過 Kibana 的內部範例資料端點載入 kibana_sample_data_logs:
curl -sk -u "elastic:${ELASTIC_PASSWORD}" \
  -X POST "https://${KIBANA_IP}:5601/api/sample_data/logs" \
  -H "kbn-xsrf: true" \
  -H "x-elastic-internal-origin: Kibana"
驗證範例資料集
確認 logs 範例資料集在 Kibana 中標示為 installed,並確認備份資料串流在 Elasticsearch 中包含 14,074 份文件:
curl -sk -u "elastic:${ELASTIC_PASSWORD}" \
  "https://${KIBANA_IP}:5601/api/sample_data" \
  -H "kbn-xsrf: true" \
  -H "x-elastic-internal-origin: Kibana" \
  | jq '.[] | select(.id == "logs") | {id, name, status}'

curl -sk -u "elastic:${ELASTIC_PASSWORD}" \
  "https://${ELASTICSEARCH_IP}:9200/_cat/indices/kibana_sample_data_logs*?v"
輸出內容大致如下:
{
  "id": "logs",
  "name": "Sample web logs",
  "status": "installed"
}
health status index                                         uuid                   pri rep docs.count docs.deleted store.size pri.store.size dataset.size
yellow open   .ds-kibana_sample_data_logs-2026.09.22-000001 0YivG3oFQQmb-mYqmULr_g   1   1      14074            0      8.7mb          8.7mb        8.7mb
LLM 服務需求
在 GDC 實體隔離方案環境中,無法連線至雲端託管的 Elastic Managed LLM 和外部公開 SaaS LLM 供應商。視 GDC 環境而定:
- GDC 上的代管 Gemini:在提供 Gemini 做為代管 LLM 服務的 GDC 環境中,您可以直接將 Kibana 連結至代管 Gemini 服務 (如有)。
- 自行管理的 LLM 服務:您也可以將 Elastic 連結至託管於 GDC 環境 (例如 GDC GPU 節點) 的自行管理 LLM 服務。
部署自行管理的 LLM 服務不在本指南的討論範圍內。為 Elastic 佈建或選取自行管理的 LLM 服務時,請務必確保該服務符合 Elastic 官方指南中的規定:
技術相關規定摘要
以下幾點總結了自管 LLM 服務所需的主要 API、模型功能、脈絡視窗和執行階段需求,以確保能與 Elastic 的 AI 代理、Agent Builder 和 Attack Discovery 穩定搭配運作。請注意,下列各節引用的特定設定參數名稱 (例如 num_ctx、num_predict、repeat_penalty、repeat_last_n、OLLAMA_FLASH_ATTENTION 和 OLLAMA_NUM_PARALLEL) 是以 Ollama 為例。如果您使用其他推論引擎 (例如 vLLM),請套用對應的設定。
- 與 OpenAI 相容的 Chat Completions API (
/v1/chat/completions),具備原生函式呼叫功能:- 任何自行管理的推論伺服器 (例如 Ollama 或 vLLM),只要公開與 OpenAI 相容的
/v1/chat/completions端點 (包括透過"stream": true串流伺服器傳送事件),就能使用 Kibana 的 OpenAI 連接器整合,並將供應商設為「Other (OpenAI Compatible Service)」(其他 (OpenAI 相容服務))。 - 使用支援雲端原生工具呼叫的模型 (例如
gemma4:31b) 時,請在 Kibana 連接器上啟用原生函式呼叫 ("enableNativeFunctionCalling": true)。根據預設 ("enableNativeFunctionCalling": false),Kibana 會使用提示詞模擬函式呼叫,在巢狀工具呼叫期間較不可靠,且可能因剖析錯誤而失敗 (例如Error: Missing name for tool use)。啟用原生函式呼叫後,工具呼叫格式設定會直接委派給推論伺服器的 OpenAItools通訊協定。
- 任何自行管理的推論伺服器 (例如 Ollama 或 vLLM),只要公開與 OpenAI 相容的
- 經過指令調整的模型,具備原生工具和函式呼叫功能:
- Elastic AI 代理 (
elastic-ai-agent) 和自訂 Agent Builder 建構代理依賴多步驟工具呼叫 (platform.core.list_indices、platform.core.get_index_mapping、platform.core.search、platform.core.execute_esql和platform.core.cases)。他們使用這些工具探索索引對應、生成並執行針對 Elasticsearch 的 ES|QL 查詢,以及彙整發現。 - 所選模型必須經過指令微調,且能生成有效的雲端原生工具叫用、結構化 JSON 輸出和 ES|QL 查詢。如要瞭解模型評估條件,請參閱 Elastic 的可觀測性 LLM 效能矩陣和 Elastic Security LLM 效能矩陣。
- Elastic AI 代理 (
- 脈絡窗口至少有
128,000個詞元 (例如 Ollama 中的num_ctx: 131072):- 雖然 Elastic 的一般自行管理自訂 LLM 說明文件指出最低限制為 64,000 個詞元,但強烈建議 Elastic AI Agent (
elastic-ai-agent) 使用 128,000 個詞元的脈絡窗口 (131,072個詞元)。 - 在多步驟調查期間,代理會將系統指令和工具定義與索引結構定義、ES|QL 說明文件和原始搜尋結果結合 (例如,在匯總前擷取最多 100 份範例文件,以檢查欄位值)。單次調查的對話記錄可能超過 70,000 個詞元,導致 64,000 個詞元的脈絡窗口在對話中途截斷提示。
- 請注意,在 Ollama 中,內建於模型
Modelfile的PARAMETER num_ctx指令會覆寫容器的OLLAMA_CONTEXT_LENGTH環境變數。請務必設定模型Modelfile中的OLLAMA_CONTEXT_LENGTH=131072和PARAMETER num_ctx 131072(在 80 GB NVIDIA A100 或 H100 GPU 上,gemma4:31b在128K情境下可輕鬆放入 VRAM)。
- 雖然 Elastic 的一般自行管理自訂 LLM 說明文件指出最低限制為 64,000 個詞元,但強烈建議 Elastic AI Agent (
- 輸出詞元限制和輕微重複懲罰 (例如 Ollama 中的
num_predict: 8192和repeat_penalty: 1.05):- Kibana 的 OpenAI 串流轉接器會將
"finish_reason": "length"視為致命的Token limit reached錯誤,並在每項要求中傳送"temperature": 0(貪婪解碼)。 - 如果是具備推論能力的模型 (例如
gemma4:31b,會在發出工具呼叫前生成內部思考詞元),請將輸出詞元限制設為至少8,192個詞元,並設定輕微的重複懲罰。例如,在 Ollama 中,設定num_predict: 8192、repeat_penalty: 1.05和repeat_last_n: 64。避免過度嚴厲的重複懲罰 (例如在大型視窗中設定1.15+),因為當模型將 ES|QL 查詢從內部推理區塊複製到最終工具呼叫 JSON 時,會受到懲罰。
- Kibana 的 OpenAI 串流轉接器會將
- GPU 加速、Flash Attention 和平行 KV 快取運算單元 (每回合 <60 秒):
- Kibana 的 OpenAI 連接器會強制執行預設的 60 秒 HTTP 逾時,每個串流回合都會套用。
- 由於單一代理回合可能會觸發巢狀 LLM 子呼叫 (例如在主要代理對話進行時,將自然語言搜尋要求轉譯為 ES|QL 查詢),因此如果推論伺服器只有一個 KV 快取槽,子呼叫可能會清除主要對話的快取內容,導致後續回合速度變慢。
- 在 Ollama 中,設定
OLLAMA_FLASH_ATTENTION=1和OLLAMA_NUM_PARALLEL=2,讓 Flash Attention 加速長上下文評估,並讓主要對話和巢狀子呼叫在 GPU 記憶體中維護獨立的 KV 快取槽。
在 Kibana 中設定 LLM 連接器
OpenAI 相容 LLM 服務開始運作,且可從 Kibana Pod 存取後,請使用 CLI 或 Kibana UI 在 Kibana 中設定 OpenAI 連接器。
方法 1:透過 CLI 建立連接器
執行下列
POST /api/actions/connector指令,建立指向 LLM 服務 (${LLM_API_URL}) 的 OpenAI (.gen-ai) 連接器,並啟用原生函式呼叫 ("enableNativeFunctionCalling": true)。Kibana 會自動產生並指派專屬連接器 ID:curl -sk -u "elastic:${ELASTIC_PASSWORD}" \ -X POST "https://${KIBANA_IP}:5601/api/actions/connector" \ -H "kbn-xsrf: true" \ -H "Content-Type: application/json" \ -d "{ \"name\": \"${LLM_CONNECTOR_NAME}\", \"connector_type_id\": \".gen-ai\", \"config\": { \"apiProvider\": \"Other\", \"apiUrl\": \"${LLM_API_URL}\", \"defaultModel\": \"${LLM_MODEL_NAME}\", \"enableNativeFunctionCalling\": true }, \"secrets\": { \"apiKey\": \"${LLM_API_KEY}\" } }" | jq .列出 Kibana 的連接器並依名稱篩選,確認
${LLM_CONNECTOR_NAME}連接器存在且沒有遺漏的密鑰:curl -sk -u "elastic:${ELASTIC_PASSWORD}" \ "https://${KIBANA_IP}:5601/api/actions/connectors" \ -H "kbn-xsrf: true" \ | jq ".[] | select(.name == \"${LLM_CONNECTOR_NAME}\")"輸出內容大致如下:
{
  "id": "<GENERATED_CONNECTOR_ID>",
  "name": "<LLM_CONNECTOR_NAME>",
  "config": {
    "apiProvider": "Other",
    "apiUrl": "<LLM_API_URL>",
    "defaultModel": "<LLM_MODEL_NAME>",
    "enableNativeFunctionCalling": true
  },
  "connector_type_id": ".gen-ai",
  "is_preconfigured": false,
  "is_deprecated": false,
  "referenced_by_count": 0,
  "is_missing_secrets": false,
  "is_system_action": false
}
如要透過 CLI 測試 Kibana 和 LLM 服務之間的即時端對端連線能力,請依名稱查詢自動生成的連接器 ID,並叫用其
_execute端點:export CONNECTOR_ID=$(curl -sk -u "elastic:${ELASTIC_PASSWORD}" \ "https://${KIBANA_IP}:5601/api/actions/connectors" \ -H "kbn-xsrf: true" \ | jq -r ".[] | select(.name == \"${LLM_CONNECTOR_NAME}\") | .id") curl -sk -u "elastic:${ELASTIC_PASSWORD}" \ -X POST "https://${KIBANA_IP}:5601/api/actions/connector/${CONNECTOR_ID}/_execute" \ -H "kbn-xsrf: true" \ -H "Content-Type: application/json" \ -d "{ \"params\": { \"subAction\": \"invokeAI\", \"subActionParams\": { \"model\": \"${LLM_MODEL_NAME}\", \"messages\": [ { \"role\": \"user\", \"content\": \"Reply with the single word Pong.\" } ] } } }" | jq .輸出內容應與下方類似,顯示
"status": "ok"和模型的回覆:{ "status": "ok", "data": { "message": "Pong", "usage": { "prompt_tokens": 23, "prompt_tokens_details": { "cached_tokens": 0 }, "completion_tokens": 38, "total_tokens": 61 } }, "connector_id": "<GENERATED_CONNECTOR_ID>" }
方法 2:透過 Kibana UI 建立連接器
- 登入 Kibana (
https://${KIBANA_IP}:5601)。 - 開啟主要導覽選單,依序前往「Management」(管理) >「Alerts and Insights」(快訊和深入分析) >「Connectors」(連接器)。
- 按一下「建立連接器」,然後選取「OpenAI」。
- 設定連接器欄位:
- 「Connector name」(連接器名稱):輸入
${LLM_CONNECTOR_NAME}的值 (例如Gemma4-31B)。 - 選取 OpenAI 供應商:選取「Other (OpenAI Compatible Service)」(其他 (OpenAI 相容服務))。
- 網址:輸入
${LLM_API_URL}的值 (LLM 服務的/v1/chat/completions端點)。 - 預設模型:輸入
${LLM_MODEL_NAME}的值 (例如gemma4:31b)。 - API 金鑰:輸入
${LLM_API_KEY}的值 (如果伺服器未強制執行 Bearer 驗證,則為任何非空白字串,否則為伺服器的 API 金鑰)。 - 啟用原生函式呼叫:開啟切換鈕。
- 「Connector name」(連接器名稱):輸入
- 按一下「Save & test」(儲存並測試),儲存連接器並立即開啟「Test」(測試) 分頁。
- 在「Test」(測試) 分頁中輸入提示範例 (例如
Reply with the single word Pong.),然後按一下「Run」(執行),確認 Kibana 收到 LLM 服務傳來的有效回應。
測試 LLM 整合
安裝 kibana_sample_data_logs 資料集並驗證 LLM 連接器後,即可在 Kibana 測試 Elastic 的 AI 功能。
Elastic AI Agent
Elastic AI Agent (elastic-ai-agent) 是 Kibana 整合的預設對話式代理,可使用自然語言探索及分析 Elasticsearch 中的資料。代理會由您設定的 LLM 連接器和內建 Agent Builder 工具提供技術支援,自動探索 Elasticsearch 索引和對應 (platform.core.list_indices、platform.core.get_index_mapping)、生成並執行 ES|QL 查詢 (platform.core.search、platform.core.execute_esql),以及彙整發現結果,您不必事先瞭解基礎結構定義。您也可以使用自訂指令和工具,建構專屬的自訂代理。詳情請參閱「使用 Agent Builder 建立自訂代理」。
如要在 Kibana UI 中開啟及設定 Elastic AI 代理,請按照下列步驟操作:
- 開啟 Kibana 的主要導覽選單,然後選取「AI Agent」(AI 代理) (或按一下頂端標題列中的「Ask AI」(詢問 AI) 按鈕,或直接前往
https://${KIBANA_IP}:5601/app/chat)。 - 確認已選取「Elastic AI Agent」做為有效 AI 代理,並選取 LLM 連接器 (
${LLM_CONNECTOR_NAME}) 做為模型連接器。
範例 1:調查失敗的 HTTP 要求和潛在掃描器
請 Elastic AI 代理程式找出在 kibana_sample_data_logs 中產生非 200 HTTP 回應的頂層用戶端 IP 位址、這些 IP 位址的來源國家/地區,以及這些 IP 位址是否也有成功的 HTTP 200 流量:
選項 1:透過 Kibana UI:在「AI Agent」(AI 代理程式) 對話提示中輸入下列問題:
In kibana_sample_data_logs, which client IP addresses had the most
failed HTTP requests (non-200 status codes), what countries did they come
from, and did any of those IPs also have successful HTTP 200 requests?
選項 2:透過 CLI:
curl -sk -u "elastic:${ELASTIC_PASSWORD}" \
  -X POST "https://${KIBANA_IP}:5601/api/agent_builder/converse" \
  -H "kbn-xsrf: true" \
  -H "Content-Type: application/json" \
  -d "{
    \"agent_id\": \"elastic-ai-agent\",
    \"connector_id\": \"${CONNECTOR_ID}\",
    \"input\": \"In kibana_sample_data_logs, which client IP addresses had the most failed HTTP requests (non-200 status codes), what countries did they come from, and did any of those IPs also have successful HTTP 200 requests?\"
  }" | jq '{
    status: .status,
    tools_called: [.steps[] | select(.type == "tool_call") | {tool_id: .tool_id, params: .params}],
    response: .response.message
  }'
幕後到底發生了什麼事?
- 代理會呼叫
platform.core.get_index_mapping(indices=["kibana_sample_data_logs"]),檢查可用的欄位 (clientip、geo.src、response、bytes、request等)。 它會呼叫
platform.core.search來檢查範例文件,並確認 HTTP 狀態碼儲存在response中,然後執行 ES|QL 匯總,依clientip和geo.src對非200要求進行排名,並檢查哪些熱門 IP 也記錄了response == "200"流量:FROM kibana_sample_data_logs | WHERE response != "200" | STATS failed_count = COUNT(*) BY clientip, geo.src | SORT failed_count DESC | LIMIT 10FROM kibana_sample_data_logs | WHERE clientip IN ("30.156.16.164", "213.235.30.99", "221.241.228.46", "209.94.234.133", "7.127.73.138", "247.240.202.244", "130.125.65.24", "164.85.94.243", "81.194.200.150", "30.145.143.210") AND response == "200" | STATS success_count = COUNT(*) BY clientip
Elastic AI 代理的回覆應類似如下:
在
kibana_sample_data_logs中,HTTP 要求失敗次數最多 (非 200 狀態碼) 的用戶端 IP 位址是 30.156.16.164,該位址來自美國,記錄了 100 次失敗要求。其他要求失敗的主要 IP 位址 (同樣來自美國) 包括:
- 213.235.30.99:6 次失敗
- 221.241.228.46:失敗 6 次
- 209.94.234.133:失敗 6 次
- 7.127.73.138:5 次失敗
- 247.240.202.244:5 次失敗
- 130.125.65.24:5 次失敗
- 164.85.94.243:4 次失敗
- 81.194.200.150:4 次失敗
- 30.145.143.210:4 次失敗
在成功要求方面,上述所有 IP 至少都有一些成功的 HTTP 200 回應,但 30.156.16.164 除外,該 IP 沒有任何成功要求。
範例 2:依 HTTP 狀態碼分析流量和酬載位元組
請 Elastic AI 代理提供 kibana_sample_data_logs 中所有要求的 HTTP 回應狀態碼明細,以及每個狀態碼轉移的總位元組數:
方法 1:透過 Kibana UI:在 AI 代理 中發起新對話,並輸入下列問題:
In kibana_sample_data_logs, what is the breakdown of HTTP response
status codes across all requests, and how much total data (in bytes) was
transferred for each status code?
選項 2:透過 CLI
curl -sk -u "elastic:${ELASTIC_PASSWORD}" \
  -X POST "https://${KIBANA_IP}:5601/api/agent_builder/converse" \
  -H "kbn-xsrf: true" \
  -H "Content-Type: application/json" \
  -d "{
    \"agent_id\": \"elastic-ai-agent\",
    \"connector_id\": \"${CONNECTOR_ID}\",
    \"input\": \"In kibana_sample_data_logs, what is the breakdown of HTTP response status codes across all requests, and how much total data (in bytes) was transferred for each status code?\"
  }" | jq '{
    status: .status,
    tools_called: [.steps[] | select(.type == "tool_call") | {tool_id: .tool_id, params: .params}],
    response: .response.message
  }'
幕後到底發生了什麼事?
- 代理會透過
platform.core.get_index_mapping檢查kibana_sample_data_logs結構定義,找出response.keyword和bytes欄位。 叫用
platform.core.search,生成並執行下列 ES|QL 匯總:FROM kibana_sample_data_logs | STATS request_count = COUNT(*), total_bytes = SUM(bytes) BY response.keyword | LIMIT 100
Elastic AI 代理的回覆應類似如下:
以下是
kibana_sample_data_logs的 HTTP 回應狀態碼和資料移轉總量細目:
| 狀態碼 | 要求數量 | 已移轉的資料總量 (位元組) |
|---|---|---|
| 200 | 12,832 | 75,681,246 |
| 404 | 801 | 4,044,443 |
| 503 | 441 | 0 |
使用 Agent Builder 建立自訂代理
Agent Builder 可讓您結合自訂系統指令與內建工具 (例如 platform.core.cases、platform.core.execute_esql 和 platform.core.search) 和使用者定義的工具 (esql、index_search、workflow 和 mcp),建立專為特定作業工作流程量身打造的自訂 AI 代理。
以下範例會建構網路安全事件應變人員代理,直接在 kibana_sample_data_logs 資料集上運作。收到自然語言提示後,代理會執行以下操作:
- 執行自訂 ES|QL 工具 (
investigate_suspicious_web_clients),依用戶端 IP 匯總kibana_sample_data_logs中非200的 HTTP 回應。 - 區分惡意偵察和入侵活動 (
30.156.16.164) 與良性下載失敗。 - 叫用自訂 Kibana 工作流程工具 (
create_security_case),自動開啟結構化 Kibana 安全性案例,並附上發現結果和修復步驟。
建立自訂 ES|QL 和案件建立工具
建立名為
investigate_suspicious_web_clients的自訂esql工具,查詢kibana_sample_data_logs,找出產生非200HTTP 狀態碼的主要用戶端 IP 位址,以及其狀態碼、來源國家/地區 (geo.src)、使用者代理程式 (agent) 和要求的網址 (request):方法 1:透過 Kibana UI:
- 在 Kibana 中開啟主導覽選單,然後依序前往「Elasticsearch」 >「Agents」,接著點選「Manage all tools」(或直接前往
https://${KIBANA_IP}:5601/app/agent_builder/tools),然後點選「New tool」。 設定工具欄位:
- 工具 ID:
investigate_suspicious_web_clients - 類型:ES|QL
- 說明:
Finds the top client IP addresses generating non-200 HTTP error responses in kibana_sample_data_logs, returning their error count, status codes, source country, user agents, and requested URL paths. - 標籤:
security、logs ES|QL 查詢:
FROM kibana_sample_data_logs | WHERE response != "200" | STATS error_count = COUNT(*), status_codes = VALUES(response), country = VALUES(geo.src), user_agents = VALUES(agent), sample_requests = VALUES(request) BY clientip | SORT error_count DESC | LIMIT 5
- 工具 ID:
按一下 [儲存]。
- 在 Kibana 中開啟主導覽選單,然後依序前往「Elasticsearch」 >「Agents」,接著點選「Manage all tools」(或直接前往
選項 2:透過 CLI:
curl -sk -u "elastic:${ELASTIC_PASSWORD}" \
  -X POST "https://${KIBANA_IP}:5601/api/agent_builder/tools" \
  -H "kbn-xsrf: true" \
  -H "Content-Type: application/json" \
  -d '{
    "id": "investigate_suspicious_web_clients",
    "type": "esql",
    "description": "Finds the top client IP addresses generating non-200 HTTP error responses in kibana_sample_data_logs, returning their error count, status codes, source country, user agents, and requested URL paths.",
    "tags": ["security", "logs"],
    "configuration": {
      "query": "FROM kibana_sample_data_logs | WHERE response != \"200\" | STATS error_count = COUNT(*), status_codes = VALUES(response), country = VALUES(geo.src), user_agents = VALUES(agent), sample_requests = VALUES(request) BY clientip | SORT error_count DESC | LIMIT 5",
      "params": {}
    }
  }' | jq '{id: .id, type: .type}'
由於 Agent Builder 內建的
platform.core.cases工具為唯讀 (用於搜尋及擷取現有案件),請建立 Kibana 工作流程 (create-security-case) 來叫用 Kibana 的原生cases.createCase步驟,並將其註冊為名為create_security_case的workflow工具:方法 1:透過 Kibana UI
- 開啟主導覽選單,然後依序前往「管理」 >「工作流程」 (或直接前往
https://${KIBANA_IP}:5601/app/workflows),然後按一下「建立新工作流程」。 在 YAML 編輯器中,貼上下列工作流程定義,然後按一下「Save」(儲存):
version: "1"
name: Create Security Case
description: Creates a new Kibana Case in Elastic Security
enabled: true
triggers:
  - type: manual
inputs:
  - name: title
    type: string
    required: true
    description: Title of the security case
  - name: description
    type: string
    required: true
    description: Detailed markdown description of the incident findings
  - name: severity
    type: string
    default: high
    description: Severity of the case (low, medium, high, critical)
steps:
  - name: create_case
    type: cases.createCase
    with:
      title: ${{ inputs.title }}
      description: ${{ inputs.description }}
      severity: ${{ inputs.severity }}
      owner: securitySolution
      tags:
        - agent-builder
        - web-logs
返回 Agent Builder 的「Tools」(工具) 頁面 (
https://${KIBANA_IP}:5601/app/agent_builder/tools,或依序前往「Elasticsearch」 >「Agents」(代理),然後點選「Manage all tools」(管理所有工具)),接著點選「New tool」(新增工具)。設定工作流程工具欄位,然後按一下「儲存」:
- 工具 ID:
create_security_case - 類型:工作流程
- 工作流程:選取「建立安全事件」(
create-security-case) - 說明:
Creates a new Kibana Case in Elastic Security with a title, markdown description of the incident findings, and severity (low, medium, high, critical). - 標籤:
security、cases
- 工具 ID:
- 開啟主導覽選單,然後依序前往「管理」 >「工作流程」 (或直接前往
選項 2:透過 CLI
curl -sk -u "elastic:${ELASTIC_PASSWORD}" \
  -X POST "https://${KIBANA_IP}:5601/api/workflows" \
  -H "kbn-xsrf: true" \
  -H "Content-Type: application/json" \
  -d '{
    "workflows": [
      {
        "yaml": "version: \"1\"\nname: Create Security Case\ndescription: Creates a new Kibana Case in Elastic Security\nenabled: true\ntriggers:\n  - type: manual\ninputs:\n  - name: title\n    type: string\n    required: true\n    description: Title of the security case\n  - name: description\n    type: string\n    required: true\n    description: Detailed markdown description of the incident findings\n  - name: severity\n    type: string\n    default: high\n    description: Severity of the case (low, medium, high, critical)\nsteps:\n  - name: create_case\n    type: cases.createCase\n    with:\n      title: ${{ inputs.title }}\n      description: ${{ inputs.description }}\n      severity: ${{ inputs.severity }}\n      owner: securitySolution\n      tags:\n        - agent-builder\n        - web-logs\n"
      }
    ]
  }' | jq '.created[] | {id: .id, valid: .valid}'

curl -sk -u "elastic:${ELASTIC_PASSWORD}" \
  -X POST "https://${KIBANA_IP}:5601/api/agent_builder/tools" \
  -H "kbn-xsrf: true" \
  -H "Content-Type: application/json" \
  -d '{
    "id": "create_security_case",
    "type": "workflow",
    "description": "Creates a new Kibana Case in Elastic Security with a title, markdown description of the incident findings, and severity (low, medium, high, critical).",
    "tags": ["security", "cases"],
    "configuration": {
      "workflow_id": "create-security-case"
    }
  }' | jq '{id: .id, type: .type}'
建立自訂事件應變人員代理
建立 web-security-incident-responder 代理,並指派 investigate_suspicious_web_clients、create_security_case 和 platform.core.cases 工具:
方法 1:透過 Kibana UI
- 開啟主要導覽選單,依序前往「Elasticsearch」 >「Agents」 (或直接前往
https://${KIBANA_IP}:5601/app/agent_builder/agents),然後按一下「New agent」。 設定代理詳細資料:
- Agent ID:
web-security-incident-responder - 顯示名稱:
Web Security Incident Responder - 顯示說明:
Investigates suspicious HTTP error activity in web access logs and opens Kibana Security Cases with the findings. - 標籤:
security、incident-response 自訂指令:
You are an automated Web Security Incident Responder. When asked to investigate suspicious web traffic: 1. Call the `investigate_suspicious_web_clients` tool to inspect the top client IPs generating non-200 HTTP responses in `kibana_sample_data_logs`. 2. Identify any client IP exhibiting malicious reconnaissance or exploitation behavior (such as Nmap scans, WordPress login probing, `/etc/passwd` path traversal, or `/level/15/exec` command execution attempts) versus benign download errors. 3. Call the `create_security_case` tool to open a new Kibana Security Case for the malicious client IP. Set an appropriate `title`, `severity` (`high`), and a well-structured Markdown `description` summarizing the source IP, geolocation, total failed requests, observed attack categories (mapped to MITRE ATT&CK where applicable), sample malicious URLs, and recommended remediation steps. 4. Return a concise summary of your investigation and confirm the created Kibana Case details.工具:選取
investigate_suspicious_web_clients、create_security_case和platform.core.cases。
- Agent ID:
按一下 [儲存]。
- 開啟主要導覽選單,依序前往「Elasticsearch」 >「Agents」 (或直接前往
選項 2:透過 CLI
curl -sk -u "elastic:${ELASTIC_PASSWORD}" \
  -X POST "https://${KIBANA_IP}:5601/api/agent_builder/agents" \
  -H "kbn-xsrf: true" \
  -H "Content-Type: application/json" \
  -d '{
    "id": "web-security-incident-responder",
    "name": "Web Security Incident Responder",
    "description": "Investigates suspicious HTTP error activity in web access logs and opens Kibana Security Cases with the findings.",
    "labels": ["security", "incident-response"],
    "avatar_color": "#E7664C",
    "avatar_symbol": "IR",
    "configuration": {
      "instructions": "You are an automated Web Security Incident Responder. When asked to investigate suspicious web traffic:\n1. Call the `investigate_suspicious_web_clients` tool to inspect the top client IPs generating non-200 HTTP responses in `kibana_sample_data_logs`.\n2. Identify any client IP exhibiting malicious reconnaissance or exploitation behavior (such as Nmap scans, WordPress login probing, `/etc/passwd` path traversal, or `/level/15/exec` command execution attempts) versus benign download errors.\n3. Call the `create_security_case` tool to open a new Kibana Security Case for the malicious client IP. Set an appropriate `title`, `severity` (`high`), and a well-structured Markdown `description` summarizing the source IP, geolocation, total failed requests, observed attack categories (mapped to MITRE ATT&CK where applicable), sample malicious URLs, and recommended remediation steps.\n4. Return a concise summary of your investigation and confirm the created Kibana Case details.",
      "tools": [
        {
          "tool_ids": [
            "investigate_suspicious_web_clients",
            "create_security_case",
            "platform.core.cases"
          ]
        }
      ]
    }
  }' | jq '{id: .id, name: .name}'
執行代理並驗證 Kibana 案件
與網路安全事件應變人員代理對話:
方法 1:透過 Kibana UI
- 開啟主要導覽選單,然後依序前往「Elasticsearch」 >「Agents」(代理程式) (或直接前往
https://${KIBANA_IP}:5601/app/agent_builder)。 - 在代理選取器中選取「Web Security Incident Responder」,並確認已選取 LLM 連接器 (
${LLM_CONNECTOR_NAME})。 輸入下列提示詞:
Investigate the top client IPs generating HTTP errors in our web
logs, identify any attacker performing reconnaissance or
exploitation, and open a high-severity Kibana Security Case with
your findings.
- 開啟主要導覽選單,然後依序前往「Elasticsearch」 >「Agents」(代理程式) (或直接前往
選項 2:透過 CLI
curl -sk -u "elastic:${ELASTIC_PASSWORD}" \
  -X POST "https://${KIBANA_IP}:5601/api/agent_builder/converse" \
  -H "kbn-xsrf: true" \
  -H "Content-Type: application/json" \
  -d "{
    \"agent_id\": \"web-security-incident-responder\",
    \"connector_id\": \"${CONNECTOR_ID}\",
    \"input\": \"Investigate the top client IPs generating HTTP errors in our web logs, identify any attacker performing reconnaissance or exploitation, and open a high-severity Kibana Security Case with your findings.\"
  }" | jq '{
    status: .status,
    tools_called: [.steps[] | select(.type == "tool_call") | .tool_id],
    response: .response.message
  }'
輸出內容大致如下:
{
  "status": "completed",
  "tools_called": [
    "investigate_suspicious_web_clients",
    "create_security_case"
  ],
  "response": "I have completed the investigation into the web logs. \n\nThe analysis identified client IP **`30.156.16.164`** (located in the US) as a malicious actor. This IP generated 100 failed requests (HTTP 404) exhibiting clear patterns of reconnaissance and exploitation:\n\n*   **Reconnaissance:** Extensive probing for WordPress installations and plugins, as well as Nmap scan signatures (e.g., `/nmaplowercheck...`).\n*   **Path Traversal:** Attempts to access sensitive system files via `/etc/passwd`.\n*   **Remote Command Execution (RCE):** Attempts to execute commands through paths such as `/level/15/exec`.\n*   **Application Probing:** Targeting common management interfaces including Tomcat, Axis2, and JMX consoles.\n\nAs a result, I have opened a **high-severity** Kibana Security Case to track this incident:\n\n*   **Case ID:** `1f0e00a5-cc89-4f62-b305-f286fae3d70e`\n*   **Title:** Malicious Reconnaissance and Exploitation Attempt from 30.156.16.164\n*   **Recommended Action:** Immediately block the IP at the firewall/WAF and verify that no unauthorized access was achieved."
}
驗證新建立的 Kibana 安全性案件:
方法 1:透過 Kibana UI
- 開啟主要導覽選單,然後依序前往「Security」(安全性) >「Cases」(案件) (或直接前往
https://${KIBANA_IP}:5601/app/security/cases)。 - 按一下「Malicious Reconnaissance and Exploitation Attempt from 30.156.16.164」,查看格式化的 Markdown 事件摘要、MITRE ATT&CK 分析、惡意網址範例和修復檢查清單。
- 開啟主要導覽選單,然後依序前往「Security」(安全性) >「Cases」(案件) (或直接前往
選項 2:透過 CLI
curl -sk -u "elastic:${ELASTIC_PASSWORD}" \
  "https://${KIBANA_IP}:5601/api/cases/_find" \
  -H "kbn-xsrf: true" \
  | jq '.cases[0] | {id: .id, title: .title, severity: .severity, status: .status, tags: .tags, description: .description}'
輸出內容大致如下:
{
  "id": "1f0e00a5-cc89-4f62-b305-f286fae3d70e",
  "title": "Malicious Reconnaissance and Exploitation Attempt from 30.156.16.164",
  "severity": "high",
  "status": "open",
  "tags": [
    "agent-builder",
    "web-logs"
  ],
  "description": "### Incident Summary\n**Source IP:** `30.156.16.164`\n**Geolocation:** US\n**Total Failed Requests:** 100\n**Status Codes Observed:** 404\n\n### Analysis\nThe client IP exhibited clear patterns of malicious reconnaissance and exploitation attempts:\n\n- **Reconnaissance (MITRE ATT&CK T1595):** Extensive probing for WordPress installations (`/wp-login.php`, various plugin paths) and Nmap scan signatures (`/nmaplowercheck...`).\n- **Path Traversal (MITRE ATT&CK T1083):** Attempted to access sensitive system files via `/cgi-bin/mj_wwwusr?passw=&list=GLOBAL&user=&func=help&extra=/../../../../../../../../etc/passwd`.\n- **Remote Command Execution (MITRE ATT&CK T1203):** Attempts to execute commands via paths like `/level/15/exec/-/configure/http`.\n- **Application Probing:** Targeted common management interfaces such as `/tomcat/manager/html/`, `/axis2/axis2-admin/`, and `/jmx-console/`.\n\n### Sample Malicious URLs\n- `/cgi-bin/mj_wwwusr?passw=&list=GLOBAL&user=&func=help&extra=/../../../../../../../../etc/passwd`\n- `/level/15/exec/-/configure/http`\n- `/nmaplowercheck1331872976`\n- `/wp-login.php`\n\n### Recommended Remediation\n1. **Block IP:** Immediately block `30.156.16.164` at the network firewall/WAF.\n2. **Log Review:** Verify that all requests from this IP resulted in 404 errors and no unauthorized access was gained.\n3. **Hardening:** Ensure that sensitive directories (e.g., `/cgi-bin/`, `/manager/`) are properly restricted."
}
攻擊探索
攻擊探索
是 Elastic Security 中的 AI 功能,可分析未解決的安全快訊、將快訊對應至 MITRE ATT&CK 架構,並將相關快訊、IP 位址和使用者帳戶關聯至視覺化攻擊鏈。由於攻擊偵測功能需要大型模型,才能可靠地合成多重警示結構化 JSON 輸出內容,因此請使用 30B 級或更大的模型 (例如 gemma4:31b)。
從範例記錄檔產生安全性警示
根據預設,kibana_sample_data_logs 資料集包含原始網路存取記錄,且不會填入 Elastic Security 安全性警示索引 (.alerts-security.alerts-default)。此外,Kibana 的樣本資料產生器會將未來 @timestamp 值 (最多提前 30 天) 指派給 30.156.16.164 的 100 個掃描和漏洞攻擊要求,因此這些要求會超出 Elastic Security 偵測規則查詢的 now-30d 至 now 視窗。
如要使用範例記錄示範攻擊偵測功能,請將 30.156.16.164 記錄的 @timestamp 往回調整 30 天,並使用 Elastic Common Schema (ECS) source.ip 和 user.name 欄位擴充記錄,然後建立兩項偵測規則,根據這些事件產生安全性警示:
將
clientip對應至source.ip、設定user.name(www-data),並將kibana_sample_data_logs*中30.156.16.164記錄的@timestamp往回移動 30 天:curl -sk -u "elastic:${ELASTIC_PASSWORD}" \ -X POST "https://${ELASTICSEARCH_IP}:9200/kibana_sample_data_logs*/_update_by_query?conflicts=proceed&refresh=true" \ -H "Content-Type: application/json" \ -d '{ "query": { "term": { "clientip": "30.156.16.164" } }, "script": { "source": "ctx._source.source = [\"ip\": ctx._source.clientip]; ctx._source.user = [\"name\": \"www-data\"]; ctx._source[\"@timestamp\"] = ZonedDateTime.parse(ctx._source[\"@timestamp\"]).minusDays(30).toString();", "lang": "painless" } }' | jq '{updated: .updated, failures: .failures}'建立兩項 Elastic Security 偵測規則,目標為
kibana_sample_data_logs*。第一項規則會偵測 Nmap 和 WordPress 登入探測 (Reconnaissance),第二項規則會偵測/etc/passwd路徑遍歷和遠端指令執行嘗試 (Initial Access):curl -sk -u "elastic:${ELASTIC_PASSWORD}" \ -X POST "https://${KIBANA_IP}:5601/api/detection_engine/rules" \ -H "kbn-xsrf: true" \ -H "Content-Type: application/json" \ -d '{ "name": "Suspicious Web Reconnaissance and Vulnerability Scanning", "description": "Detects Nmap active scanning and WordPress login/plugin probing in web access logs.", "risk_score": 47, "severity": "medium", "type": "query", "language": "kuery", "query": "clientip: \"30.156.16.164\" and (request: *nmap* or request: *wp-login*)", "index": ["kibana_sample_data_logs*"], "from": "now-30d", "interval": "1h", "max_signals": 2, "enabled": true, "threat": [ { "framework": "MITRE ATT&CK", "tactic": { "id": "TA0043", "name": "Reconnaissance", "reference": "https://attack.mitre.org/tactics/TA0043/" }, "technique": [ { "id": "T1595", "name": "Active Scanning", "reference": "https://attack.mitre.org/techniques/T1595/" } ] } ] }' | jq '{id: .id, name: .name, enabled: .enabled}' curl -sk -u "elastic:${ELASTIC_PASSWORD}" \ -X POST "https://${KIBANA_IP}:5601/api/detection_engine/rules" \ -H "kbn-xsrf: true" \ -H "Content-Type: application/json" \ -d '{ "name": "Web Path Traversal and Remote Command Execution Attempt", "description": "Detects path traversal attempts targeting /etc/passwd and Cisco IOS privilege level 15 remote command execution (/level/15/exec).", "risk_score": 73, "severity": "high", "type": "query", "language": "kuery", "query": "clientip: \"30.156.16.164\" and (request: *passwd* or request: *exec*)", "index": ["kibana_sample_data_logs*"], "from": "now-30d", "interval": "1h", "max_signals": 2, "enabled": true, "threat": [ { "framework": "MITRE ATT&CK", "tactic": { "id": "TA0001", "name": "Initial Access", "reference": "https://attack.mitre.org/tactics/TA0001/" }, "technique": [ { "id": "T1190", "name": "Exploit Public-Facing Application", "reference": "https://attack.mitre.org/techniques/T1190/" } ] } ] }' | jq '{id: .id, name: .name, enabled: .enabled}'等待約 60 秒,讓初始規則執行完畢,然後確認 4 個快訊已編入
.alerts-security.alerts-default的索引:curl -sk -u "elastic:${ELASTIC_PASSWORD}" \ "https://${ELASTICSEARCH_IP}:9200/.alerts-security.alerts-default/_search?size=4" \ | jq '.hits.hits[]._source | {rule: .["kibana.alert.rule.name"], source_ip: .source.ip, user_name: .user.name, request: .request}'輸出內容應如下所示:
{
  "rule": "Web Path Traversal and Remote Command Execution Attempt",
  "source_ip": "30.156.16.164",
  "user_name": "www-data",
  "request": "/cgi-bin/mj_wwwusr?passw=&list=GLOBAL&user=&func=help&extra=/../../../../../../../../etc/passwd"
}
{
  "rule": "Web Path Traversal and Remote Command Execution Attempt",
  "source_ip": "30.156.16.164",
  "user_name": "www-data",
  "request": "/cgi-bin/mj_wwwusr?passw=&list=GLOBAL&user=&func=help&extra=/../../../../../../../../etc/passwd"
}
{
  "rule": "Suspicious Web Reconnaissance and Vulnerability Scanning",
  "source_ip": "30.156.16.164",
  "user_name": "www-data",
  "request": "/nmaplowercheck1331872976"
}
{
  "rule": "Suspicious Web Reconnaissance and Vulnerability Scanning",
  "source_ip": "30.156.16.164",
  "user_name": "www-data",
  "request": "/nmaplowercheck1331873003"
}
執行攻擊探索
- 在 Kibana 中開啟主導覽選單,然後依序前往「Security」 >「Attack Discovery」 (或直接前往
https://${KIBANA_IP}:5601/app/security/attack_discovery)。 - 從頁面頂端的連接器選單中,選取 LLM 連接器 (
${LLM_CONNECTOR_NAME})。 - 按一下「Generate」(生成),分析
.alerts-security.alerts-default中的待處理警告。
您也可以透過 CLI 觸發及檢查攻擊偵測:
export EXECUTION_UUID=$(curl -sk -u "elastic:${ELASTIC_PASSWORD}" \
  -X POST "https://${KIBANA_IP}:5601/api/attack_discovery/_generate" \
  -H "kbn-xsrf: true" \
  -H "elastic-api-version: 2023-10-31" \
  -H "Content-Type: application/json" \
  -d "{
    \"alertsIndexPattern\": \".alerts-security.alerts-default\",
    \"anonymizationFields\": [
      {\"id\": \"_id\", \"field\": \"_id\", \"allowed\": true},
      {\"id\": \"@timestamp\", \"field\": \"@timestamp\", \"allowed\": true},
      {\"id\": \"kibana.alert.original_time\", \"field\": \"kibana.alert.original_time\", \"allowed\": true},
      {\"id\": \"message\", \"field\": \"message\", \"allowed\": true},
      {\"id\": \"kibana.alert.rule.name\", \"field\": \"kibana.alert.rule.name\", \"allowed\": true},
      {\"id\": \"kibana.alert.rule.description\", \"field\": \"kibana.alert.rule.description\", \"allowed\": true},
      {\"id\": \"kibana.alert.severity\", \"field\": \"kibana.alert.severity\", \"allowed\": true},
      {\"id\": \"kibana.alert.risk_score\", \"field\": \"kibana.alert.risk_score\", \"allowed\": true},
      {\"id\": \"kibana.alert.rule.threat.tactic.id\", \"field\": \"kibana.alert.rule.threat.tactic.id\", \"allowed\": true},
      {\"id\": \"kibana.alert.rule.threat.tactic.name\", \"field\": \"kibana.alert.rule.threat.tactic.name\", \"allowed\": true},
      {\"id\": \"kibana.alert.rule.threat.technique.id\", \"field\": \"kibana.alert.rule.threat.technique.id\", \"allowed\": true},
      {\"id\": \"kibana.alert.rule.threat.technique.name\", \"field\": \"kibana.alert.rule.threat.technique.name\", \"allowed\": true},
      {\"id\": \"source.ip\", \"field\": \"source.ip\", \"allowed\": true},
      {\"id\": \"user.name\", \"field\": \"user.name\", \"allowed\": true}
    ],
    \"apiConfig\": {
      \"actionTypeId\": \".gen-ai\",
      \"connectorId\": \"${CONNECTOR_ID}\"
    },
    \"replacements\": {},
    \"size\": 20,
    \"subAction\": \"invokeAI\"
  }" | jq -r '.execution_uuid')

echo "Attack Discovery execution UUID: ${EXECUTION_UUID}"
生成作業完成後 (約 60 到 90 秒),請擷取探索到的攻擊鏈:
curl -sk -u "elastic:${ELASTIC_PASSWORD}" \
  "https://${KIBANA_IP}:5601/api/attack_discovery/_find" \
  -H "kbn-xsrf: true" \
  -H "elastic-api-version: 2023-10-31" \
  | jq '.data[0]'
產生的攻擊探索會將這四項快訊關聯為單一事件,並連結來源 IP、使用者帳戶和 MITRE ATT&CK 戰術:
{
  "alert_ids": [
    "05c30118398ea2a8b70c55ce81fdb559dbe14c460a8a95253bd81719415a28b5",
    "73ebaeca440b463ffa5812da5b68a2485d465a648ffaf16385a54d8bae9a53d2",
    "60ae9f16b40cec1bdc27674ade0e5eb69680ccca3d956fbf2a75418843799987",
    "de503ae52444db7712d062c54750f413b90a75521cdfff0de9bdf41a64141346"
  ],
  "alert_rule_uuid": "attack_discovery_ad_hoc_rule_id",
  "alert_start": "2026-10-03T01:05:00.384Z",
  "alert_updated_at": "2026-10-03T01:05:03.460Z",
  "alert_workflow_status": "open",
  "alert_workflow_status_updated_at": "2026-10-03T01:05:03.460Z",
  "connector_id": "<GENERATED_CONNECTOR_ID>",
  "connector_name": "<GENERATED_CONNECTOR_ID>",
  "details_markdown": "- The attack sequence began at `2026-10-01T12:43:41.756Z` when an actor using IP `30.156.16.164` performed active reconnaissance scanning against the server.\n- Following the initial scan, the attacker attempted to exploit a path traversal vulnerability at `2026-10-01T12:43:51.756Z` and again at `2026-10-01T12:44:02.756Z`, specifically targeting the `/etc/passwd` file via the `mj_wwwusr` CGI endpoint.\n- The activity concluded with further reconnaissance scanning at `2026-10-01T12:44:21.756Z` from the same source IP `30.156.16.164`.\n- All requests were associated with the user `www-data` and resulted in 404 errors, suggesting the attempts were unsuccessful.",
  "entity_summary_markdown": "Activity targeting user `www-data` from source IP `30.156.16.164`.",
  "generation_uuid": "<EXECUTION_UUID>",
  "id": "1f71ed004c7340d5088d242ca2483525a164a9ea9a80a3f90bd1f514d43231bc",
  "mitre_attack_tactics": [
    "Reconnaissance",
    "Initial Access"
  ],
  "risk_score": 240,
  "summary_markdown": "An attacker from `30.156.16.164` performed reconnaissance and path traversal attempts against the system.",
  "timestamp": "2026-10-03T01:05:00.384Z",
  "title": "Web Reconnaissance and Exploitation Attempt",
  "user_id": "elastic",
  "user_name": "elastic",
  "users": [
    {
      "id": "elastic",
      "name": "elastic"
    }
  ],
  "index": ".internal.adhoc.alerts-security.attack.discovery.alerts-default-000001"
}