

Overview
This guide outlines the end-to-end deployment of the Elastic Stack (Elasticsearch and Kibana) on a Google Distributed Cloud (GDC) air-gapped shared cluster and demonstrates how to integrate it with a Large Language Model (LLM) service to evaluate Elastic's generative AI features.
The deployment uses the official Elastic Cloud on Kubernetes (ECK) operator available in the GDC air-gapped Marketplace. The operator installs into a project namespace on a shared Kubernetes cluster and automates the provisioning and lifecycle management of Elasticsearch and Kibana resources. Once deployed, Kibana connects to an LLM inference endpoint (such as managed Gemini on GDC or a self-managed OpenAI-compatible service like Ollama or vLLM). This integration powers Elastic's generative AI capabilities, including the Elastic AI Agent, custom agents built with Agent Builder, and Attack Discovery.
This guide was written for Elastic v9.4.0, the Elastic Kubernetes Operator v3.4.0, and GDC v1.16.2. Some instructions may differ slightly if you are using different versions.
Architecture
The architecture consists of an Elastic Stack deployment managed by the ECK operator inside a project namespace on a GDC shared user cluster. Kibana communicates over the internal GDC network with an LLM inference endpoint.
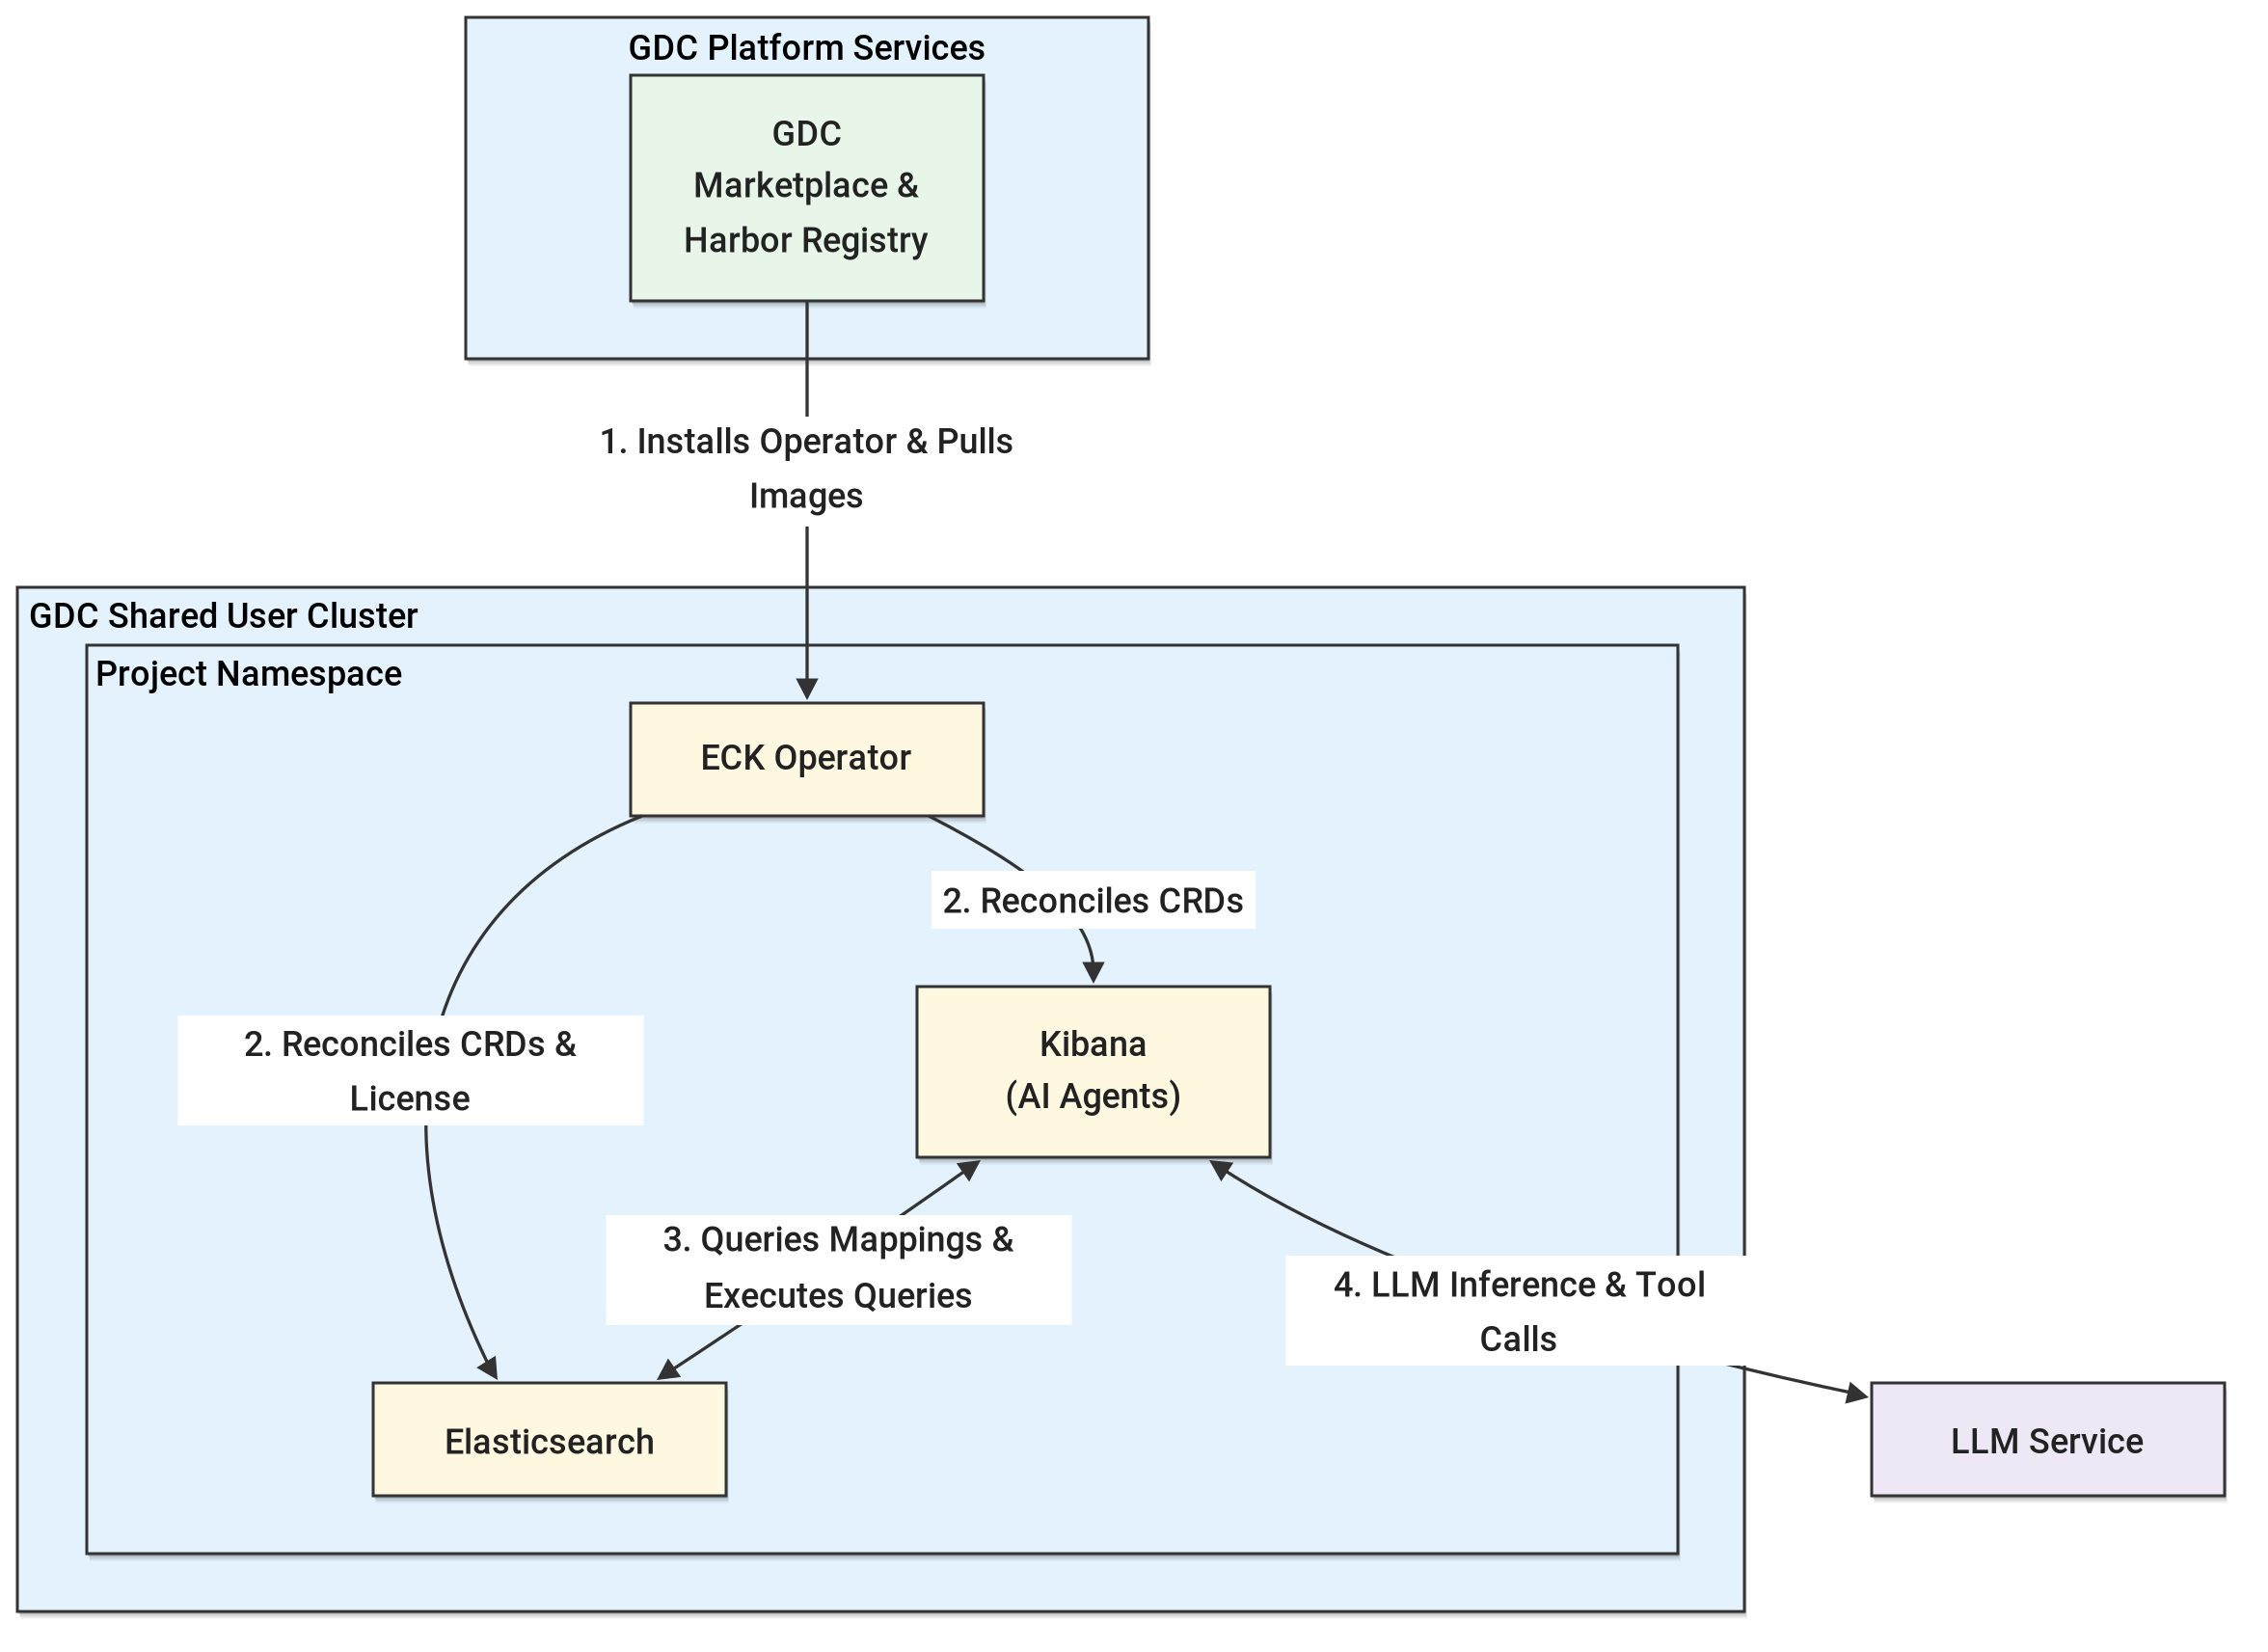
Key components of this architecture include:
- GDC shared cluster: An organization-scoped shared Kubernetes cluster attached to multiple projects, hosting GDC Marketplace software packages and application workloads.
- GDC project: The project namespace on the shared cluster that isolates the ECK operator, Elasticsearch cluster, Kibana instance, and associated Kubernetes Secrets and NetworkPolicies.
- Elastic Cloud on Kubernetes (ECK) operator: Installed from the
GDC Marketplace into the project namespace, the
operator manages the
ElasticsearchandKibanacustom resources and reconciles the Elastic license required for generative AI features and external LLM connectors. - Elasticsearch: Stores and indexes operational and security data, and executes search and ES|QL queries generated by Kibana's AI features and agents.
- Kibana: Hosts Elastic's generative AI features, including the Elastic AI Agent (for natural-language log investigation and ES|QL generation), Agent Builder (for building custom conversational agents and tools over Elasticsearch data), and Attack Discovery (for security alert correlation and attack chain analysis). Kibana also manages the LLM action connectors that orchestrate multi-step tool calling between the user, Elasticsearch, and the LLM service.
- LLM service: A managed LLM service (such as Gemini on GDC) or a self-managed inference server (such as Ollama or vLLM) that provides chat completion and tool-calling capabilities to Kibana over the internal GDC network.
Before you begin
Ensure your GDC environment meets the following prerequisites and assumptions before starting the deployment:
- Shared Kubernetes cluster and GDC project: You have access to an existing GDC shared cluster and a GDC project attached to that cluster. The project serves as the namespace container for all Kubernetes resources deployed in this guide. Ensure the cluster has sufficient compute and persistent storage resources to host the ECK operator, Elasticsearch, and Kibana workloads.
- LLM service: You have network access to an LLM service, either the
managed Gemini service (if available in your
GDC environment) or a self-managed OpenAI-compatible
LLM service (for example,
gemma4:31bserved via Ollama or vLLM in a GPU project). Deploying the LLM infrastructure itself is out of scope for this guide, but the specific model and API requirements are detailed in Requirements for the LLM service. Retrieve the version of Elastic that comes with your GDC environment:
export ELASTIC_VERSION=$(curl -sk "https://harbor.${ORG}.${ZONE}.${GDCH_DOMAIN}/api/v2.0/projects/library/repositories/elasticsearch%252Felasticsearch/artifacts" | jq -r '[.[].tags[]?.name] | sort_by(split(".") | map(tonumber)) | last')Configure environment variables that will be referenced throughout this guide. Modify these values as needed to match your specific environment:
# GDC environment configuration
export PROJECT_ID="your-project-id"
export CLUSTER_NAME="your-shared-cluster-name"
export ZONE="your-zone-name"
export USER_NAME="your-gdc-user-email"

# Marketplace package and Elastic Stack configuration
export MARKETPLACE_SERVICE_NAME="elastic"

# LLM service configuration
export LLM_CONNECTOR_NAME="your-llm-connector-name"
export LLM_API_URL="http://your-llm-service-host:11434/v1/chat/completions"
export LLM_MODEL_NAME="your-llm-model-name"
export LLM_API_KEY="your-llm-api-key"
Configure
gdcloud:gdcloud config set project ${PROJECT_ID} gdcloud config set core/zone ${ZONE}Request or bind the required project-level IAM roles for your user in the target GDC project (
${PROJECT_ID}). Based on the GDC Marketplace lifecycle documentation and GDC networking requirements, at least the following project roles are required:- Namespace Admin (
namespace-admin): Full administrative access to create and manage Kubernetes workloads, Secrets, Services, and custom resources within the project namespace on the shared cluster. - Project Viewer (
project-viewer): Read access to view the existing project and its resources in the GDC console and CLI. - Marketplace Editor (
marketplace-editor): Permission to install, upgrade, and uninstall GDC Marketplace software packages in the project. - Project NetworkPolicy Admin (
project-networkpolicy-admin): Permission to configure globalProjectNetworkPolicyrules allowing cross-project and external traffic to reach the Kibana and Elasticsearch LoadBalancer services.
Ask your Organization IAM Admin or Project IAM Admin to grant these roles (or run the following commands if you have IAM administrator privileges):
gdcloud projects add-iam-policy-binding ${PROJECT_ID} \ --member="user:${USER_NAME}" \ --role=namespace-admin gdcloud projects add-iam-policy-binding ${PROJECT_ID} \ --member="user:${USER_NAME}" \ --role=project-viewer gdcloud projects add-iam-policy-binding ${PROJECT_ID} \ --member="user:${USER_NAME}" \ --role=marketplace-editor gdcloud projects add-iam-policy-binding ${PROJECT_ID} \ --member="user:${USER_NAME}" \ --role=project-networkpolicy-admin- Namespace Admin (
Retrieve the kubeconfig for the shared cluster and configure a
kushell alias forkubectl:KUBECONFIG=kubeconfig-${CLUSTER_NAME}.yaml gdcloud clusters \ get-credentials ${CLUSTER_NAME} \ --zone ${ZONE} alias ku="kubectl --kubeconfig=kubeconfig-${CLUSTER_NAME}.yaml"
Install the Elastic Marketplace package
In this section, you install the Elastic Cloud on Kubernetes (ECK) operator into your project namespace from the GDC air-gapped Marketplace following the GDC Marketplace lifecycle guide.
Install via the gdcloud CLI (or GDC console)
List the available Marketplace software packages to confirm the service name and available version:
gdcloud marketplace services listThe output should look similar to the following:
SERVICE      LATEST VERSION
confluent    <CONFLUENT_VERSION>
dataproc     <DATAPROC_VERSION>
elastic      <ECK_OPERATOR_VERSION>
mariadb      <MARIADB_VERSION>
mattermost   <MATTERMOST_VERSION>
mongodb      <MONGODB_VERSION>
neo4j        <NEO4J_VERSION>
redis        <REDIS_VERSION>
starboard    <STARBOARD_VERSION>
starburst    <STARBURST_VERSION>
tes          <TES_VERSION>
vault        <VAULT_VERSION>
Install the Elastic Marketplace package onto your target shared cluster:
gdcloud marketplace services install ${MARKETPLACE_SERVICE_NAME} \
  --cluster=${CLUSTER_NAME} \
  --zone=${ZONE} \
  --project ${PROJECT_ID}
*(Alternatively, in the GDC console, select your project
${PROJECT_ID}, navigate to Marketplace, select the Elastic Cloud on Kubernetes listing, click Install, select cluster${CLUSTER_NAME}, and click Install.)*Verify that the
elastic-operatorStatefulSet and pod are running in your project namespace (${PROJECT_ID}):ku get statefulset,pods -n ${PROJECT_ID}The output should look similar to the following:
NAME                                READY   AGE
statefulset.apps/elastic-operator   1/1     3m

NAME                   READY   STATUS    RESTARTS   AGE
pod/elastic-operator-0 1/1     Running   0          3m
Deploy the Elastic Stack
Create the Elastic Stack manifest
The GDC Marketplace package deploys the ECK operator pre-configured to pull Elasticsearch and Kibana container images from the local air-gapped Harbor registry.
Create elastic-stack.yaml to deploy a 1-node Elasticsearch cluster, a Kibana
UI instance, LoadBalancer HTTP services, and an allow-all NetworkPolicy in
your project namespace (${PROJECT_ID}). The manifest also includes a license
Secret reconciled by the ECK operator, configured here as a 30-day Enterprise
trial (eck-trial-license) in case you do not have your own Enterprise license
yet:
cat <<EOF > elastic-stack.yaml
apiVersion: v1
kind: Secret
metadata:
  name: eck-trial-license
  namespace: ${PROJECT_ID}
  labels:
    license.k8s.elastic.co/type: enterprise_trial
  annotations:
    elastic.co/eula: accepted
---
apiVersion: elasticsearch.k8s.elastic.co/v1
kind: Elasticsearch
metadata:
  name: elastic-cluster
  namespace: ${PROJECT_ID}
spec:
  version: ${ELASTIC_VERSION}
  http:
    service:
      spec:
        type: LoadBalancer
  nodeSets:
    - name: default
      count: 1
      config:
        # Disable mmap to avoid requiring privileged host sysctl modifications
        node.store.allow_mmap: false
      podTemplate:
        spec:
          initContainers:
            - name: sysctl
              securityContext:
                privileged: false
                allowPrivilegeEscalation: false
                runAsNonRoot: true
                capabilities:
                  drop:
                    - ALL
              command: ["sh", "-c", "true"]
          containers:
            - name: elasticsearch
              resources:
                requests:
                  memory: 2Gi
                  cpu: 500m
                limits:
                  memory: 4Gi
                  cpu: 2
      volumeClaimTemplates:
        - metadata:
            name: elasticsearch-data
          spec:
            accessModes:
              - ReadWriteOnce
            resources:
              requests:
                storage: 10Gi
---
apiVersion: kibana.k8s.elastic.co/v1
kind: Kibana
metadata:
  name: kibana-ui
  namespace: ${PROJECT_ID}
spec:
  version: ${ELASTIC_VERSION}
  count: 1
  elasticsearchRef:
    name: elastic-cluster
  http:
    service:
      spec:
        type: LoadBalancer
  podTemplate:
    spec:
      containers:
        - name: kibana
          resources:
            requests:
              memory: 1Gi
              cpu: 200m
            limits:
              memory: 2Gi
              cpu: 1
---
apiVersion: networking.k8s.io/v1
kind: NetworkPolicy
metadata:
  name: allow-all
  namespace: ${PROJECT_ID}
spec:
  podSelector: {}
  policyTypes:
    - Ingress
  ingress:
    - from:
        - ipBlock:
            cidr: 0.0.0.0/0
EOF
Apply and verify the deployment
Apply the manifest:
ku apply -f elastic-stack.yaml
Apply a global ProjectNetworkPolicy so GDC firewall
rules allow inbound traffic to the LoadBalancer IPs as well as cross-project
traffic (such as communication with the LLM service):
kubectl --kubeconfig=kubeconfig-global.yaml apply -f - <<EOF
apiVersion: networking.global.gdc.goog/v1
kind: ProjectNetworkPolicy
metadata:
  namespace: ${PROJECT_ID}
  name: allow-inbound-traffic-from-external
spec:
  policyType: Ingress
  subject:
    subjectType: UserWorkload
  ingress:
    - from:
        - ipBlock:
            cidr: 0.0.0.0/0
---
apiVersion: networking.global.gdc.goog/v1
kind: ProjectNetworkPolicy
metadata:
  namespace: ${PROJECT_ID}
  name: allow-inbound-traffic-from-all-projects
spec:
  policyType: Ingress
  subject:
    subjectType: UserWorkload
  ingress:
    - from:
        - projects: {}
EOF
Monitor the pods, services, and custom resources until both Elasticsearch and
Kibana reach Running and Ready status and obtain LoadBalancer IPs on
${CLUSTER_NAME}:
ku get pods,svc,elasticsearch,kibana -n ${PROJECT_ID}
Once the resources are ready, the output should look similar to the following:
NAME                                READY   STATUS    RESTARTS   AGE
pod/elastic-cluster-es-default-0    1/1     Running   0          3m
pod/elastic-operator-0              1/1     Running   0          15m
pod/kibana-ui-kb-869844478d-59ptw   1/1     Running   0          3m

NAME                                                                      TYPE           CLUSTER-IP      EXTERNAL-IP    PORT(S)          AGE
service/elastic-cluster-es-default                                        ClusterIP      None            <none>         9200/TCP         11m
service/elastic-cluster-es-http                                           LoadBalancer   10.101.18.181   <ELASTIC_EXTERNAL_IP>   9200:32159/TCP   11m
service/elastic-cluster-es-internal-http                                  ClusterIP      10.101.18.81    <none>         9200/TCP         11m
service/elastic-cluster-es-transport                                      ClusterIP      None            <none>         9300/TCP         11m
service/g-svc-g-fre-elastic-cluster-es-http-shared-clus-extern-56d5eb67   ClusterIP      None            <none>         9200/TCP         11m
service/g-svc-g-fre-kibana-ui-kb-http-shared-cluster-0b-extern-75a78b1f   ClusterIP      None            <none>         5601/TCP         11m
service/kibana-ui-kb-http                                                 LoadBalancer   10.101.19.86    <KIBANA_EXTERNAL_IP>   5601:32735/TCP   11m

NAME                                                         HEALTH   NODES   VERSION             PHASE   AGE
elasticsearch.elasticsearch.k8s.elastic.co/elastic-cluster   green    1       <ELASTIC_VERSION>   Ready   3m

NAME                                     HEALTH   NODES   VERSION             AGE
kibana.kibana.k8s.elastic.co/kibana-ui   green    1       <ELASTIC_VERSION>   3m
Export the external LoadBalancer IPs assigned to Elasticsearch and Kibana for use in subsequent steps:
export ELASTICSEARCH_IP=$(ku get svc elastic-cluster-es-http \
  -n ${PROJECT_ID} \
  -o jsonpath='{.status.loadBalancer.ingress[0].ip}')

export KIBANA_IP=$(ku get svc kibana-ui-kb-http \
  -n ${PROJECT_ID} \
  -o jsonpath='{.status.loadBalancer.ingress[0].ip}')

echo "Kibana External URL:        https://${KIBANA_IP}:5601"
echo "Elasticsearch External URL: https://${ELASTICSEARCH_IP}:9200"
Retrieve credentials and access the Kibana UI
Retrieve the elastic superuser password
ECK automatically generates a Kubernetes Secret
(elastic-cluster-es-elastic-user) containing the default elastic superuser
password. Retrieve and decode it with:
export ELASTIC_PASSWORD=$(ku get secret elastic-cluster-es-elastic-user \
  -n ${PROJECT_ID} \
  -o jsonpath='{.data.elastic}' | base64 -d)
echo "${ELASTIC_PASSWORD}"
Verify connectivity and log in
Verify Elasticsearch is reachable over HTTPS from your workstation:
curl -sk -u "elastic:${ELASTIC_PASSWORD}" "https://${ELASTICSEARCH_IP}:9200"Open
https://${KIBANA_IP}:5601in your browser, accept the self-signed certificate warning, and sign in with:- Username:
elastic - Password:
<output from ELASTIC_PASSWORD above>
- Username:
Verify the Elastic license
Elastic's generative AI features (including the Elastic AI Agent, Agent Builder, and Attack Discovery) and external LLM connectors require an Enterprise license (or an active 30-day Enterprise trial license).
When an Elasticsearch cluster is managed by the ECK operator, ECK's
license-controller continuously reconciles the cluster license against
Kubernetes Secrets in the operator namespace (${PROJECT_ID}). If you do not
yet have a production Enterprise license, the eck-trial-license Secret
included in elastic-stack.yaml (license.k8s.elastic.co/type:
enterprise_trial) instructs ECK to provision and maintain a 30-day Enterprise
trial license automatically. (Note that starting a trial manually via POST
/_license/start_trial without an ECK license Secret will cause ECK to revert
the cluster back to basic on the next reconciliation cycle.)
To verify the active license via the CLI:
curl -sk -u "elastic:${ELASTIC_PASSWORD}" \
  "https://${ELASTICSEARCH_IP}:9200/_license" | jq .
*(Alternatively, in Kibana, open the navigation menu and go to Management
> Dev Tools, then execute GET /_license in the Console tab.)*
The output should look similar to the following, showing "status": "active"
and "type": "enterprise" (or "type": "trial" if using the trial license):
{
  "license": {
    "status": "active",
    "uid": "d8c2b566-8c2b-436c-a1ea-5502d6790505",
    "type": "trial",
    "issue_date": "2026-09-17T23:19:25.053Z",
    "issue_date_in_millis": 1789687165053,
    "expiry_date": "2026-10-17T23:19:25.053Z",
    "expiry_date_in_millis": 1792279165053,
    "max_nodes": 1000,
    "max_resource_units": null,
    "issued_to": "elastic-cluster",
    "issuer": "elasticsearch",
    "start_date_in_millis": -1
  }
}
Load a built-in sample dataset
To evaluate Elastic's AI features without writing custom data-ingestion
pipelines or requiring external internet access, you can load Kibana's built-in
Sample web logs dataset (kibana_sample_data_logs). Because the sample data
archive is bundled inside the Kibana container image, it installs in seconds in
an air-gapped environment. The dataset populates 14,074 web access log documents
containing client IP addresses (clientip), HTTP status codes (response),
source and destination countries (geo.src, geo.dest), bytes transferred
(bytes), URLs, and user-agent strings.
See
Add sample data in Kibana
and
elastic-datasets-builtin.md
for additional built-in datasets (flights and ecommerce).
Load the dataset
Run the following command to load kibana_sample_data_logs via Kibana's
internal sample data endpoint:
curl -sk -u "elastic:${ELASTIC_PASSWORD}" \
  -X POST "https://${KIBANA_IP}:5601/api/sample_data/logs" \
  -H "kbn-xsrf: true" \
  -H "x-elastic-internal-origin: Kibana"
Verify the sample dataset
Verify that the logs sample dataset is marked as installed in Kibana and
confirm that the backing data stream contains 14,074 documents in
Elasticsearch:
curl -sk -u "elastic:${ELASTIC_PASSWORD}" \
  "https://${KIBANA_IP}:5601/api/sample_data" \
  -H "kbn-xsrf: true" \
  -H "x-elastic-internal-origin: Kibana" \
  | jq '.[] | select(.id == "logs") | {id, name, status}'

curl -sk -u "elastic:${ELASTIC_PASSWORD}" \
  "https://${ELASTICSEARCH_IP}:9200/_cat/indices/kibana_sample_data_logs*?v"
The output should look similar to the following:
{
  "id": "logs",
  "name": "Sample web logs",
  "status": "installed"
}
health status index                                         uuid                   pri rep docs.count docs.deleted store.size pri.store.size dataset.size
yellow open   .ds-kibana_sample_data_logs-2026.09.22-000001 0YivG3oFQQmb-mYqmULr_g   1   1      14074            0      8.7mb          8.7mb        8.7mb
Requirements for the LLM service
In a GDC air-gapped environment, cloud-hosted Elastic Managed LLMs and external public SaaS LLM providers are unreachable. Depending on your GDC environment:
- Managed Gemini on GDC: In GDC environments that offer Gemini as a managed LLM service, you can connect Kibana directly to the managed Gemini service if available.
- Self-managed LLM service: Alternatively, you can connect Elastic to a self-managed LLM service hosted within your GDC environment (for example, on GDC GPU nodes).
Deploying a self-managed LLM service is out of scope for this guide. When provisioning or selecting a self-managed LLM service for Elastic, ensure it satisfies the requirements derived from Elastic's official guides:
- Configure access to LLMs
- Self-managed custom LLMs (see also Connect to vLLM in air-gapped environments)
- LLM and agentic AI observability
Summary of technical requirements
The following points summarize the key API, model capability, context window,
and runtime requirements needed for a self-managed LLM service to work reliably
with Elastic's AI Agent, Agent Builder, and Attack Discovery. Note that specific
configuration parameter names cited in the following sections (such as num_ctx, num_predict,
repeat_penalty, repeat_last_n, OLLAMA_FLASH_ATTENTION, and
OLLAMA_NUM_PARALLEL) are provided using Ollama as an example. Apply the
equivalent settings if you use another inference engine such as vLLM.
- OpenAI-compatible chat completions API (
/v1/chat/completions) with native function calling:- Any self-managed inference server (such as Ollama or vLLM) that exposes
an OpenAI-compatible
/v1/chat/completionsendpoint (including Server-Sent Events streaming via"stream": true) can be integrated using Kibana's OpenAI connector with the provider set to Other (OpenAI Compatible Service). - Enable native function calling (
"enableNativeFunctionCalling":
true
) on the Kibana connector when using models that support cloud native tool calling (such asgemma4:31b). By default ("enableNativeFunctionCalling": false), Kibana uses prompt-based simulated function calling, which is less reliable during nested tool calls and can fail with parsing errors (such asError: Missing name for tool use). Enabling native function calling delegates tool-call formatting directly to the inference server's OpenAItoolsprotocol.
- Any self-managed inference server (such as Ollama or vLLM) that exposes
an OpenAI-compatible
- Instruction-tuned model with native tool and function-calling
capabilities:
- Elastic AI Agent (
elastic-ai-agent) and custom Agent Builder agents rely on multi-step tool calling (platform.core.list_indices,platform.core.get_index_mapping,platform.core.search,platform.core.execute_esql, andplatform.core.cases). They use these tools to discover index mappings, generate and execute ES|QL queries against Elasticsearch, and synthesize findings. - The chosen model must be instruction-tuned and capable of generating valid cloud native tool invocations, structured JSON outputs, and ES|QL queries. Refer to Elastic's LLM performance matrix for Observability and LLM performance matrix for Elastic Security for model evaluation criteria.
- Elastic AI Agent (
- Context window of at least
128,000tokens (for example,num_ctx: 131072in Ollama):- While Elastic's general
self-managed custom LLM documentation
cites a 64,000-token minimum, a 128,000-token context window
(
131,072tokens) is strongly recommended for Elastic AI Agent (elastic-ai-agent). - During multi-step investigations, the agent combines system instructions and tool definitions with index schemas, ES|QL documentation, and raw search results (for example, retrieving up to 100 sample documents to inspect field values before aggregating). A single investigation can exceed 70,000 tokens in conversation history, which causes a 64,000-token context window to truncate the prompt mid-conversation.
- Note that in Ollama, a
PARAMETER num_ctxdirective baked into a model'sModelfileoverrides the container'sOLLAMA_CONTEXT_LENGTHenvironment variable. Ensure bothOLLAMA_CONTEXT_LENGTH=131072andPARAMETER num_ctx 131072in the model'sModelfileare configured (on an 80 GB NVIDIA A100 or H100 GPU,gemma4:31bat128Kcontext fits comfortably in VRAM).
- While Elastic's general
self-managed custom LLM documentation
cites a 64,000-token minimum, a 128,000-token context window
(
- Output token limit and gentle repetition penalty (for example,
num_predict: 8192andrepeat_penalty: 1.05in Ollama):- Kibana's OpenAI stream adapter treats
"finish_reason": "length"as a fatalToken limit reachederror and sends"temperature": 0(greedy decoding) in every request. - For reasoning-capable models (such as
gemma4:31b, which generates internal thought tokens before emitting tool calls), configure an output token limit of at least8,192tokens and a gentle repetition penalty. For example, in Ollama, setnum_predict: 8192,repeat_penalty: 1.05, andrepeat_last_n: 64. Avoid overly aggressive repetition penalties (such as1.15+over large windows), as they penalize the model when copying an ES|QL query from its internal reasoning block into the final tool-call JSON.
- Kibana's OpenAI stream adapter treats
- GPU acceleration, Flash Attention, and parallel KV cache slots (<60s
per turn):
- Kibana's OpenAI connector enforces a default 60-second HTTP timeout per streaming turn.
- Because a single agent turn can trigger nested LLM sub-calls (for example, to translate natural-language search requests into ES|QL queries while the main agent conversation is active), running an inference server with only a single KV cache slot can cause sub-calls to evict the main conversation's cached context and slow down subsequent turns.
- In Ollama, set
OLLAMA_FLASH_ATTENTION=1andOLLAMA_NUM_PARALLEL=2so that Flash Attention accelerates long-context evaluation and the main conversation and nested sub-calls maintain separate KV cache slots in GPU memory.
Configure the LLM connector in Kibana
Once your OpenAI-compatible LLM service is running and reachable from the Kibana pod, configure an OpenAI connector in Kibana using either the CLI or the Kibana UI.
Option 1: Create the connector via the CLI
Run the following
POST /api/actions/connectorcommand to create an OpenAI (.gen-ai) connector pointing to your LLM service (${LLM_API_URL}) with native function calling enabled ("enableNativeFunctionCalling": true). Kibana automatically generates and assigns a unique connector ID:curl -sk -u "elastic:${ELASTIC_PASSWORD}" \ -X POST "https://${KIBANA_IP}:5601/api/actions/connector" \ -H "kbn-xsrf: true" \ -H "Content-Type: application/json" \ -d "{ \"name\": \"${LLM_CONNECTOR_NAME}\", \"connector_type_id\": \".gen-ai\", \"config\": { \"apiProvider\": \"Other\", \"apiUrl\": \"${LLM_API_URL}\", \"defaultModel\": \"${LLM_MODEL_NAME}\", \"enableNativeFunctionCalling\": true }, \"secrets\": { \"apiKey\": \"${LLM_API_KEY}\" } }" | jq .Verify that the
${LLM_CONNECTOR_NAME}connector exists and has no missing secrets by listing Kibana's connectors and filtering by name:curl -sk -u "elastic:${ELASTIC_PASSWORD}" \ "https://${KIBANA_IP}:5601/api/actions/connectors" \ -H "kbn-xsrf: true" \ | jq ".[] | select(.name == \"${LLM_CONNECTOR_NAME}\")"The output should look similar to the following:
{
  "id": "<GENERATED_CONNECTOR_ID>",
  "name": "<LLM_CONNECTOR_NAME>",
  "config": {
    "apiProvider": "Other",
    "apiUrl": "<LLM_API_URL>",
    "defaultModel": "<LLM_MODEL_NAME>",
    "enableNativeFunctionCalling": true
  },
  "connector_type_id": ".gen-ai",
  "is_preconfigured": false,
  "is_deprecated": false,
  "referenced_by_count": 0,
  "is_missing_secrets": false,
  "is_system_action": false
}
To test live end-to-end connectivity between Kibana and the LLM service from the CLI, look up the auto-generated connector ID by name and invoke its
_executeendpoint:export CONNECTOR_ID=$(curl -sk -u "elastic:${ELASTIC_PASSWORD}" \ "https://${KIBANA_IP}:5601/api/actions/connectors" \ -H "kbn-xsrf: true" \ | jq -r ".[] | select(.name == \"${LLM_CONNECTOR_NAME}\") | .id") curl -sk -u "elastic:${ELASTIC_PASSWORD}" \ -X POST "https://${KIBANA_IP}:5601/api/actions/connector/${CONNECTOR_ID}/_execute" \ -H "kbn-xsrf: true" \ -H "Content-Type: application/json" \ -d "{ \"params\": { \"subAction\": \"invokeAI\", \"subActionParams\": { \"model\": \"${LLM_MODEL_NAME}\", \"messages\": [ { \"role\": \"user\", \"content\": \"Reply with the single word Pong.\" } ] } } }" | jq .The output should look similar to the following, showing
"status": "ok"and the model's response:{ "status": "ok", "data": { "message": "Pong", "usage": { "prompt_tokens": 23, "prompt_tokens_details": { "cached_tokens": 0 }, "completion_tokens": 38, "total_tokens": 61 } }, "connector_id": "<GENERATED_CONNECTOR_ID>" }
Option 2: Create the connector via the Kibana UI
- Sign in to Kibana (
https://${KIBANA_IP}:5601). - Open the main navigation menu and navigate to Management > Alerts and Insights > Connectors.
- Click Create connector and select OpenAI.
- Configure the connector fields:
- Connector name: Enter the value of
${LLM_CONNECTOR_NAME}(for example,Gemma4-31B). - Select an OpenAI provider: Select Other (OpenAI Compatible Service).
- URL: Enter the value of
${LLM_API_URL}(your LLM service's/v1/chat/completionsendpoint). - Default model: Enter the value of
${LLM_MODEL_NAME}(for example,gemma4:31b). - API key: Enter the value of
${LLM_API_KEY}(any non-empty string if your server does not enforce bearer authentication, or your server's API key). - Enable native function calling: Turn on the toggle.
- Connector name: Enter the value of
- Click Save & test to save the connector and immediately open the Test tab.
- In the Test tab, enter a sample prompt (for example,
Reply with the
single word Pong.
) and click Run to verify that Kibana receives a valid response from the LLM service.
Test the LLM integrations
With the kibana_sample_data_logs dataset installed and your LLM connector
verified, you can test Elastic's AI capabilities in Kibana.
Elastic AI Agent
The
Elastic AI Agent
(elastic-ai-agent) is the default conversational agent integrated into Kibana
for exploring and analyzing data across Elasticsearch using natural language.
Powered by your configured LLM connector and built-in Agent Builder tools, the
agent automatically discovers Elasticsearch indices and mappings
(platform.core.list_indices, platform.core.get_index_mapping), generates and
executes ES|QL queries (platform.core.search, platform.core.execute_esql),
and synthesizes findings without requiring you to know the underlying schema
ahead of time. You can also build your own custom agents with tailored
instructions and tools; see
Custom agents with Agent Builder for more
details.
To open and configure the Elastic AI Agent in the Kibana UI:
- Open the main navigation menu in Kibana and select AI Agent (or click
the Ask AI button in the top header bar, or navigate directly to
https://${KIBANA_IP}:5601/app/chat). - Ensure Elastic AI Agent is selected as the active agent and your LLM
connector (
${LLM_CONNECTOR_NAME}) is selected as the model connector.
Example 1: Investigating failed HTTP requests and potential scanners
Ask the Elastic AI Agent to identify the top client IP addresses generating
non-200 HTTP responses in kibana_sample_data_logs, their origin countries,
and whether any of those IPs also had successful HTTP 200 traffic:
Option 1: Via the Kibana UI: Enter the following question in the AI Agent chat prompt:
In kibana_sample_data_logs, which client IP addresses had the most
failed HTTP requests (non-200 status codes), what countries did they come
from, and did any of those IPs also have successful HTTP 200 requests?
Option 2: Via the CLI:
curl -sk -u "elastic:${ELASTIC_PASSWORD}" \
  -X POST "https://${KIBANA_IP}:5601/api/agent_builder/converse" \
  -H "kbn-xsrf: true" \
  -H "Content-Type: application/json" \
  -d "{
    \"agent_id\": \"elastic-ai-agent\",
    \"connector_id\": \"${CONNECTOR_ID}\",
    \"input\": \"In kibana_sample_data_logs, which client IP addresses had the most failed HTTP requests (non-200 status codes), what countries did they come from, and did any of those IPs also have successful HTTP 200 requests?\"
  }" | jq '{
    status: .status,
    tools_called: [.steps[] | select(.type == "tool_call") | {tool_id: .tool_id, params: .params}],
    response: .response.message
  }'
What happens behind the scenes:
- The agent calls
platform.core.get_index_mapping(indices=["kibana_sample_data_logs"])to inspect the available fields (clientip,geo.src,response,bytes,request, etc.). It calls
platform.core.searchto inspect sample documents and confirm that HTTP status codes are stored inresponse, then executes ES|QL aggregations to rank non-200requests byclientipandgeo.srcand check which of the top IPs also recordedresponse == "200"traffic:FROM kibana_sample_data_logs | WHERE response != "200" | STATS failed_count = COUNT(*) BY clientip, geo.src | SORT failed_count DESC | LIMIT 10FROM kibana_sample_data_logs | WHERE clientip IN ("30.156.16.164", "213.235.30.99", "221.241.228.46", "209.94.234.133", "7.127.73.138", "247.240.202.244", "130.125.65.24", "164.85.94.243", "81.194.200.150", "30.145.143.210") AND response == "200" | STATS success_count = COUNT(*) BY clientip
The Elastic AI Agent response should look similar to the following:
The client IP address with the most failed HTTP requests (non-200 status codes) in
kibana_sample_data_logsis 30.156.16.164, which originated from the United States and recorded 100 failed requests.Other top IP addresses with failed requests, all of which also originated from the United States, include:
- 213.235.30.99: 6 failures
- 221.241.228.46: 6 failures
- 209.94.234.133: 6 failures
- 7.127.73.138: 5 failures
- 247.240.202.244: 5 failures
- 130.125.65.24: 5 failures
- 164.85.94.243: 4 failures
- 81.194.200.150: 4 failures
- 30.145.143.210: 4 failures
Regarding successful requests, all of the IPs listed above had at least some successful HTTP 200 responses, except for 30.156.16.164, which had no successful requests.
Example 2: Analyzing traffic volume and payload bytes by HTTP status code
Ask the Elastic AI Agent for the breakdown of HTTP response status codes across
all requests in kibana_sample_data_logs and the total bytes transferred for
each status code:
Option 1: Via the Kibana UI: Start a new conversation in AI Agent and enter the following question:
In kibana_sample_data_logs, what is the breakdown of HTTP response
status codes across all requests, and how much total data (in bytes) was
transferred for each status code?
Option 2: Via the CLI:
curl -sk -u "elastic:${ELASTIC_PASSWORD}" \
  -X POST "https://${KIBANA_IP}:5601/api/agent_builder/converse" \
  -H "kbn-xsrf: true" \
  -H "Content-Type: application/json" \
  -d "{
    \"agent_id\": \"elastic-ai-agent\",
    \"connector_id\": \"${CONNECTOR_ID}\",
    \"input\": \"In kibana_sample_data_logs, what is the breakdown of HTTP response status codes across all requests, and how much total data (in bytes) was transferred for each status code?\"
  }" | jq '{
    status: .status,
    tools_called: [.steps[] | select(.type == "tool_call") | {tool_id: .tool_id, params: .params}],
    response: .response.message
  }'
What happens behind the scenes:
- The agent inspects the
kibana_sample_data_logsschema viaplatform.core.get_index_mapping, identifying theresponse.keywordandbytesfields. It invokes
platform.core.search, which generates and executes the following ES|QL aggregation:FROM kibana_sample_data_logs | STATS request_count = COUNT(*), total_bytes = SUM(bytes) BY response.keyword | LIMIT 100
The Elastic AI Agent response should look similar to the following:
The breakdown of HTTP response status codes and the total data transferred in
kibana_sample_data_logsis as follows:
| Status Code | Request Count | Total Data Transferred (Bytes) |
|---|---|---|
| 200 | 12,832 | 75,681,246 |
| 404 | 801 | 4,044,443 |
| 503 | 441 | 0 |
Custom agents with Agent Builder
Agent Builder
lets you create custom AI agents tailored to specific operational workflows by
combining custom system instructions with built-in tools (such as
platform.core.cases, platform.core.execute_esql, and platform.core.search)
and user-defined tools (esql, index_search, workflow, and mcp).
The following example builds a Web Security Incident Responder agent that
operates directly on the kibana_sample_data_logs dataset. Given a
natural-language prompt, the agent:
- Runs a custom ES|QL tool (
investigate_suspicious_web_clients) to aggregate non-200HTTP responses inkibana_sample_data_logsby client IP. - Distinguishes malicious reconnaissance and exploitation activity
(
30.156.16.164) from benign download failures. - Invokes a custom Kibana Workflow tool (
create_security_case) to automatically open a structured Kibana Security Case with its findings and remediation steps.
Create custom ES|QL and case-creation tools
Create a custom
esqltool namedinvestigate_suspicious_web_clientsthat querieskibana_sample_data_logsfor the top client IP addresses generating non-200HTTP status codes, along with their status codes, origin country (geo.src), user agents (agent), and requested URLs (request):Option 1: Via the Kibana UI:
- In Kibana, open the main navigation menu and go to
Elasticsearch > Agents, then click Manage all tools
(or navigate directly to
https://${KIBANA_IP}:5601/app/agent_builder/tools) and click New tool. Configure the tool fields:
- Tool ID:
investigate_suspicious_web_clients - Type: ES|QL
- Description:
Finds the top client IP addresses generating non-200 HTTP error responses in kibana_sample_data_logs, returning their error count, status codes, source country, user agents, and requested URL paths. - Labels:
security,logs ES|QL Query:
FROM kibana_sample_data_logs | WHERE response != "200" | STATS error_count = COUNT(*), status_codes = VALUES(response), country = VALUES(geo.src), user_agents = VALUES(agent), sample_requests = VALUES(request) BY clientip | SORT error_count DESC | LIMIT 5
- Tool ID:
Click Save.
- In Kibana, open the main navigation menu and go to
Elasticsearch > Agents, then click Manage all tools
(or navigate directly to
Option 2: Via the CLI:
curl -sk -u "elastic:${ELASTIC_PASSWORD}" \
  -X POST "https://${KIBANA_IP}:5601/api/agent_builder/tools" \
  -H "kbn-xsrf: true" \
  -H "Content-Type: application/json" \
  -d '{
    "id": "investigate_suspicious_web_clients",
    "type": "esql",
    "description": "Finds the top client IP addresses generating non-200 HTTP error responses in kibana_sample_data_logs, returning their error count, status codes, source country, user agents, and requested URL paths.",
    "tags": ["security", "logs"],
    "configuration": {
      "query": "FROM kibana_sample_data_logs | WHERE response != \"200\" | STATS error_count = COUNT(*), status_codes = VALUES(response), country = VALUES(geo.src), user_agents = VALUES(agent), sample_requests = VALUES(request) BY clientip | SORT error_count DESC | LIMIT 5",
      "params": {}
    }
  }' | jq '{id: .id, type: .type}'
Because Agent Builder's built-in
platform.core.casestool is read-only (used for searching and retrieving existing cases), create a Kibana Workflow (create-security-case) that invokes Kibana's nativecases.createCasestep, and register it as aworkflowtool namedcreate_security_case:Option 1: Via the Kibana UI:
- Open the main navigation menu and go to Management >
Workflows (or navigate directly to
https://${KIBANA_IP}:5601/app/workflows), then click Create a new workflow. In the YAML editor, paste the following workflow definition and click Save:
version: "1"
name: Create Security Case
description: Creates a new Kibana Case in Elastic Security
enabled: true
triggers:
  - type: manual
inputs:
  - name: title
    type: string
    required: true
    description: Title of the security case
  - name: description
    type: string
    required: true
    description: Detailed markdown description of the incident findings
  - name: severity
    type: string
    default: high
    description: Severity of the case (low, medium, high, critical)
steps:
  - name: create_case
    type: cases.createCase
    with:
      title: ${{ inputs.title }}
      description: ${{ inputs.description }}
      severity: ${{ inputs.severity }}
      owner: securitySolution
      tags:
        - agent-builder
        - web-logs
Return to the Agent Builder Tools page (
https://${KIBANA_IP}:5601/app/agent_builder/tools, or go to Elasticsearch > Agents and click Manage all tools) and click New tool.Configure the workflow tool fields and click Save:
- Tool ID:
create_security_case - Type: Workflow
- Workflow: Select Create Security Case
(
create-security-case) - Description:
Creates a new Kibana Case in Elastic Security with a title, markdown description of the incident findings, and severity (low, medium, high, critical). - Labels:
security,cases
- Tool ID:
- Open the main navigation menu and go to Management >
Workflows (or navigate directly to
Option 2: Via the CLI:
curl -sk -u "elastic:${ELASTIC_PASSWORD}" \
  -X POST "https://${KIBANA_IP}:5601/api/workflows" \
  -H "kbn-xsrf: true" \
  -H "Content-Type: application/json" \
  -d '{
    "workflows": [
      {
        "yaml": "version: \"1\"\nname: Create Security Case\ndescription: Creates a new Kibana Case in Elastic Security\nenabled: true\ntriggers:\n  - type: manual\ninputs:\n  - name: title\n    type: string\n    required: true\n    description: Title of the security case\n  - name: description\n    type: string\n    required: true\n    description: Detailed markdown description of the incident findings\n  - name: severity\n    type: string\n    default: high\n    description: Severity of the case (low, medium, high, critical)\nsteps:\n  - name: create_case\n    type: cases.createCase\n    with:\n      title: ${{ inputs.title }}\n      description: ${{ inputs.description }}\n      severity: ${{ inputs.severity }}\n      owner: securitySolution\n      tags:\n        - agent-builder\n        - web-logs\n"
      }
    ]
  }' | jq '.created[] | {id: .id, valid: .valid}'

curl -sk -u "elastic:${ELASTIC_PASSWORD}" \
  -X POST "https://${KIBANA_IP}:5601/api/agent_builder/tools" \
  -H "kbn-xsrf: true" \
  -H "Content-Type: application/json" \
  -d '{
    "id": "create_security_case",
    "type": "workflow",
    "description": "Creates a new Kibana Case in Elastic Security with a title, markdown description of the incident findings, and severity (low, medium, high, critical).",
    "tags": ["security", "cases"],
    "configuration": {
      "workflow_id": "create-security-case"
    }
  }' | jq '{id: .id, type: .type}'
Create the custom Incident Responder agent
Create the web-security-incident-responder agent and assign it the
investigate_suspicious_web_clients, create_security_case, and
platform.core.cases tools:
Option 1: Via the Kibana UI:
- Open the main navigation menu and go to Elasticsearch >
Agents (or navigate directly to
https://${KIBANA_IP}:5601/app/agent_builder/agents), then click New agent. Configure the agent details:
- Agent ID:
web-security-incident-responder - Display name:
Web Security Incident Responder - Display description:
Investigates suspicious HTTP error activity in web access logs and opens Kibana Security Cases with the findings. - Labels:
security,incident-response Custom Instructions:
You are an automated Web Security Incident Responder. When asked to investigate suspicious web traffic: 1. Call the `investigate_suspicious_web_clients` tool to inspect the top client IPs generating non-200 HTTP responses in `kibana_sample_data_logs`. 2. Identify any client IP exhibiting malicious reconnaissance or exploitation behavior (such as Nmap scans, WordPress login probing, `/etc/passwd` path traversal, or `/level/15/exec` command execution attempts) versus benign download errors. 3. Call the `create_security_case` tool to open a new Kibana Security Case for the malicious client IP. Set an appropriate `title`, `severity` (`high`), and a well-structured Markdown `description` summarizing the source IP, geolocation, total failed requests, observed attack categories (mapped to MITRE ATT&CK where applicable), sample malicious URLs, and recommended remediation steps. 4. Return a concise summary of your investigation and confirm the created Kibana Case details.Tools: Select
investigate_suspicious_web_clients,create_security_case, andplatform.core.cases.
- Agent ID:
Click Save.
- Open the main navigation menu and go to Elasticsearch >
Agents (or navigate directly to
Option 2: Via the CLI:
curl -sk -u "elastic:${ELASTIC_PASSWORD}" \
  -X POST "https://${KIBANA_IP}:5601/api/agent_builder/agents" \
  -H "kbn-xsrf: true" \
  -H "Content-Type: application/json" \
  -d '{
    "id": "web-security-incident-responder",
    "name": "Web Security Incident Responder",
    "description": "Investigates suspicious HTTP error activity in web access logs and opens Kibana Security Cases with the findings.",
    "labels": ["security", "incident-response"],
    "avatar_color": "#E7664C",
    "avatar_symbol": "IR",
    "configuration": {
      "instructions": "You are an automated Web Security Incident Responder. When asked to investigate suspicious web traffic:\n1. Call the `investigate_suspicious_web_clients` tool to inspect the top client IPs generating non-200 HTTP responses in `kibana_sample_data_logs`.\n2. Identify any client IP exhibiting malicious reconnaissance or exploitation behavior (such as Nmap scans, WordPress login probing, `/etc/passwd` path traversal, or `/level/15/exec` command execution attempts) versus benign download errors.\n3. Call the `create_security_case` tool to open a new Kibana Security Case for the malicious client IP. Set an appropriate `title`, `severity` (`high`), and a well-structured Markdown `description` summarizing the source IP, geolocation, total failed requests, observed attack categories (mapped to MITRE ATT&CK where applicable), sample malicious URLs, and recommended remediation steps.\n4. Return a concise summary of your investigation and confirm the created Kibana Case details.",
      "tools": [
        {
          "tool_ids": [
            "investigate_suspicious_web_clients",
            "create_security_case",
            "platform.core.cases"
          ]
        }
      ]
    }
  }' | jq '{id: .id, name: .name}'
Run the agent and verify the Kibana Case
Run a conversation with the Web Security Incident Responder agent:
Option 1: Via the Kibana UI:
- Open the main navigation menu and go to Elasticsearch >
Agents (or navigate directly to
https://${KIBANA_IP}:5601/app/agent_builder). - Select Web Security Incident Responder from the agent selector
and ensure your LLM connector (
${LLM_CONNECTOR_NAME}) is selected. Enter the following prompt:
Investigate the top client IPs generating HTTP errors in our web
logs, identify any attacker performing reconnaissance or
exploitation, and open a high-severity Kibana Security Case with
your findings.
- Open the main navigation menu and go to Elasticsearch >
Agents (or navigate directly to
Option 2: Via the CLI:
curl -sk -u "elastic:${ELASTIC_PASSWORD}" \
  -X POST "https://${KIBANA_IP}:5601/api/agent_builder/converse" \
  -H "kbn-xsrf: true" \
  -H "Content-Type: application/json" \
  -d "{
    \"agent_id\": \"web-security-incident-responder\",
    \"connector_id\": \"${CONNECTOR_ID}\",
    \"input\": \"Investigate the top client IPs generating HTTP errors in our web logs, identify any attacker performing reconnaissance or exploitation, and open a high-severity Kibana Security Case with your findings.\"
  }" | jq '{
    status: .status,
    tools_called: [.steps[] | select(.type == "tool_call") | .tool_id],
    response: .response.message
  }'
The output should look similar to the following:
{
  "status": "completed",
  "tools_called": [
    "investigate_suspicious_web_clients",
    "create_security_case"
  ],
  "response": "I have completed the investigation into the web logs. \n\nThe analysis identified client IP **`30.156.16.164`** (located in the US) as a malicious actor. This IP generated 100 failed requests (HTTP 404) exhibiting clear patterns of reconnaissance and exploitation:\n\n*   **Reconnaissance:** Extensive probing for WordPress installations and plugins, as well as Nmap scan signatures (e.g., `/nmaplowercheck...`).\n*   **Path Traversal:** Attempts to access sensitive system files via `/etc/passwd`.\n*   **Remote Command Execution (RCE):** Attempts to execute commands through paths such as `/level/15/exec`.\n*   **Application Probing:** Targeting common management interfaces including Tomcat, Axis2, and JMX consoles.\n\nAs a result, I have opened a **high-severity** Kibana Security Case to track this incident:\n\n*   **Case ID:** `1f0e00a5-cc89-4f62-b305-f286fae3d70e`\n*   **Title:** Malicious Reconnaissance and Exploitation Attempt from 30.156.16.164\n*   **Recommended Action:** Immediately block the IP at the firewall/WAF and verify that no unauthorized access was achieved."
}
Verify the newly created Kibana Security Case:
Option 1: Via the Kibana UI:
- Open the main navigation menu and go to Security > Cases
(or navigate directly to
https://${KIBANA_IP}:5601/app/security/cases). - Click Malicious Reconnaissance and Exploitation Attempt from 30.156.16.164 to view the formatted Markdown incident summary, MITRE ATT&CK analysis, sample malicious URLs, and remediation checklist.
- Open the main navigation menu and go to Security > Cases
(or navigate directly to
Option 2: Via the CLI:
curl -sk -u "elastic:${ELASTIC_PASSWORD}" \
  "https://${KIBANA_IP}:5601/api/cases/_find" \
  -H "kbn-xsrf: true" \
  | jq '.cases[0] | {id: .id, title: .title, severity: .severity, status: .status, tags: .tags, description: .description}'
The output should look similar to the following:
{
  "id": "1f0e00a5-cc89-4f62-b305-f286fae3d70e",
  "title": "Malicious Reconnaissance and Exploitation Attempt from 30.156.16.164",
  "severity": "high",
  "status": "open",
  "tags": [
    "agent-builder",
    "web-logs"
  ],
  "description": "### Incident Summary\n**Source IP:** `30.156.16.164`\n**Geolocation:** US\n**Total Failed Requests:** 100\n**Status Codes Observed:** 404\n\n### Analysis\nThe client IP exhibited clear patterns of malicious reconnaissance and exploitation attempts:\n\n- **Reconnaissance (MITRE ATT&CK T1595):** Extensive probing for WordPress installations (`/wp-login.php`, various plugin paths) and Nmap scan signatures (`/nmaplowercheck...`).\n- **Path Traversal (MITRE ATT&CK T1083):** Attempted to access sensitive system files via `/cgi-bin/mj_wwwusr?passw=&list=GLOBAL&user=&func=help&extra=/../../../../../../../../etc/passwd`.\n- **Remote Command Execution (MITRE ATT&CK T1203):** Attempts to execute commands via paths like `/level/15/exec/-/configure/http`.\n- **Application Probing:** Targeted common management interfaces such as `/tomcat/manager/html/`, `/axis2/axis2-admin/`, and `/jmx-console/`.\n\n### Sample Malicious URLs\n- `/cgi-bin/mj_wwwusr?passw=&list=GLOBAL&user=&func=help&extra=/../../../../../../../../etc/passwd`\n- `/level/15/exec/-/configure/http`\n- `/nmaplowercheck1331872976`\n- `/wp-login.php`\n\n### Recommended Remediation\n1. **Block IP:** Immediately block `30.156.16.164` at the network firewall/WAF.\n2. **Log Review:** Verify that all requests from this IP resulted in 404 errors and no unauthorized access was gained.\n3. **Hardening:** Ensure that sensitive directories (e.g., `/cgi-bin/`, `/manager/`) are properly restricted."
}
Attack Discovery
Attack Discovery
is an AI feature in Elastic Security that analyzes open security alerts, maps
them to the MITRE ATT&CK framework, and correlates related alerts, IP
addresses, and user accounts into visual attack chains. Because Attack Discovery
requires a large model to synthesize multi-alert structured JSON outputs
reliably, use a 30B-class or larger model (such as gemma4:31b).
Generate security alerts from the sample logs
By default, the kibana_sample_data_logs dataset contains raw web access logs
and does not populate the Elastic Security alerts index
(.alerts-security.alerts-default). In addition, Kibana's sample data generator
assigns future @timestamp values (up to 30 days ahead) to the 100 scanning and
exploitation requests from 30.156.16.164, which places them outside the
now-30d to now window queried by Elastic Security detection rules.
To demonstrate Attack Discovery with the sample logs, shift the @timestamp of
30.156.16.164's records back by 30 days, enrich them with Elastic Common
Schema (ECS) source.ip and user.name fields, and create two detection rules
that generate security alerts from those events:
Map
clientiptosource.ip, setuser.name(www-data), and shift@timestampback 30 days on the30.156.16.164records inkibana_sample_data_logs*:curl -sk -u "elastic:${ELASTIC_PASSWORD}" \ -X POST "https://${ELASTICSEARCH_IP}:9200/kibana_sample_data_logs*/_update_by_query?conflicts=proceed&refresh=true" \ -H "Content-Type: application/json" \ -d '{ "query": { "term": { "clientip": "30.156.16.164" } }, "script": { "source": "ctx._source.source = [\"ip\": ctx._source.clientip]; ctx._source.user = [\"name\": \"www-data\"]; ctx._source[\"@timestamp\"] = ZonedDateTime.parse(ctx._source[\"@timestamp\"]).minusDays(30).toString();", "lang": "painless" } }' | jq '{updated: .updated, failures: .failures}'Create two Elastic Security detection rules targeting
kibana_sample_data_logs*. The first rule detects Nmap and WordPress login probing (Reconnaissance), and the second rule detects/etc/passwdpath traversal and remote command execution attempts (Initial Access):curl -sk -u "elastic:${ELASTIC_PASSWORD}" \ -X POST "https://${KIBANA_IP}:5601/api/detection_engine/rules" \ -H "kbn-xsrf: true" \ -H "Content-Type: application/json" \ -d '{ "name": "Suspicious Web Reconnaissance and Vulnerability Scanning", "description": "Detects Nmap active scanning and WordPress login/plugin probing in web access logs.", "risk_score": 47, "severity": "medium", "type": "query", "language": "kuery", "query": "clientip: \"30.156.16.164\" and (request: *nmap* or request: *wp-login*)", "index": ["kibana_sample_data_logs*"], "from": "now-30d", "interval": "1h", "max_signals": 2, "enabled": true, "threat": [ { "framework": "MITRE ATT&CK", "tactic": { "id": "TA0043", "name": "Reconnaissance", "reference": "https://attack.mitre.org/tactics/TA0043/" }, "technique": [ { "id": "T1595", "name": "Active Scanning", "reference": "https://attack.mitre.org/techniques/T1595/" } ] } ] }' | jq '{id: .id, name: .name, enabled: .enabled}' curl -sk -u "elastic:${ELASTIC_PASSWORD}" \ -X POST "https://${KIBANA_IP}:5601/api/detection_engine/rules" \ -H "kbn-xsrf: true" \ -H "Content-Type: application/json" \ -d '{ "name": "Web Path Traversal and Remote Command Execution Attempt", "description": "Detects path traversal attempts targeting /etc/passwd and Cisco IOS privilege level 15 remote command execution (/level/15/exec).", "risk_score": 73, "severity": "high", "type": "query", "language": "kuery", "query": "clientip: \"30.156.16.164\" and (request: *passwd* or request: *exec*)", "index": ["kibana_sample_data_logs*"], "from": "now-30d", "interval": "1h", "max_signals": 2, "enabled": true, "threat": [ { "framework": "MITRE ATT&CK", "tactic": { "id": "TA0001", "name": "Initial Access", "reference": "https://attack.mitre.org/tactics/TA0001/" }, "technique": [ { "id": "T1190", "name": "Exploit Public-Facing Application", "reference": "https://attack.mitre.org/techniques/T1190/" } ] } ] }' | jq '{id: .id, name: .name, enabled: .enabled}'Wait approximately 60 seconds for the initial rule execution to complete, then verify that 4 alerts have been indexed into
.alerts-security.alerts-default:curl -sk -u "elastic:${ELASTIC_PASSWORD}" \ "https://${ELASTICSEARCH_IP}:9200/.alerts-security.alerts-default/_search?size=4" \ | jq '.hits.hits[]._source | {rule: .["kibana.alert.rule.name"], source_ip: .source.ip, user_name: .user.name, request: .request}'The output should look similar to the following:
{
  "rule": "Web Path Traversal and Remote Command Execution Attempt",
  "source_ip": "30.156.16.164",
  "user_name": "www-data",
  "request": "/cgi-bin/mj_wwwusr?passw=&list=GLOBAL&user=&func=help&extra=/../../../../../../../../etc/passwd"
}
{
  "rule": "Web Path Traversal and Remote Command Execution Attempt",
  "source_ip": "30.156.16.164",
  "user_name": "www-data",
  "request": "/cgi-bin/mj_wwwusr?passw=&list=GLOBAL&user=&func=help&extra=/../../../../../../../../etc/passwd"
}
{
  "rule": "Suspicious Web Reconnaissance and Vulnerability Scanning",
  "source_ip": "30.156.16.164",
  "user_name": "www-data",
  "request": "/nmaplowercheck1331872976"
}
{
  "rule": "Suspicious Web Reconnaissance and Vulnerability Scanning",
  "source_ip": "30.156.16.164",
  "user_name": "www-data",
  "request": "/nmaplowercheck1331873003"
}
Run Attack Discovery
- In Kibana, open the main navigation menu and go to Security >
Attack Discovery (or navigate directly to
https://${KIBANA_IP}:5601/app/security/attack_discovery). - Select your LLM connector (
${LLM_CONNECTOR_NAME}) from the connector menu at the top of the page. - Click Generate to analyze the open alerts in
.alerts-security.alerts-default.
You can also trigger and inspect Attack Discovery from the CLI:
export EXECUTION_UUID=$(curl -sk -u "elastic:${ELASTIC_PASSWORD}" \
  -X POST "https://${KIBANA_IP}:5601/api/attack_discovery/_generate" \
  -H "kbn-xsrf: true" \
  -H "elastic-api-version: 2023-10-31" \
  -H "Content-Type: application/json" \
  -d "{
    \"alertsIndexPattern\": \".alerts-security.alerts-default\",
    \"anonymizationFields\": [
      {\"id\": \"_id\", \"field\": \"_id\", \"allowed\": true},
      {\"id\": \"@timestamp\", \"field\": \"@timestamp\", \"allowed\": true},
      {\"id\": \"kibana.alert.original_time\", \"field\": \"kibana.alert.original_time\", \"allowed\": true},
      {\"id\": \"message\", \"field\": \"message\", \"allowed\": true},
      {\"id\": \"kibana.alert.rule.name\", \"field\": \"kibana.alert.rule.name\", \"allowed\": true},
      {\"id\": \"kibana.alert.rule.description\", \"field\": \"kibana.alert.rule.description\", \"allowed\": true},
      {\"id\": \"kibana.alert.severity\", \"field\": \"kibana.alert.severity\", \"allowed\": true},
      {\"id\": \"kibana.alert.risk_score\", \"field\": \"kibana.alert.risk_score\", \"allowed\": true},
      {\"id\": \"kibana.alert.rule.threat.tactic.id\", \"field\": \"kibana.alert.rule.threat.tactic.id\", \"allowed\": true},
      {\"id\": \"kibana.alert.rule.threat.tactic.name\", \"field\": \"kibana.alert.rule.threat.tactic.name\", \"allowed\": true},
      {\"id\": \"kibana.alert.rule.threat.technique.id\", \"field\": \"kibana.alert.rule.threat.technique.id\", \"allowed\": true},
      {\"id\": \"kibana.alert.rule.threat.technique.name\", \"field\": \"kibana.alert.rule.threat.technique.name\", \"allowed\": true},
      {\"id\": \"source.ip\", \"field\": \"source.ip\", \"allowed\": true},
      {\"id\": \"user.name\", \"field\": \"user.name\", \"allowed\": true}
    ],
    \"apiConfig\": {
      \"actionTypeId\": \".gen-ai\",
      \"connectorId\": \"${CONNECTOR_ID}\"
    },
    \"replacements\": {},
    \"size\": 20,
    \"subAction\": \"invokeAI\"
  }" | jq -r '.execution_uuid')

echo "Attack Discovery execution UUID: ${EXECUTION_UUID}"
Once generation finishes (approximately 60–90 seconds), retrieve the discovered attack chain:
curl -sk -u "elastic:${ELASTIC_PASSWORD}" \
  "https://${KIBANA_IP}:5601/api/attack_discovery/_find" \
  -H "kbn-xsrf: true" \
  -H "elastic-api-version: 2023-10-31" \
  | jq '.data[0]'
The generated attack discovery correlates the four alerts into a single incident with linked source IP, user account, and MITRE ATT&CK tactics:
{
  "alert_ids": [
    "05c30118398ea2a8b70c55ce81fdb559dbe14c460a8a95253bd81719415a28b5",
    "73ebaeca440b463ffa5812da5b68a2485d465a648ffaf16385a54d8bae9a53d2",
    "60ae9f16b40cec1bdc27674ade0e5eb69680ccca3d956fbf2a75418843799987",
    "de503ae52444db7712d062c54750f413b90a75521cdfff0de9bdf41a64141346"
  ],
  "alert_rule_uuid": "attack_discovery_ad_hoc_rule_id",
  "alert_start": "2026-10-03T01:05:00.384Z",
  "alert_updated_at": "2026-10-03T01:05:03.460Z",
  "alert_workflow_status": "open",
  "alert_workflow_status_updated_at": "2026-10-03T01:05:03.460Z",
  "connector_id": "<GENERATED_CONNECTOR_ID>",
  "connector_name": "<GENERATED_CONNECTOR_ID>",
  "details_markdown": "- The attack sequence began at `2026-10-01T12:43:41.756Z` when an actor using IP `30.156.16.164` performed active reconnaissance scanning against the server.\n- Following the initial scan, the attacker attempted to exploit a path traversal vulnerability at `2026-10-01T12:43:51.756Z` and again at `2026-10-01T12:44:02.756Z`, specifically targeting the `/etc/passwd` file via the `mj_wwwusr` CGI endpoint.\n- The activity concluded with further reconnaissance scanning at `2026-10-01T12:44:21.756Z` from the same source IP `30.156.16.164`.\n- All requests were associated with the user `www-data` and resulted in 404 errors, suggesting the attempts were unsuccessful.",
  "entity_summary_markdown": "Activity targeting user `www-data` from source IP `30.156.16.164`.",
  "generation_uuid": "<EXECUTION_UUID>",
  "id": "1f71ed004c7340d5088d242ca2483525a164a9ea9a80a3f90bd1f514d43231bc",
  "mitre_attack_tactics": [
    "Reconnaissance",
    "Initial Access"
  ],
  "risk_score": 240,
  "summary_markdown": "An attacker from `30.156.16.164` performed reconnaissance and path traversal attempts against the system.",
  "timestamp": "2026-10-03T01:05:00.384Z",
  "title": "Web Reconnaissance and Exploitation Attempt",
  "user_id": "elastic",
  "user_name": "elastic",
  "users": [
    {
      "id": "elastic",
      "name": "elastic"
    }
  ],
  "index": ".internal.adhoc.alerts-security.attack.discovery.alerts-default-000001"
}