
The ML.DETECT_CHANGE_POINTS function
This document describes the ML.DETECT_CHANGE_POINTS function, which performs
change point detection to identify intervals where the statistical behavior or
properties of time series data have shifted. This function provides insight
into significant structural breaks, rather than transient or isolated events,
without the overhead of creating and managing a model. For
example, you can use this function to detect a level change in daily product
sales after a marketing campaign.
While standard time series anomaly detection focuses on detecting sudden spikes
or outliers, ML.DETECT_CHANGE_POINTS is optimized to uncover anomalies that
appear gradually over time and sustained structural shifts.
All identified change points are represented
as time windows in which the change occurred, defined by a beginning and an
ending timestamp.
Syntax
ML.DETECT_CHANGE_POINTS(
    { TABLE TABLE_NAME | (QUERY_STATEMENT) },
    data_col => 'DATA_COL',
    timestamp_col => 'TIMESTAMP_COL'
    [, id_cols => ID_COLS]
)
Arguments
The ML.DETECT_CHANGE_POINTS function takes the following arguments:
TABLE_NAME: the name of the table that contains the time series data to analyze.QUERY_STATEMENT: a GoogleSQL query that produces the time series data to analyze.DATA_COL: aSTRINGvalue that specifies the name of the column that contains the time series data. The data column must use one of the following data types:INT64,NUMERIC,BIGNUMERIC, orFLOAT64.TIMESTAMP_COL: aSTRINGvalue that specifies the name of the column that contains the timestamp data. The timestamp column must use one of the following data types:TIMESTAMP,DATE, orDATETIME.ID_COLS: anARRAY<STRING>value that specifies the names of one or more ID columns. Each unique combination of IDs identifies a unique time series to analyze. Specify one or more values for this argument to analyze multiple time series using a single query. The columns that you specify must use one of the following data types:STRING,INT64,ARRAY<STRING>, orARRAY<INT64>.
Output
ML.DETECT_CHANGE_POINTS returns a table with the following columns:
- The columns specified in the
ID_COLSargument. begin_timestamp: aTIMESTAMPvalue that corresponds to the start of the change point.end_timestamp: aTIMESTAMPvalue that corresponds to the end of the change point.metrics: aSTRUCTvalue that contains metrics that describe the statistical behavior of the change point:avg: aFLOAT64value that contains the average metric value within the change point.min: aFLOAT64value that contains the minimum metric value within the change point.max: aFLOAT64value that contains the maximum metric value within the change point.stddev: aFLOAT64value that contains the standard deviation within the change point.count: anINT64value that contains the total count of data points in the change point.
status: aSTRINGvalue that contains error messages for invalid input. This column is empty for successful requests.
Example
The following query shows how to detect change points in the number of taxi rides taken per day:
WITH
  daily_trips AS (
    SELECT
      EXTRACT(DATE FROM pickup_datetime) AS trip_date, COUNT(*) AS total_trips
    FROM `bigquery-public-data.new_york_taxi_trips.tlc_yellow_trips_20*`
    WHERE
      _TABLE_SUFFIX BETWEEN '19' AND '20'
      AND EXTRACT(DATE FROM pickup_datetime)
        BETWEEN '2019-01-01'
        AND '2020-12-31'
    GROUP BY trip_date
  )
SELECT *
FROM
  ML.DETECT_CHANGE_POINTS(
    TABLE daily_trips, data_col => 'total_trips', timestamp_col => 'trip_date');
The result is similar to the following:
+-------------------------+-------------------------+-------------+-------------+-------------+----------------+---------------+--------+
| begin_timestamp         | end_timestamp           | metrics.avg | metrics.min | metrics.max | metrics.stddev | metrics.count | status |
+-------------------------+-------------------------+-------------+-------------+-------------+----------------+---------------+--------+
| 2019-12-19 00:00:00 UTC | 2020-01-04 00:00:00 UTC | 182990.2352 | 101917.0    | 286932.0    | 43974.28308757 | 17            |        |
| 2020-03-06 00:00:00 UTC | 2020-03-22 00:00:00 UTC | 108567.2941 | 10341.0     | 243743.0    | 77690.85919106 | 17            |        |
+-------------------------+-------------------------+-------------+-------------+-------------+----------------+---------------+--------+
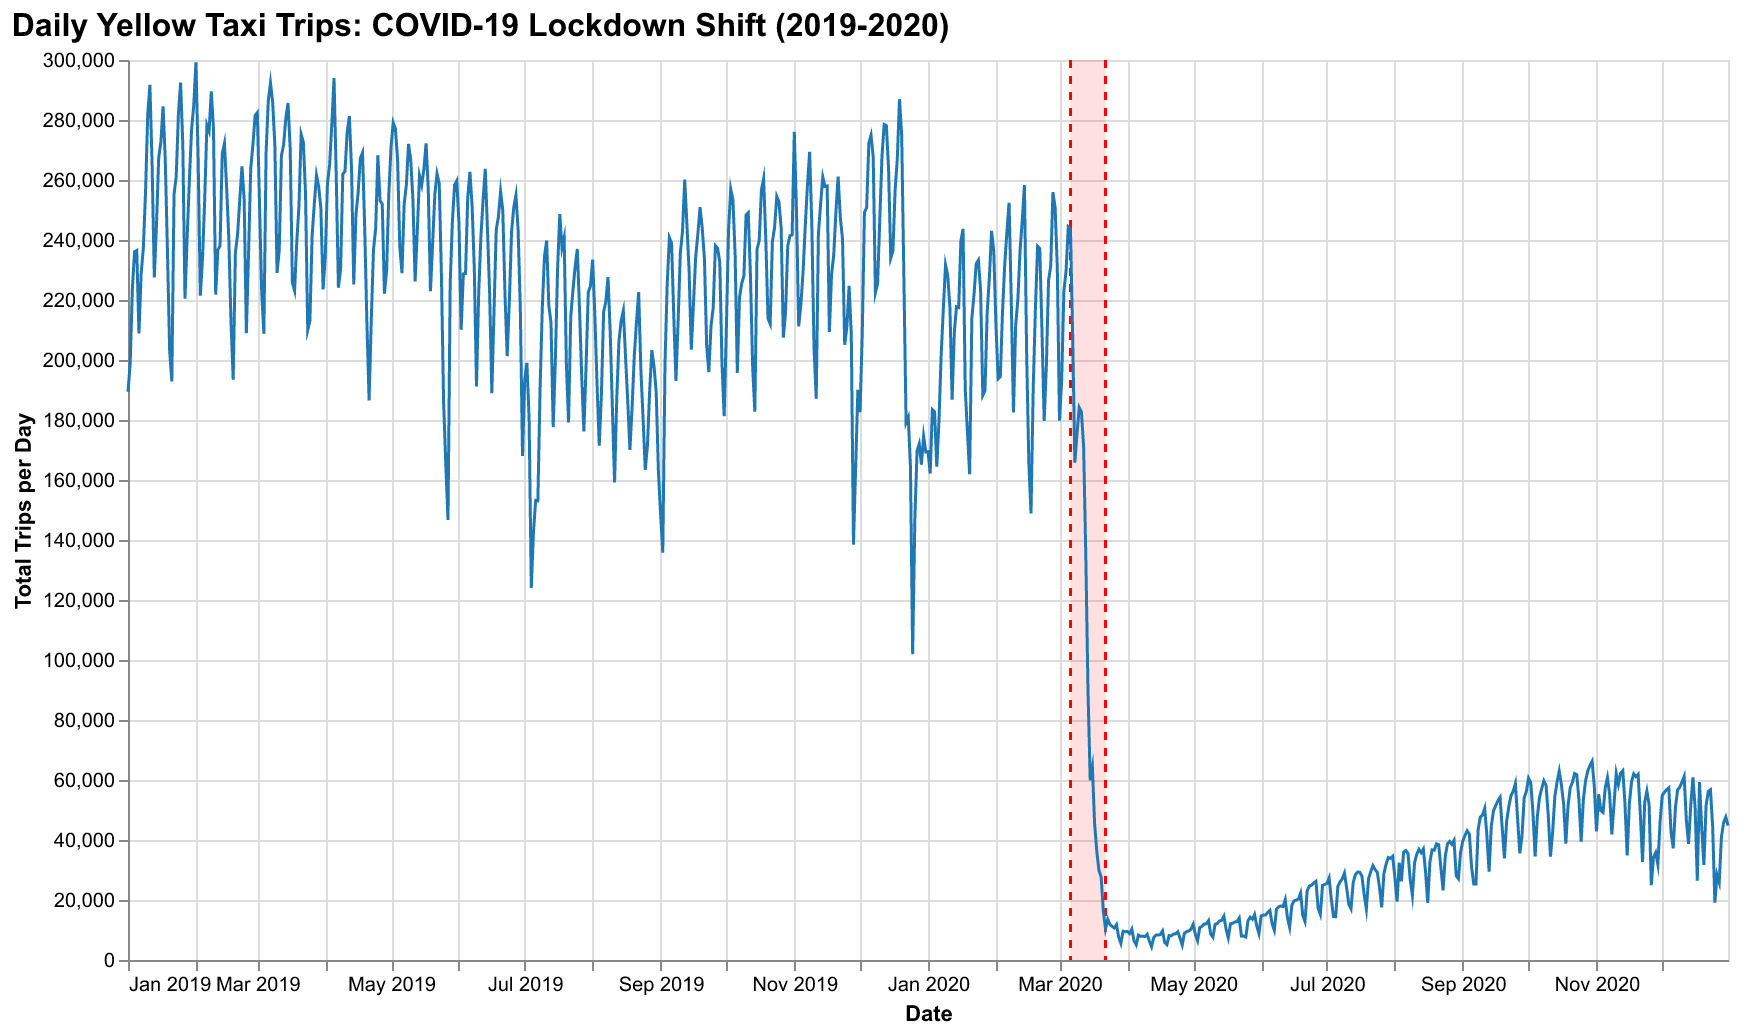
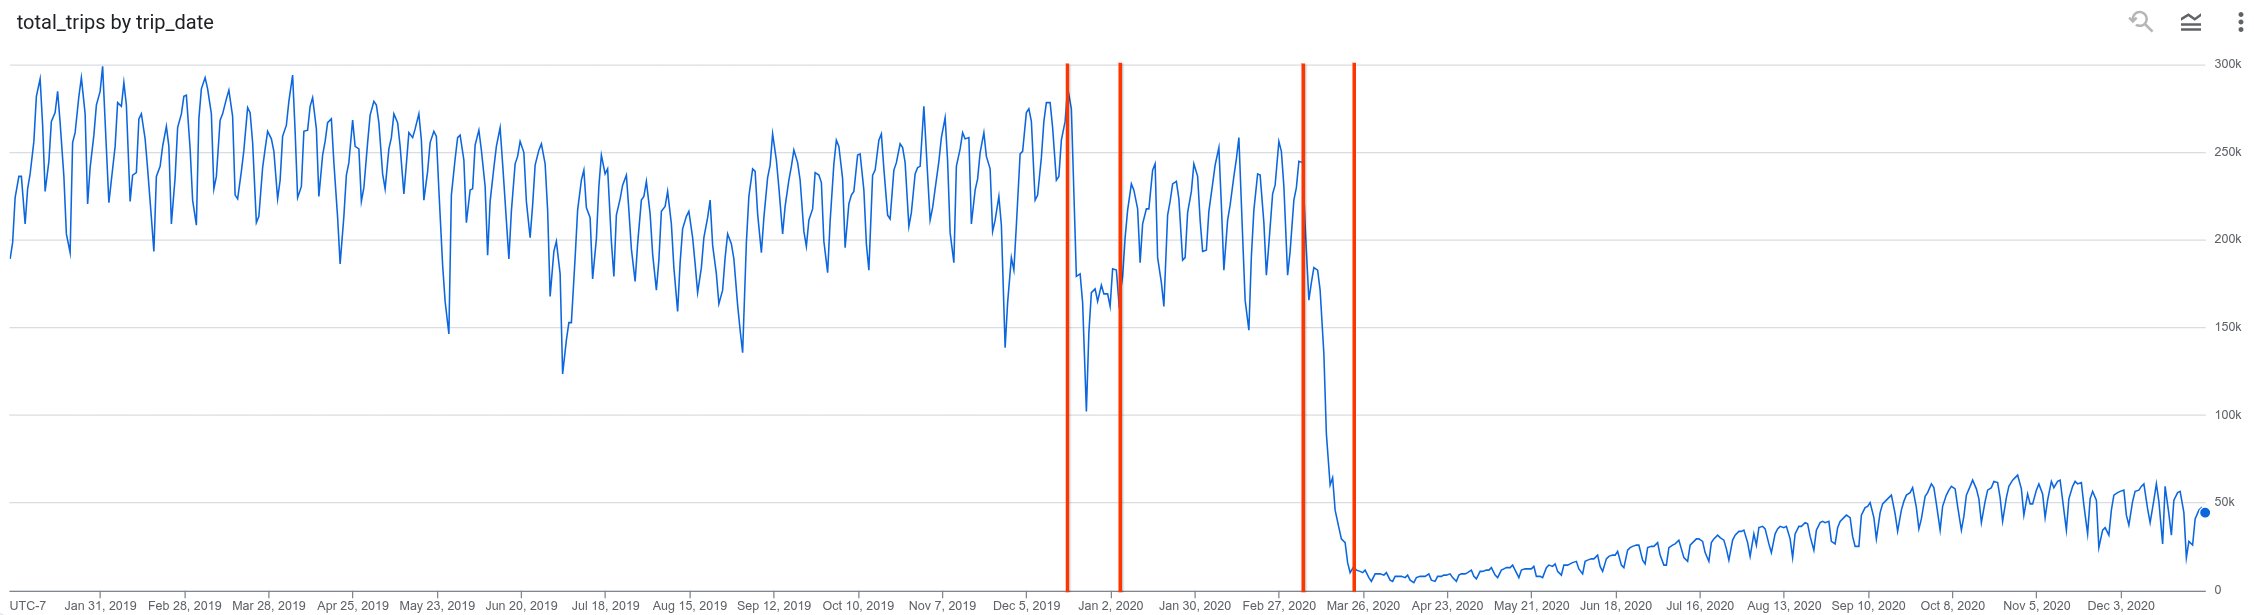
The following graph shows taxi ridership by date. The beginning and end of each of the two change points is marked by a vertical line.
- The first change point reflects a small overall decrease in ridership. The shift begins December 19, 2019 and stabilizes January 1, 2020.
- The second change point reflects a much larger overall reduction in ridership. The shift begins March 6, 2020 and stabilizes March 22, 2020.
What's next
- Learn more about forecasting.
- Learn more about anomaly detection.
- Learn more about the
ML.SEASONALITYfunction, which detects repeating patterns over fixed time periods in your data. - Learn more about the
ML.TRENDfunction, which detects the directional trajectory of a metric over time.