
Create and run a notebook using the notebook gallery
Get started analyzing data by using the notebook gallery in BigQuery Studio.
Before you begin
- Sign in to your Google Cloud account. If you're new to Google Cloud, create an account to evaluate how our products perform in real-world scenarios. New customers also get $300 in free credits to run, test, and deploy workloads.
-
In the Google Cloud console, on the project selector page, select or create a Google Cloud project.
Roles required to select or create a project
- Select a project: Selecting a project doesn't require a specific IAM role—you can select any project that you've been granted a role on.
-
Create a project: To create a project, you need the Project Creator role
(
roles/resourcemanager.projectCreator), which contains theresourcemanager.projects.createpermission. Learn how to grant roles.
-
If you're using an existing project for this guide, verify that you have the permissions required to complete this guide. If you created a new project, then you already have the required permissions.
-
Enable the BigQuery API.
Roles required to enable APIs
To enable APIs, you need the
serviceusage.services.enablepermission. If you created the project, then you likely already have this permission through the Owner role (roles/owner). Otherwise, you can get this permission through the Service Usage Admin role (roles/serviceusage.serviceUsageAdmin). Learn how to grant roles.For new projects, the BigQuery API is automatically enabled.
- Optional: Enable billing for the project. If you don't want to enable billing or provide a credit card, the steps in this document still work. BigQuery provides you a sandbox to perform the steps. For more information, see Enable the BigQuery sandbox.
Required roles
To get the permissions that you need to create a run notebooks, ask your administrator to grant you the following IAM roles on your project:
- BigQuery Read Session User (
roles/bigquery.readSessionUser) - BigQuery Studio User (
roles/bigquery.studioUser)
For more information about granting roles, see Manage access to projects, folders, and organizations.
You might also be able to get the required permissions through custom roles or other predefined roles.
If you're new to notebooks in BigQuery, see required permissions on the Create notebooks page.
Notebook gallery
The notebook gallery is a central hub for discovering and using prebuilt notebook templates. These templates let you perform common tasks like data preparation, data analysis, and visualization. Notebook templates also help you explore BigQuery Studio features, manage workflows, and promote best practices.
You can use notebook gallery templates to streamline your entire intent-to-insights workflow across each stage of the data lifecycle-from ingestion and exploration to advanced analytics and BigQuery ML.
The notebook gallery provides templates for every skill level. The gallery includes fundamental templates for SQL, Python, Apache Spark, and DataFrames. You can also explore topics like generative AI and multimodal data analytics in BigQuery.
For more information on using notebook gallery templates, see Create a notebook using the notebook gallery.
Create a notebook from a notebook gallery template
The following example uses the Introduction to notebooks in BigQuery Studio template. This notebook shows you how to perform these tasks:
- Query data: Run queries using SQL cells.
- Visualize query results: Create visualizations without code by using Visualization cells.
- Clean and transform data: Sort, deduplicate, and filter your data using the BigQuery DataFrames (pandas) API.
- Run AI predictions: Generate predictions using the
(
AI.FORECASTfunction) in BigQuery DataFrames. TheAI.FORECASTfunction uses the TimesFM foundation model to generate predictions directly from a dataset with no model training required. - Plot data: Plot data using Python's built-in visualization libraries. You plot the data using the BigQuery DataFrames visualization library, powered by Matplotlib and Pandas.
To use the notebook, you open the template, convert it to a runnable notebook, connect to the notebook's runtime environment, and then run the notebook.
Open the template and convert it to a runnable notebook
Before you can use a notebook created from a notebook gallery template, you must convert the template to a runnable notebook.
To open the Introduction to notebooks in BigQuery Studio template in notebook gallery, and to convert it to a runnable notebook, follow these steps:
Go to the Studio page.
Click the arrow drop-down and then choose Notebook > All templates.
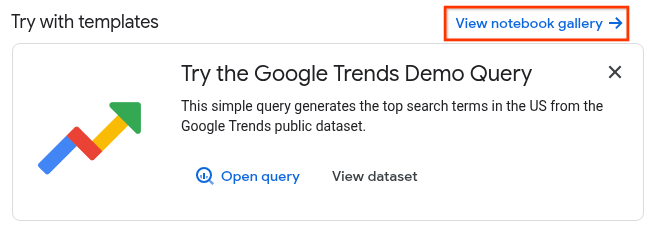
Alternatively, from from the BigQuery Studio home page, click View notebook gallery.
Click the Introduction to notebooks in BigQuery Studio card or search for it in the gallery.
After the template opens, click Use this template to convert the template into a runnable notebook.
Connect to the default runtime
Before you can run the notebook, you must connect it to an Gemini Enterprise Agent Platform runtime. A runtime is a compute resource that runs the code in your notebook. The runtime must be in the same region as your notebook.
For more information about runtimes, see Runtimes and runtime templates. For more information about configuring regional settings, see Set the default region for code assets.
In this tutorial, you use the default runtime. The default runtime is a preset runtime that requires minimal setup. To connect to the default runtime, follow these steps:
With your notebook open, click Connect.
It might take several minutes to connect to the default runtime if you don't already have an active runtime.
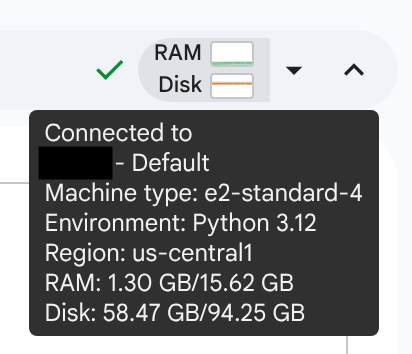
When the runtime is ready, you should see a checkmark with RAM and disk graphs displayed. If you hover over the graphs, you see the type of runtime and the runtime's configuration.
Run the notebook
Introduction to notebooks in BigQuery Studio contains text, SQL, visualization, and code cells. Cells other than text cells can be run individually, or you can run all cells in order from first to last.
In this tutorial, you run the cells in the notebook individually so you can view the results in stages. To run the notebook:
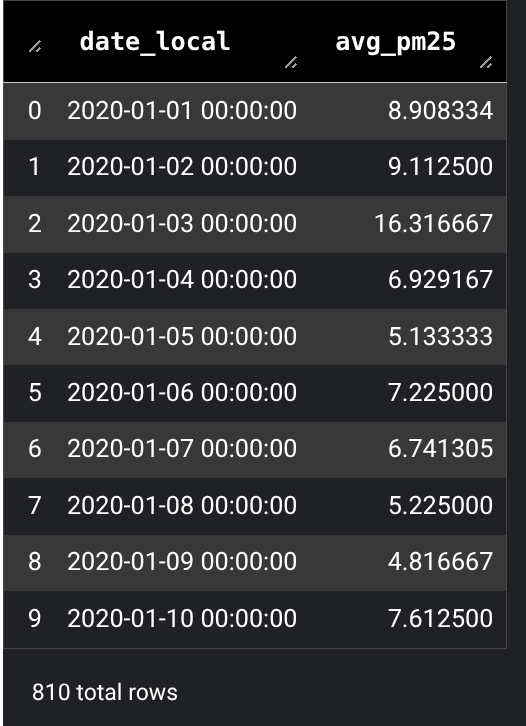
In the Query your data using SQL cells section, hover over the SQL cell, and then click Run cell.
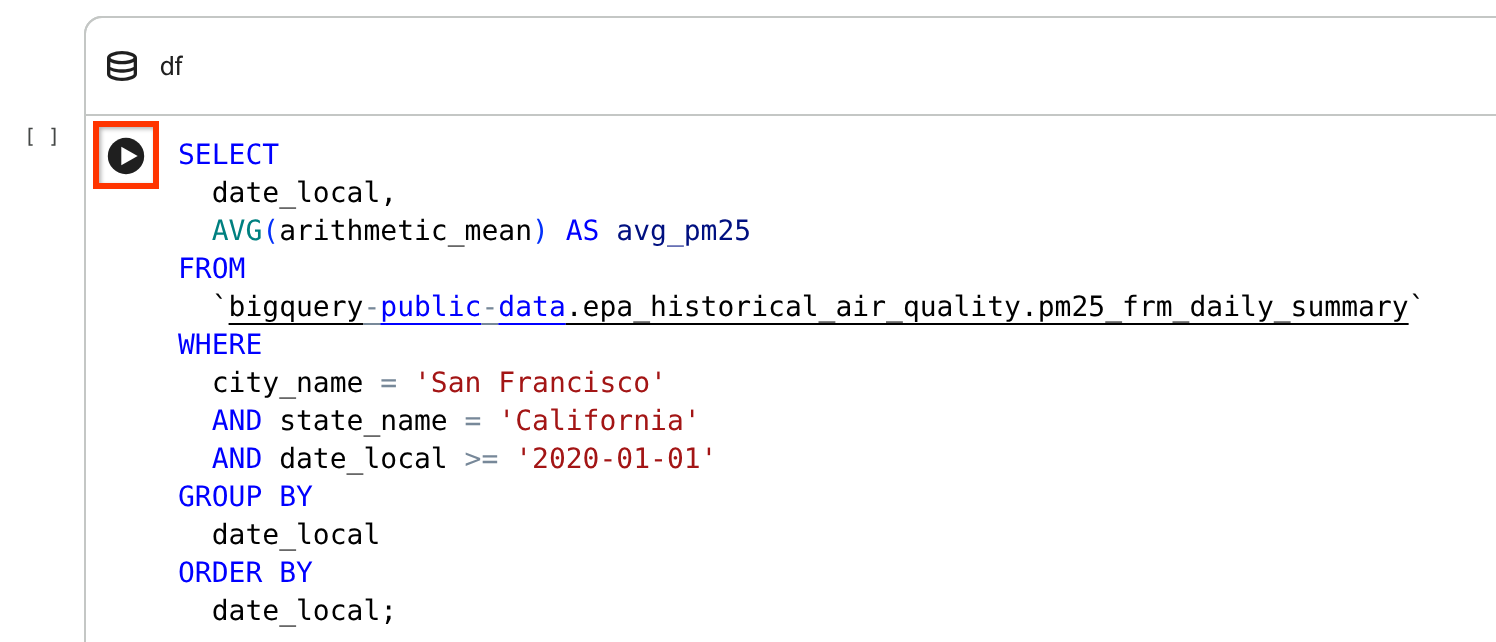
This SQL cell queries the
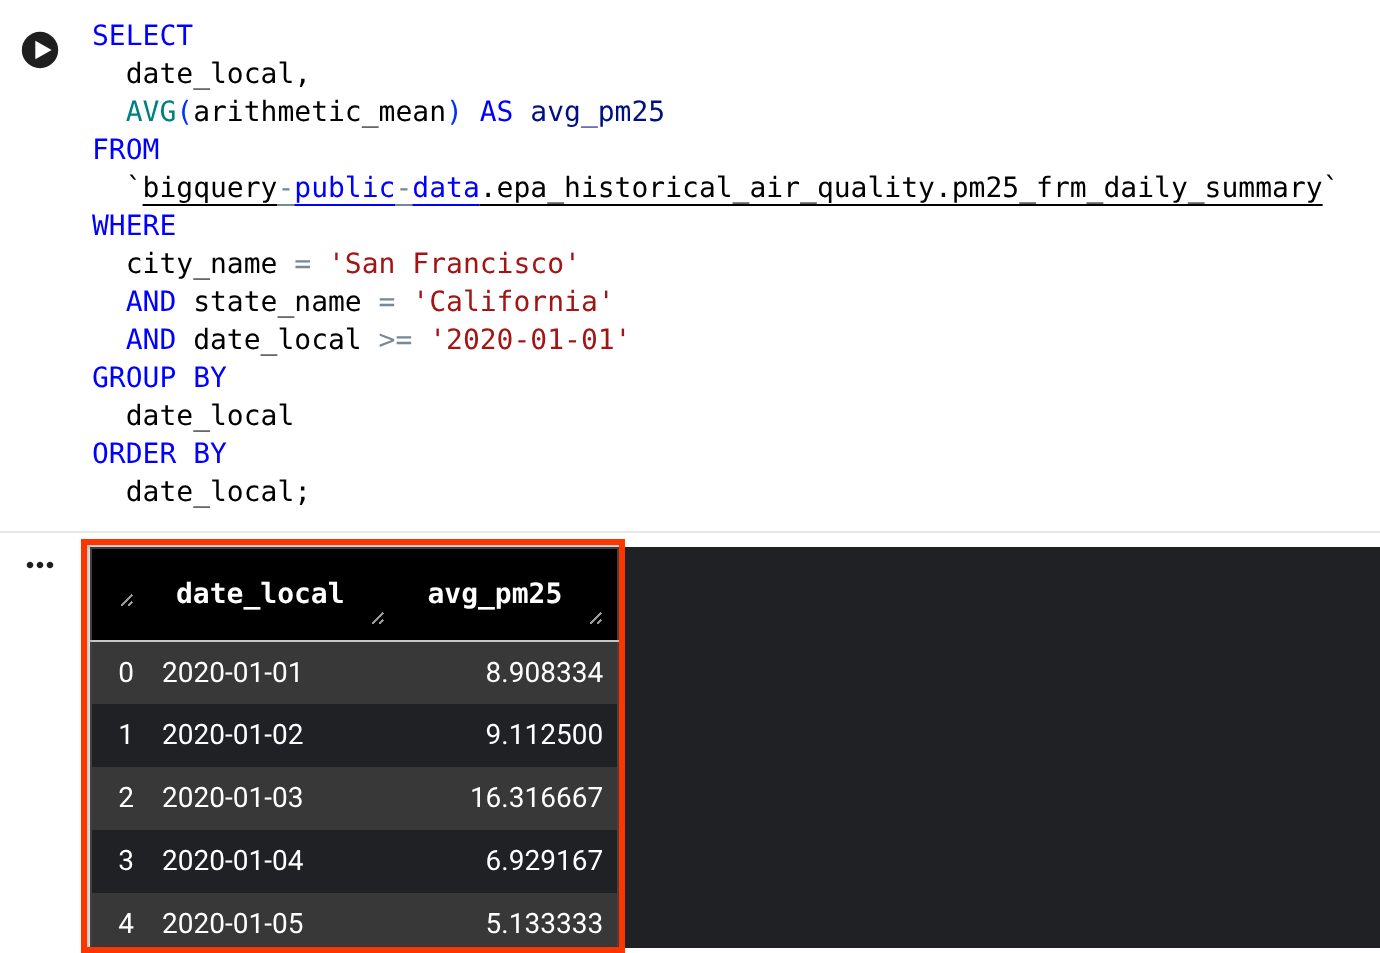
bigquery-public-data.epa_historical_air_quality.pm25_frm_daily_summarytable in the Historical Air Quality public dataset and returns the daily average PM2.5 (a common air quality metric) for San Francisco over the past few years.View the results. The query results are displayed in a DataFrame.
In the Visualize data section, hover over the visualization cell, and then click Run cell.
View the generated visualization.
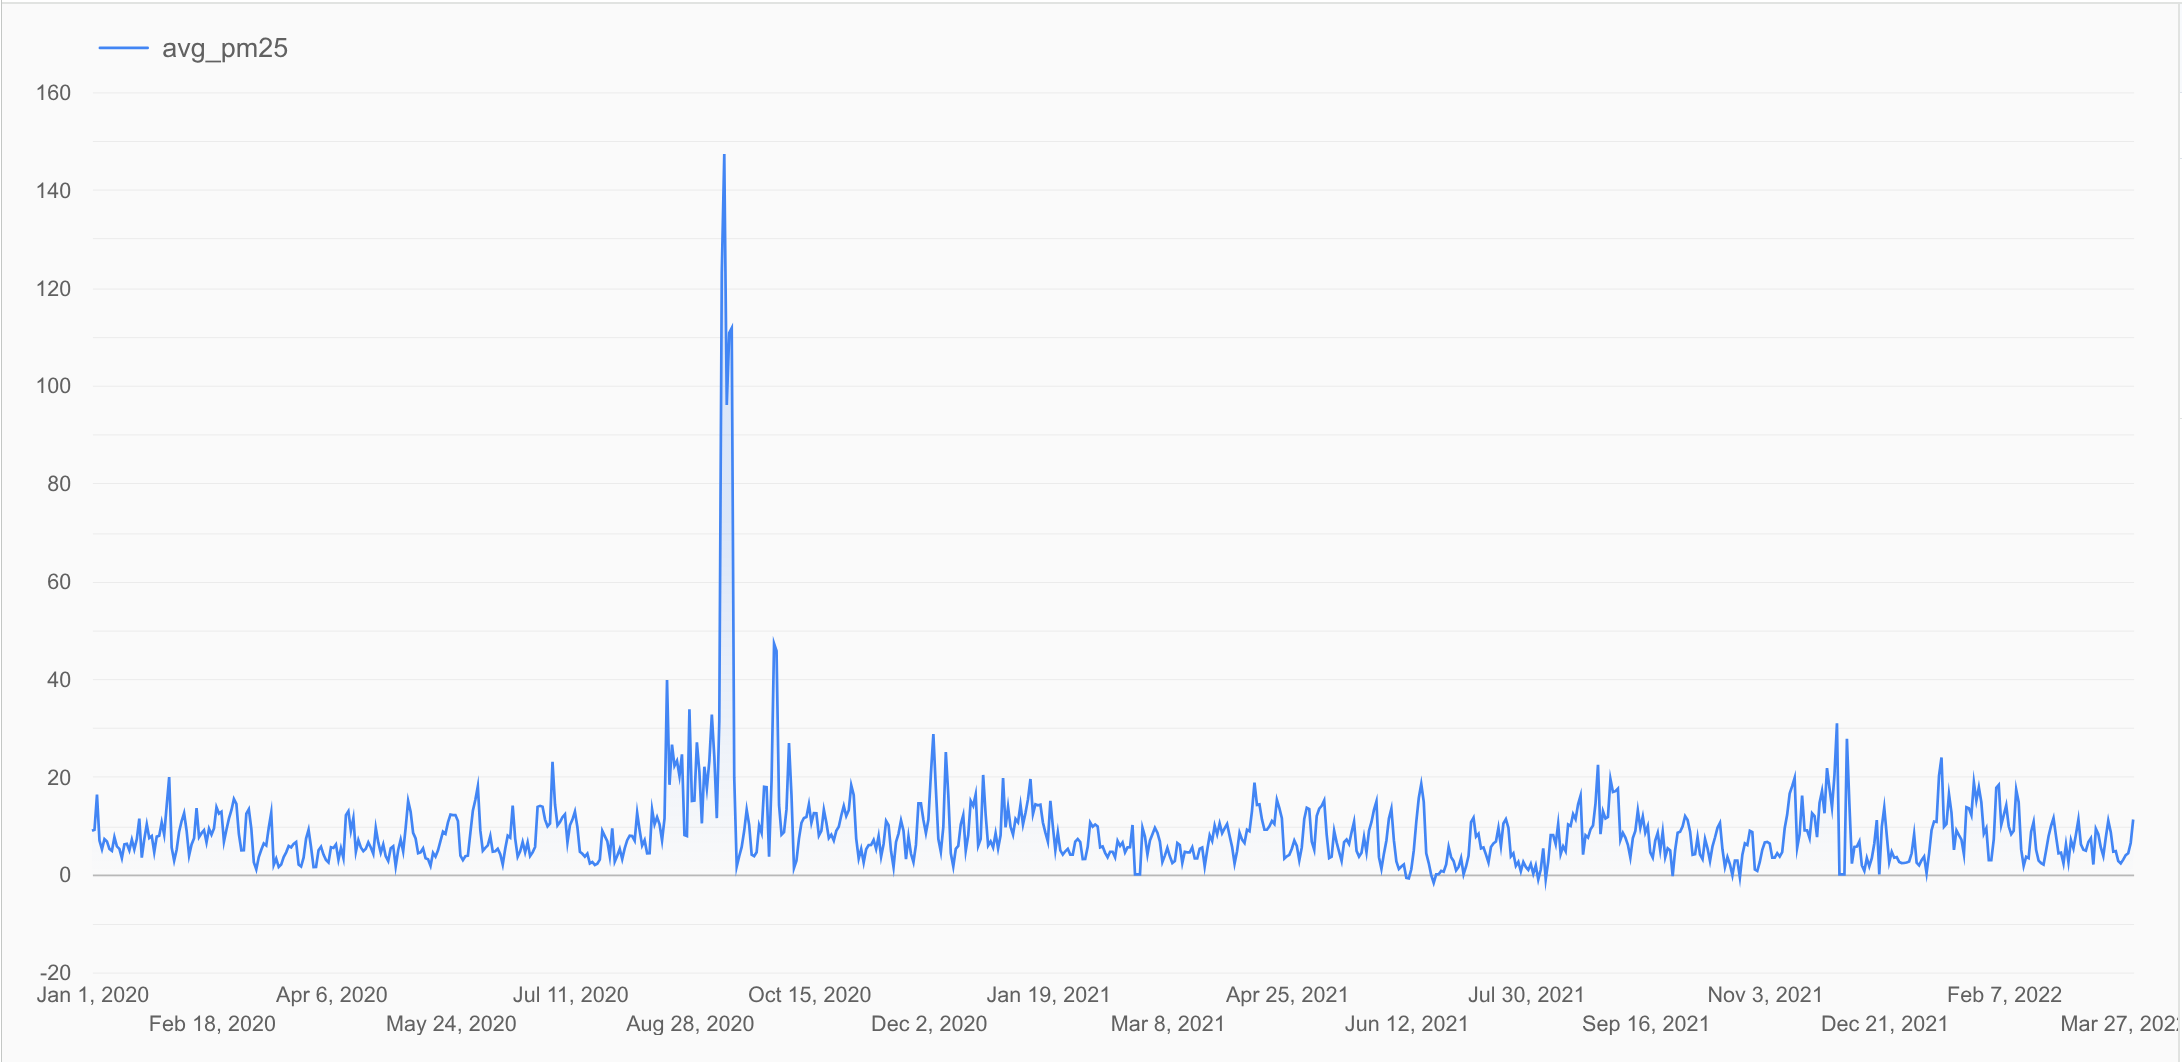
The result shows a time series chart that plots the daily average PM2.5 values in the
dfDataFrame you generated previously. This chart shows the trend in PM2.5 levels over time.In the Clean the data section, hover over the code cell, and then click Run cell.
View the results. The results are displayed in a DataFrame.
The code does the following:
- Import the
bigframes.pandaslibrary. - Ensure the
date_localfield is a timestamp. - Sort the results by date, which is required for forecasting.
- Remove duplicate rows.
- Drop rows where
avg_pm25isnull. - Filter outliers.
- Display the results in a BigQuery DataFrames named
df_cleaned.
- Import the
In the Predict values using
AI.FORECASTsection, hover over the SQL cell, and then click Run cell.View the results. The query results are displayed in a DataFrame..
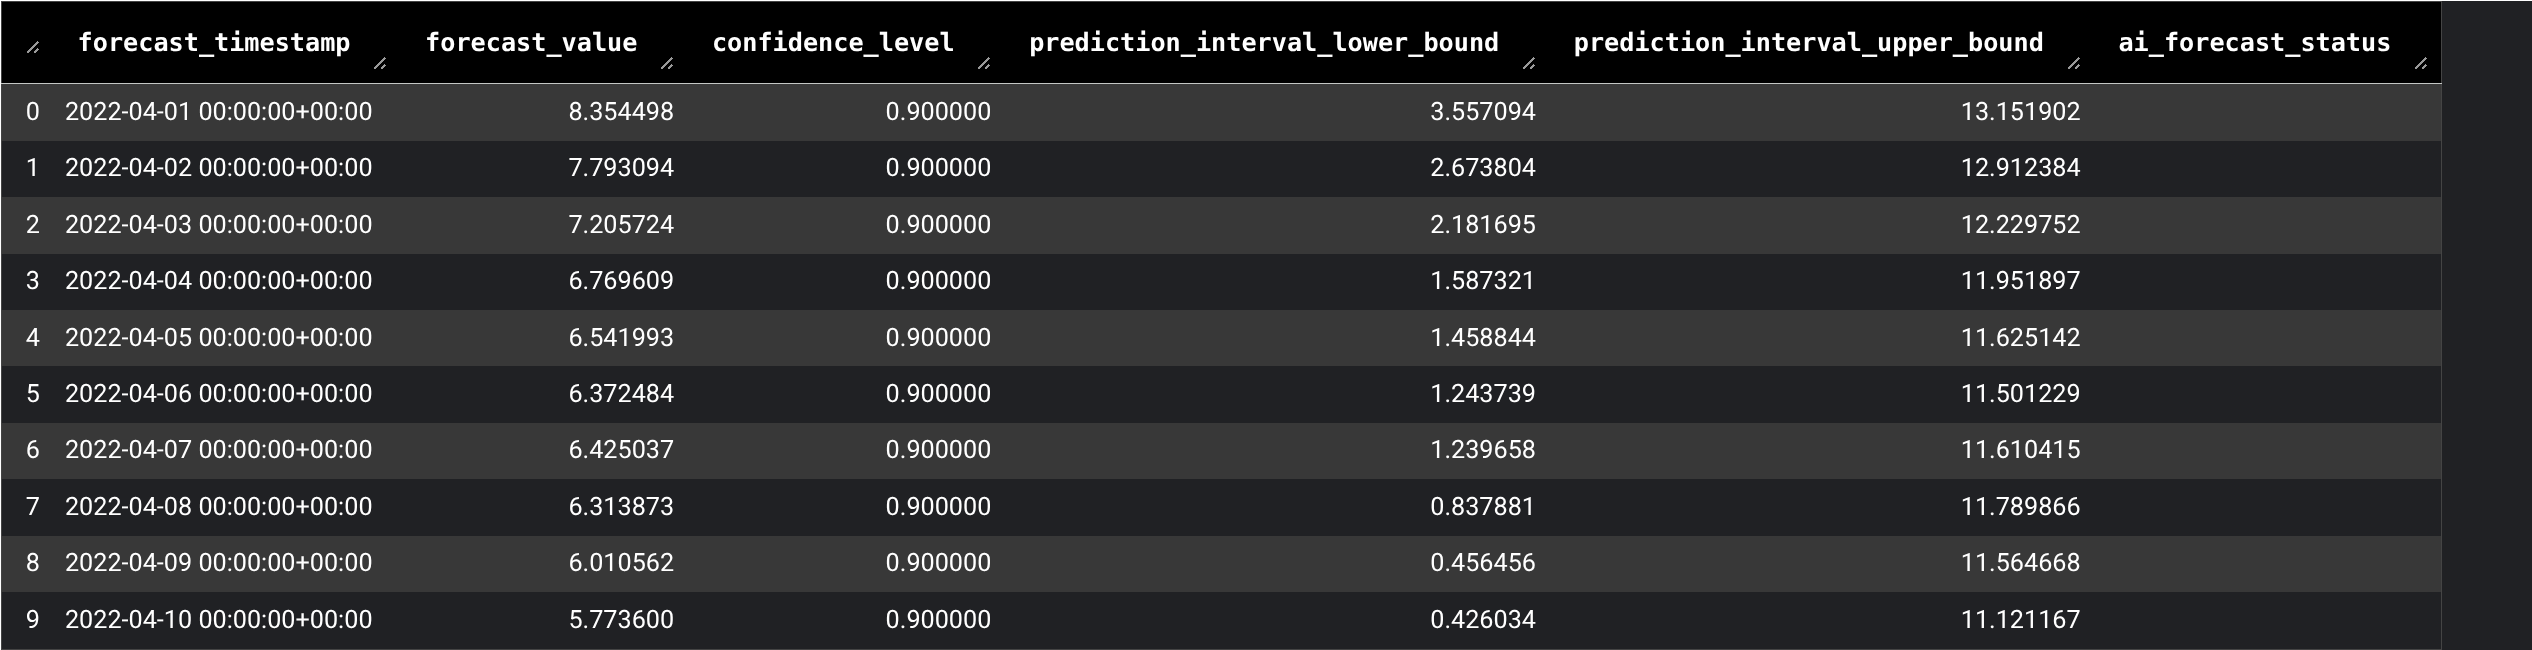
This SQL cell runs a query that uses the
AI.FORECASTfunction to forecast future average daily PM2.5 using thedf_cleanedDataFrame you generated previously.In the Visualize data using Python section, hover over the code cell, and then click Run cell.
View the results. The results are displayed in a chart.
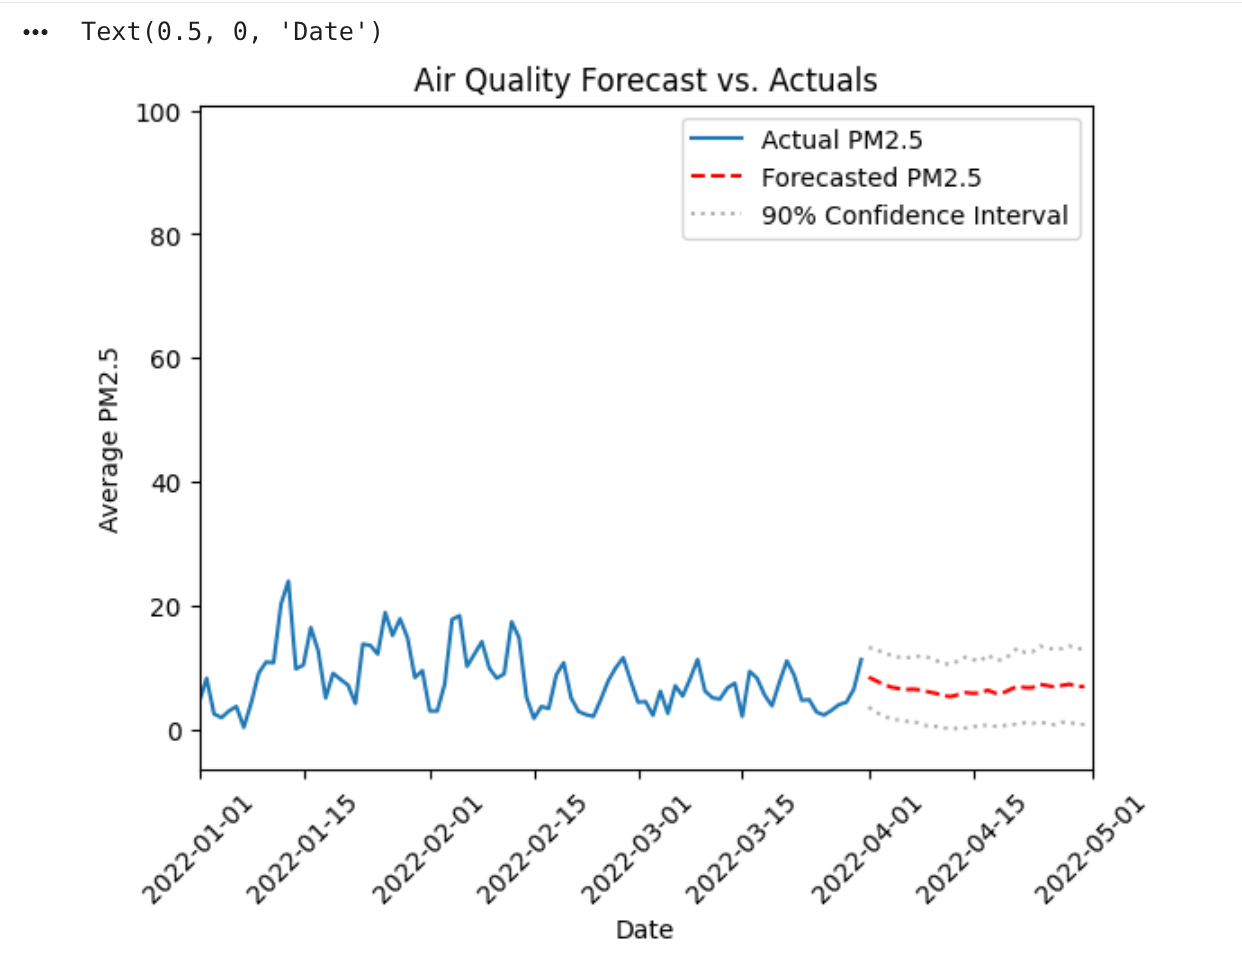
The Python code does the following:
- Import the
datetimemodule. - Plot the historical data first and get the axes.
- Plot the forecasted data on the same axes.
- Plot the confidence interval.
This visualization resembles standard Python plotting, but
df_cleaned.plotis a BigQuery DataFrames command. The command retrieves only the data needed (a sample) to render the chart, not the entire dataset.- Import the
Clean up
To avoid incurring charges to your Google Cloud account for the resources used on this page, follow these steps.
- In the Google Cloud console, go to the Manage resources page.
- In the project list, select the project that you want to delete, and then click Delete.
- In the dialog, type the project ID, and then click Shut down to delete the project.
Alternatively, to keep the project and delete the resources used in this tutorial, follow these steps:
Go to the Studio page.
In the left pane, expand your project, and then click Notebooks.
For the notebook you're deleting, click Open actions > Delete.
In the Delete notbook dialog, click Delete to confirm.
What's next
To run other sample notebook templates in the notebook gallery, see:To learn more about DataFrames, see:
To learn more about generative AI and ML functions in BigQuery, see the Generative AI overview.