
Chat with a graph
You can use conversational analytics to ask questions about a graph. Agents can write SQL and GQL queries and provide visualizations of your output. Agents can also use descriptions, synonyms, and measures defined on your graph to improve the quality of the results. For example, to try asking an agent about the publicly available Look Ecommerce graph, do the following:
In the Google Cloud console, go to the BigQuery Agents page.
Select the Agent catalog tab.
In the Sample agents by Google section, click The Look Graph.
A conversation opens. You can enter questions about the
bigquery-public-data.thelook_ecommerce.graphgraph.
Limitations
- You can use at most one graph as a data source per agent or conversation.
- You can't combine tables and graphs as data sources.
Chat with a graph
To chat with a graph, you can either
create a data agent with your graph as
its data source, or you can
create a direct conversation
with your graph. If you're not sure what to ask, try asking
What questions can I ask about this data? For example, if you ask this
question about the Look Ecommerce graph, the
response contains an overview of the graph schema and suggested questions. The
following questions might appear in the response:
Business Performance
What is the total revenue for each product category, sorted from highest to lowest?What are the top 5 brands by total revenue among users from 'Brasil'?Rank the product categories based on their total revenue for each product department (Men/Women).
User & Logistics Insights
How many users do we have in each country?What is the distribution of user ages in the United States?Which distribution centers handle the most orders with a 'Complete' status?
Relationship Analysis
Show the connection between users and the distribution centers their products are shipped from.Find all products that have been ordered by users who came from a 'Search' traffic source.
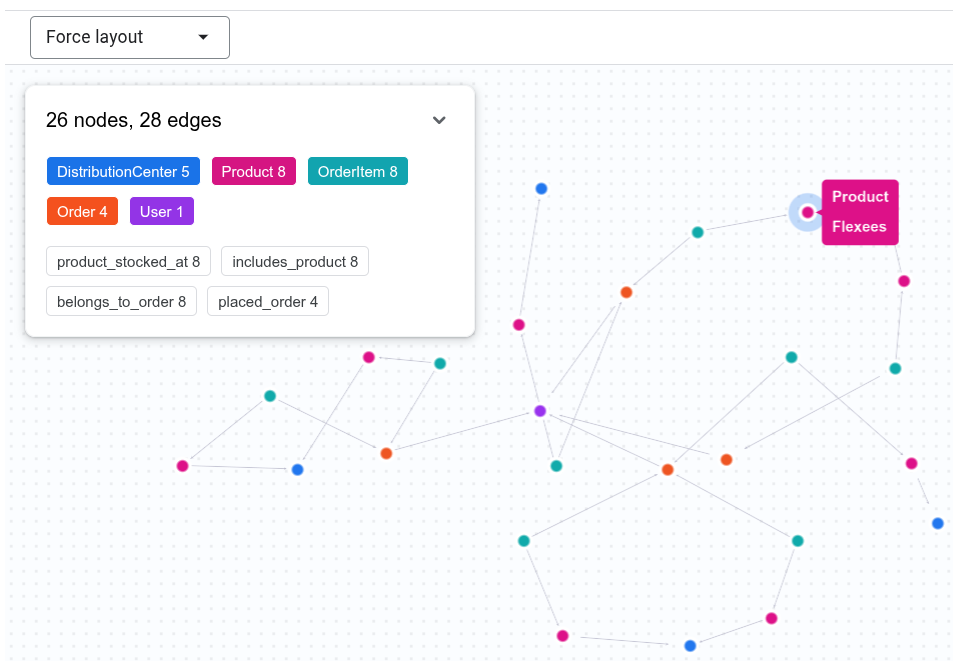
Create graph queries and visualizations
Conversational analytics can write GQL queries to answer questions about your graph and
display the output as a visualization. For example, you can enter
Show the connection between Tina Fletcher's orders and distribution centers
into the chat. The agent might run a GQL query similar to the following:
GRAPH `bigquery-public-data.thelook_ecommerce.graph`
MATCH p = (u:User {id: 32})
          <-[:placed_order]-(o:`Order`)
          <-[:belongs_to_order]-(oi:OrderItem)
          -[:includes_product]->(pr:Product)
          -[:product_stocked_at]->(dc:DistributionCenter)
RETURN TO_JSON(p) AS path;
The agent might also provide an interactive visualization.
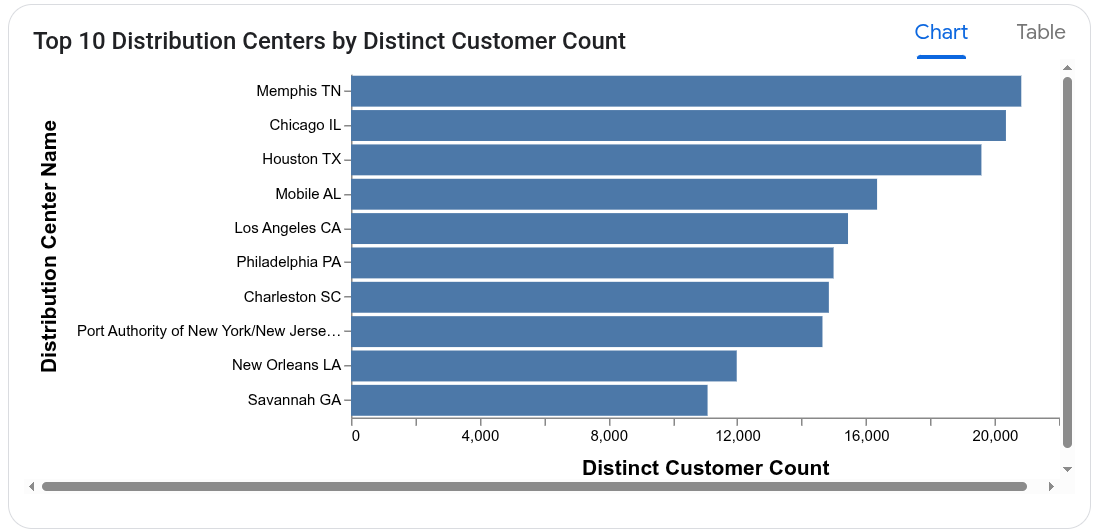
Use graph measures
Conversational analytics can use measures defined on your graph to help accurately
answer questions that involve aggregations. For example, you can ask the
following question to the Look Graph agent:
Which distribution centers process orders from the largest number of distinct customers?
The agent uses the user_count measure on the User node to avoid
overcounting the number of customers. The query used to calculate the response
might look similar to the following:
SELECT
  DistributionCenter_id,
  DistributionCenter_name,
  AGG(User_user_count) AS distinct_customer_count
FROM
  GRAPH_EXPAND("bigquery-public-data.thelook_ecommerce.graph")
GROUP BY
  DistributionCenter_id,
  DistributionCenter_name
ORDER BY
  distinct_customer_count DESC;
The agent might also provide a chart visualization.
What's next
- Learn more about conversational analytics.
- Learn more about writing graph queries.
- Learn more about designing your graph schema.
- Learn more about visualizing your graphs.