


Looker Visualization API 是 JavaScript API,會在沙箱 iframe 中執行,並託管於 Looker 應用程式中。
您可以使用相同的圖表程式碼,在 Looker 的任何位置提供圖表:探索、Look、資訊主頁、嵌入內容、PDF 或算繪圖片。
每個圖表都代表單一 Looker 查詢的檢視畫面。Looker 會執行查詢,並將結果傳遞至圖表程式碼。Looker 也會傳遞 DOM 元素,您的視覺化程式碼可繪製該元素。
需求條件
開始前,請確認您符合下列需求:
- 您必須具備一些 JavaScript 和網頁開發知識。
- 您必須具備 Looker 管理員存取權,才能建立及更新 LookML 專案資訊清單檔案。
建立 Hello World 圖表
本節說明如何建立自訂圖表指令碼,顯示指定查詢的第一個維度。
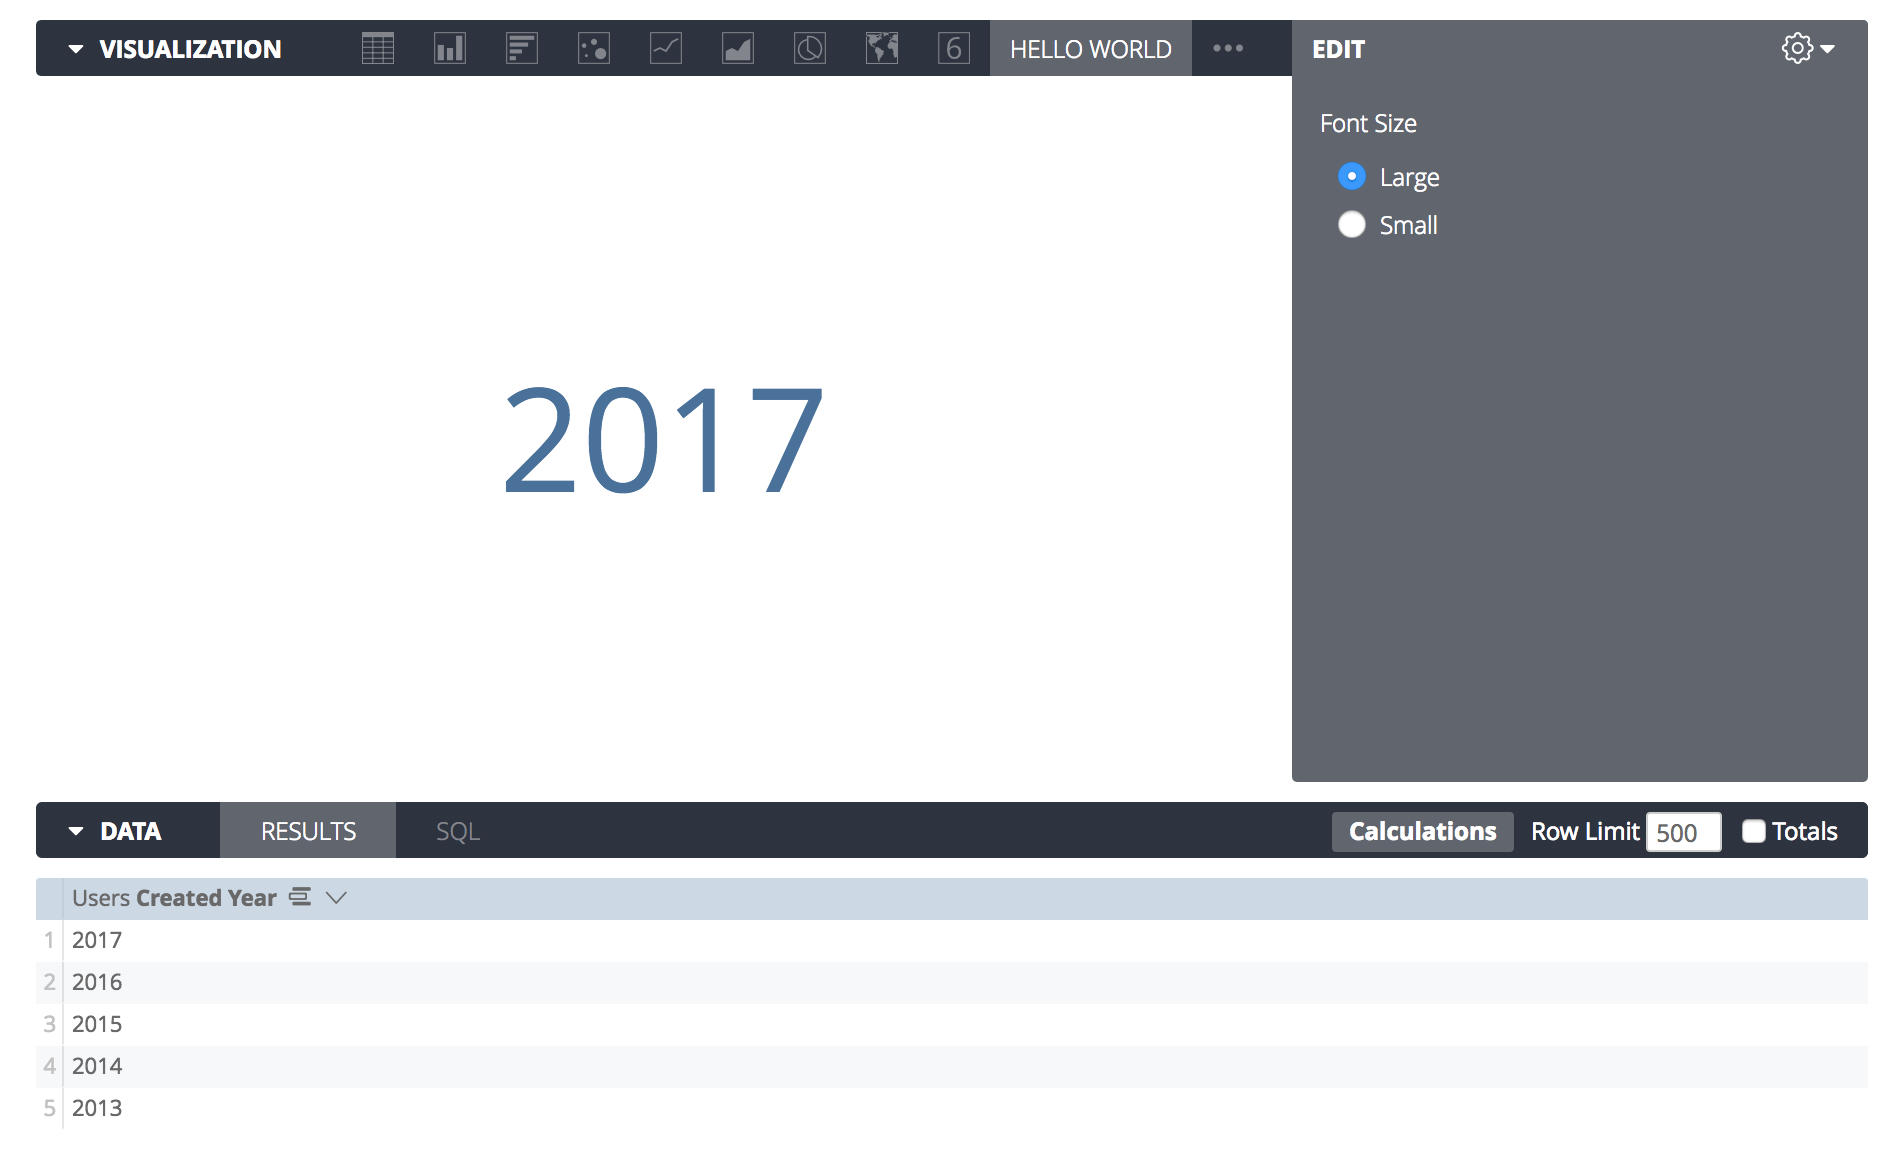
最終結果應如下圖所示:
設定
如要在 Looker 中開發及測試視覺化效果,有兩種做法:
設定其中一個選項後,您可以按照本節中的範例建立 hello_world.js。
基本程式碼結構
如要查看這個範例的最終原始碼,請參閱 GitHub 存放區。
在您代管的資料夾中,建立新的空白 JavaScript 檔案,並命名為 hello_world.js。
如要在 Looker 註冊新的自訂圖表,請呼叫 looker.plugins.visualizations.add 函式,並傳遞圖表物件。這個物件包含圖表定義和設定 UI。
以下範例顯示視覺化效果的架構,並填入所有必要屬性。其中包含 create 函式和 updateAsync 函式,您可以在其中編寫視覺化程式碼:
looker.plugins.visualizations.add({
  create: function(element, config) {

  },
  updateAsync: function(data, element, config, queryResponse, details, done) {

  }
})
這段程式碼是有效的 Looker 視覺化內容,但尚未視覺化,因此會顯示為空白方塊。
背景介紹
請考慮使用 create 函式,其中包含兩個引數:element 和 config。
Looker 會提供 element,這是 Looker 要求您將圖表放入的 DOM 元素。Looker 會建立這個元素並調整為適當大小,您必須在其中放置內容。
create 函式可讓您執行元素的初始設定。在本例中,您要建立類似下列 HTML 結構的圖表:
<style>
  /* custom styles for your chart */
</style>
<div class="hello-world-vis">
  <div>Data Goes Here</div>
</div>
您可以使用 JavaScript 將元素插入 DOM 元素,以符合這個結構。
以下範例顯示這個函式,並加入更多詳細資料:
create: function(element, config) {

  // Insert a <style> tag with some styles to use later.
  var css = element.innerHTML = `
    <style>
      .hello-world-vis {
        /* Vertical centering */
        height: 100%;
        display: flex;
        flex-direction: column;
        justify-content: center;
        text-align: center;
      }
    </style>
  `;

  // Create a container element to center the text.
  var container = element.appendChild(document.createElement("div"));
  container.className = "hello-world-vis";

  // Create an element to contain the text.
  this._textElement = container.appendChild(document.createElement("div"));

},
這段程式碼會新增 CSS、建立 hello-world-vis 容器,並在其中新增 div。
程式碼也會將 this._textElement 指派給要算繪的容器。這樣一來,您就不必在圖表開始算繪時再次查詢。
create 函式是執行只需要一次的設定工作的便利位置。
算繪
本節說明如何擴充 updateAsync 方法,以便將資料視覺化。每當圖表必須顯示變更,或發生任何可能影響圖表顯示方式的其他事件 (例如圖表大小調整或設定選項變更) 時,系統就會呼叫這個方法。
在本範例中,您只需要找出第一個儲存格中的第一個維度。您可以使用 data 執行這項操作,這是資料集每列的陣列,而 queryResponse 則包含查詢的中繼資料,例如欄位名稱和類型。
您也可以使用名為 LookerCharts.Utils.htmlForCell 的輔助方法呼叫,在該儲存格中提供資料點的適當 HTML 表示法。這個方法會自動處理鑽取連結、格式和資料動作等元素:
  updateAsync: function(data, element, config, queryResponse, details, done) {

    // Grab the first cell of the data.
    var firstRow = data[0];
    var firstCell = firstRow[queryResponse.fields.dimensions[0].name];

    // Insert the data into the page.
    this._textElement.innerHTML = LookerCharts.Utils.htmlForCell(firstCell);

    // Always call done to indicate a visualization has finished rendering.
    done()
  }
這樣就完成自訂視覺化圖表正常運作所需的步驟。不過,請務必加入處理錯誤的方法。
處理錯誤
updateAsync 程式碼會擷取第一列資料,但如果查詢未傳回任何結果或不含任何維度,就可能發生錯誤。
如果沒有錯誤處理機制,瀏覽器控制台會顯示 JavaScript 錯誤,圖表無法轉譯時,可能會讓使用者感到困惑。
如果圖表在嘗試算繪時遇到問題,可以顯示自訂錯誤訊息。Looker 會在圖表物件中加入兩個函式:addError 和 clearErrors。您可以使用這些函式,向所有使用者顯示合理的錯誤訊息。
由於這些函式會新增至視覺化物件,因此可透過 this 物件,從 updateAsync 函式的環境取得。
您可以修改 updateAsync 方法的開頭,偵測錯誤情況、通知使用者問題,然後結束,而不是嘗試算繪:
  updateAsync: function(data, element, config, queryResponse, details, done) {

    // Clear any errors from previous updates.
    this.clearErrors();

    // Throw some errors and exit if the shape of the data isn't what this chart needs.
    if (queryResponse.fields.dimensions.length == 0) {
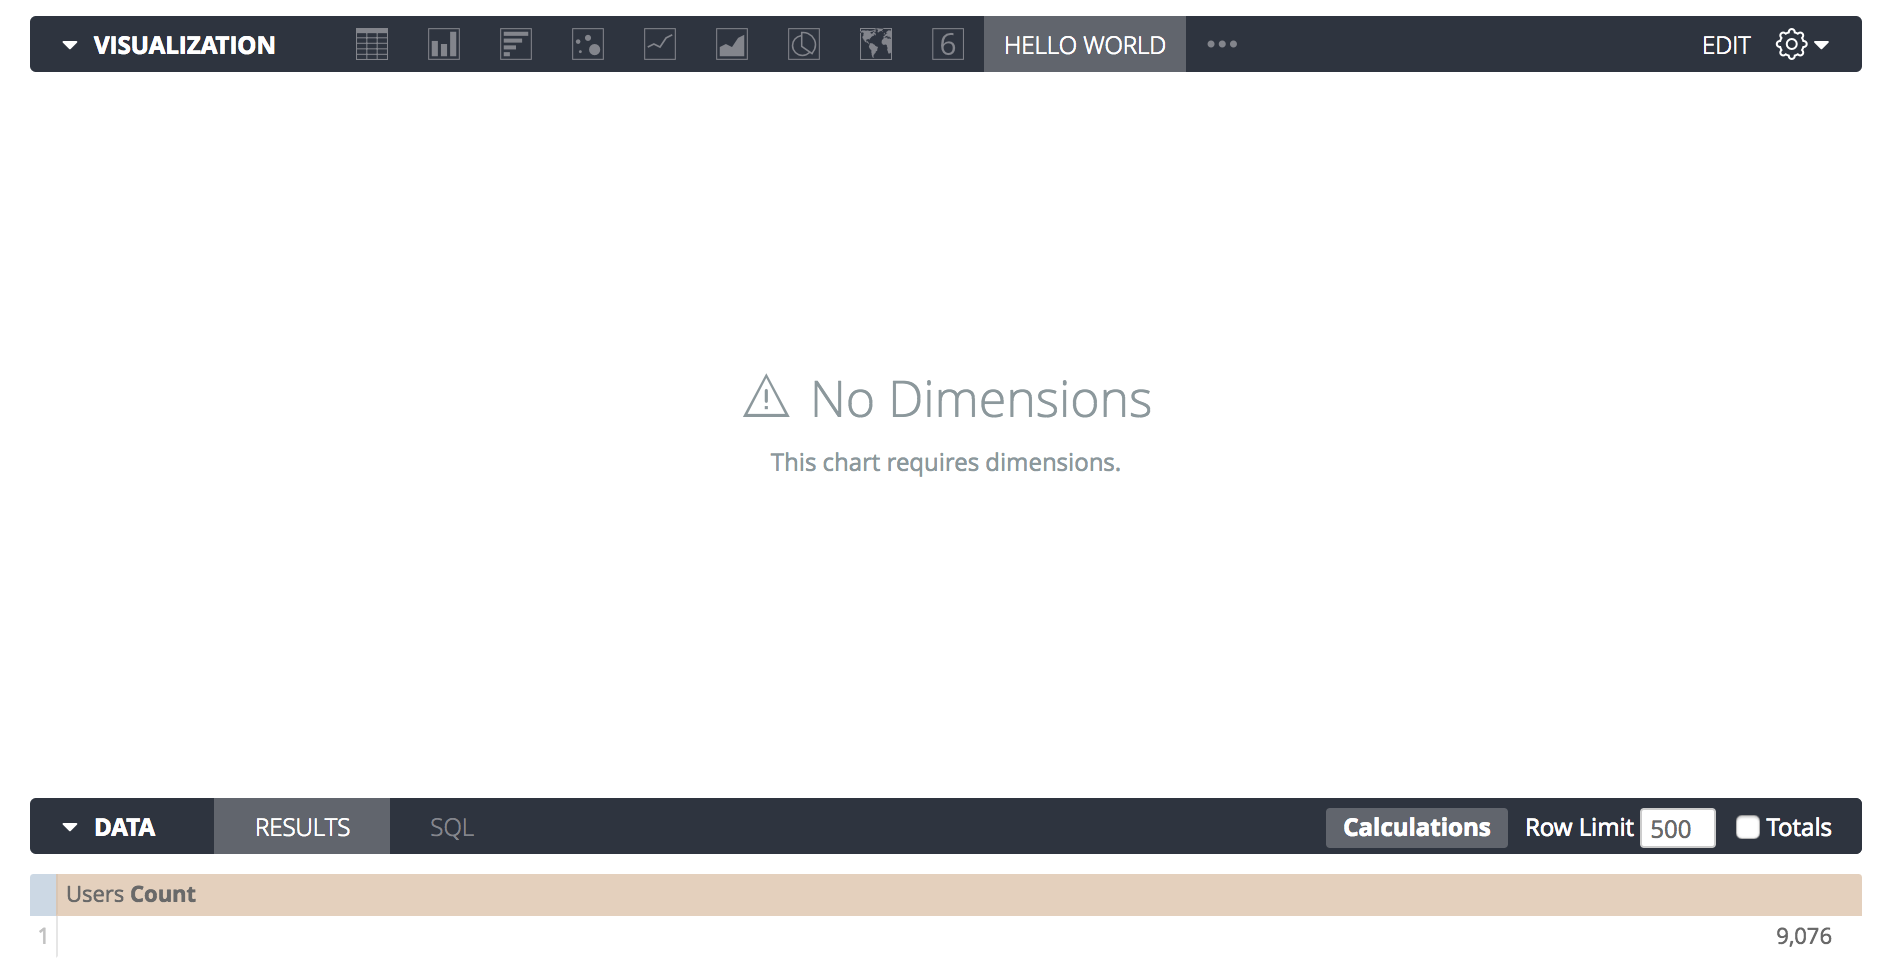
      this.addError({title: "No Dimensions", message: "This chart requires dimensions."});
      // Always call done() before exiting early to avoid dashboard exports hanging
      done();
      return;
    }

    if (!data || data.length === 0) {
      this.addError({title: "No Data", message: "The query returned no results."});
      done();
      return;
    }

    // ... the rest of the update code here ...
如果使用者建立的查詢只包含測量指標,就會看到類似下方的錯誤訊息:
非同步顯示和匯出 PDF
在上述「Hello World」範例中,系統會在 DOM 更新後立即呼叫 done() 函式。由於設定 innerHTML 是同步作業,因此這個方法很合適。
不過,如果您使用 D3.js、Chart.js 或 React 等圖表程式庫,算繪作業可能會是非同步。如果在指令碼底部呼叫 done(),Looker 可能會在圖表繪製完成前,擷取 PDF 或 PNG 匯出作業的螢幕截圖,導致圖塊空白。
Looker 匯出資訊主頁時,會使用無頭瀏覽器,並依賴 done() 回呼,判斷何時可以安全擷取螢幕截圖。
為確保圖表能正確匯出,您必須將 done() 回呼繫結至程式庫的完成事件,並使用 details.print 旗標在匯出期間停用動畫。
以下範例說明如何使用 D3.js 處理非同步算繪:
  updateAsync: function(data, element, config, queryResponse, details, done) {
    this.clearErrors();

    // Check if Looker is exporting the chart to a PDF/PNG
    const isExport = details && details.print === true;

    // Clear previous elements
    this.svg.selectAll("*").remove();

    const circle = this.svg.append("circle")
      .attr("cx", 50)
      .attr("cy", 50);

    if (isExport) {
      // Instant render for exports. Draw the final state immediately with no transitions
      circle.attr("r", 40);

      // Tell Looker to take the screenshot right now
      done();
    } else {
      // If it's for the browser, start small and animate
      circle.attr("r", 0)
        .transition()
        .duration(1000)
        .attr("r", 40)
        .on("end", () => {
           // Tell Looker the animation is fully complete
           done();
        });
    }
  }
如果您使用 React,請務必將 done 回呼做為第三個引數傳遞至轉譯函式,這樣 Looker 就會等待 React 掛接元件:
  this.chart = ReactDOM.render(
    <MyCustomChart data={data} />,
    element,
    done // Looker waits for React to finish
  );
設定
您可以允許使用者自訂圖表的某些部分。
除了視覺化物件的其他屬性,您還可以使用名為 options 的屬性。
您可以使用這個屬性指定圖表所需的選項類型:
looker.plugins.visualizations.add({
  options: {
    font_size: {
      type: "string",
      label: "Font Size",
      values: [
        {"Large": "large"},
        {"Small": "small"}
      ],
      display: "radio",
      default: "large"
    }
  },
  // ... rest of visualization object ...
這個範例會建立 font_size 選項,以圓形按鈕的形式顯示,讓使用者選擇「小」和「大」字型大小。
您必須指定 options 屬性,才能將選項新增至圖表挑選器。
如要在程式碼中使用這個選項,請回想一下,updateAsync 方法中有 config 參數。這項參數包含下列所選選項:
updateAsync: function(data, element, config, queryResponse, details, done) {
config 物件大致如下:
{font_size: "large"}
更新圖表時,您可以檢查這個物件並相應回覆。 在更新方法結尾新增下列檢查,實作字型大小變更:
if (config.font_size == "small") {
  this._textElement.className = "hello-world-text-small";
} else {
  this._textElement.className = "hello-world-text-large";
}
您也應更新在 create 方法中新增的 <style> 標記,定義 hello-world-text-small 和 hello-world-text-large CSS 類別:
.hello-world-text-large {
  font-size: 72px;
}
.hello-world-text-small {
  font-size: 18px;
}
由於設定變更時會呼叫 updateAsync 函式,且 Looker 會自動儲存設定,因此您只需執行這項操作,即可回應設定。
後續步驟
如要查看這個「Hello World」圖表的完整原始碼,請前往 Looker 開放原始碼 GitHub 存放區。
如要進一步瞭解其他功能,請參閱 Visualization API 參考資料。