
This page introduces you to creating and editing Explores in the new Explore experience. Read the following sections to learn how to create and edit Explore queries for presenting data to your users:
- Required roles
- Accessing the new Explore experience
- Starting with a blank Explore
- Using Quick Start analyses
- Navigating the Configure panel
- Adding fields
- Removing fields
- Sorting data
- Pivoting data
- Reordering columns
- Displaying totals
- Features for developers
- Related resources
For more information about the components of the new Explore experience, see the Viewing and interacting with Explores in the new Explore experience documentation page.
Required roles
You must have specific roles and permissions to perform the following functions in Explores:
To view and interact with Explores, you must have the User Looker role or another role that contains the
explorepermission.To access features for developers, which includes the ability to see LookML information about fields, you must have the User Looker role or another role that contains either the
developpermission or thesee_lookmlpermission.To create and edit table calculations, you must have either the Developer Looker role or another role that contains the
create_table_calculationspermission.To create and edit custom fields, you must have either the Developer Looker role or another role that contains the
create_custom_fieldspermission.
Accessing the new Explore experience
To access the new Explore experience, the New Looker Explore Experience preview feature must be enabled for your instance. If you are not a Looker admin, ask an admin to enable the feature.
From an Explore page, click Try the new Explore to turn on the new Explore experience for all Explores that you interact with. To switch back to the classic experience, click Switch to classic Explore.
Starting with a blank Explore
When you open a blank Explore in Looker or clear an existing Explore, you have several options for getting started:
- Use a Quick Start analysis to load an Explore.
- Ask Insight Assistant to get answers to your data questions and starting points for your analysis (when available).
- Explore from scratch by adding fields from the Configure panel.
Using Quick Start analyses
Once you have opened an Explore in the new Explore experience, you can use Quick Start analysis options to create a starting point for quickly running and building analyses. Quick Starts can be modeled queries or can be generated by Gemini.
Quick Start analysis cards are displayed in the Quick Start panel in the Configure tab. You can open the Quick Start panel in one of two ways:
- By clicking the Browse Quickstarts card in a blank Explore
- By clicking the Quick Start button.
Each Quick Start analysis card displays the name of the analysis and, when available, a description.
If generated Quick Start analyses are enabled for your instance, when you select an Explore from the Explore menu that doesn't already have defined Quick Start analyses, Gemini in Looker will give you an option to Try AI Quick Starts. Click Add, and Gemini will analyze the Explore and generate Quick Start analyses.
You can open a Quick Start analysis from a blank Explore in the new Explore experience or once an Explore has already been run in the new Explore experience.
Choosing a Quick Start option from a blank Explore in the new Explore experience
To run a Quick Start analysis, click the Browse quick starts card to open the Quick Start panel, and choose the analysis card that you want to explore. The query will automatically run and display results, including the visualization.
You can modify a Quick Start analysis once it has run by adding fields or removing fields from the All Fields tab, from Search results, or from the Fields in use tab in the Configure panel.
Choosing a Quick Start option once an Explore has run in the new Explore experience
Once an Explore has finished running in the new Explore experience, you can select a new Quick Start analysis by clicking the Quick Start button to open the Quick Start panel, which displays the available analysis cards.
Clicking a Quick Start analysis card from the panel runs the analysis and replaces all the previous Explore results, except for any existing filters.
Quick Start filter behavior
Filters are additive. This means that, when run, Quick Start analyses will include any existing Explore filters. If a selected Quick Start analysis has a filter that conflicts with an existing Explore filter, you will be prompted to select which filter value to use in the Explore query.
When you choose a Quick Start analysis with a conflicting filter configuration, the Choose filter set dialog will open and prompt you to resolve the conflict by selecting either the Keep current filters option, which lists the existing filter configuration, or the Replace with new filters option, which lists the configured filter values of the Quick Start analysis.
To resolve the conflict in the Choose filter set dialog, follow these steps:
- Choose an option.
- Choose Keep current filters to run the new analysis with the existing filter configuration.
- Choose Replace with new filters to run the new analysis with its configured filter condition.
- Click Apply to confirm the filter selection and run the analysis.
The Explore will run with the selected filter configuration.
Navigating the Configure panel
Once you have opened an Explore in the new Explore experience, you can use the Configure panel to create, edit, and configure Explore queries and visualizations. The Configure panel includes the following elements:
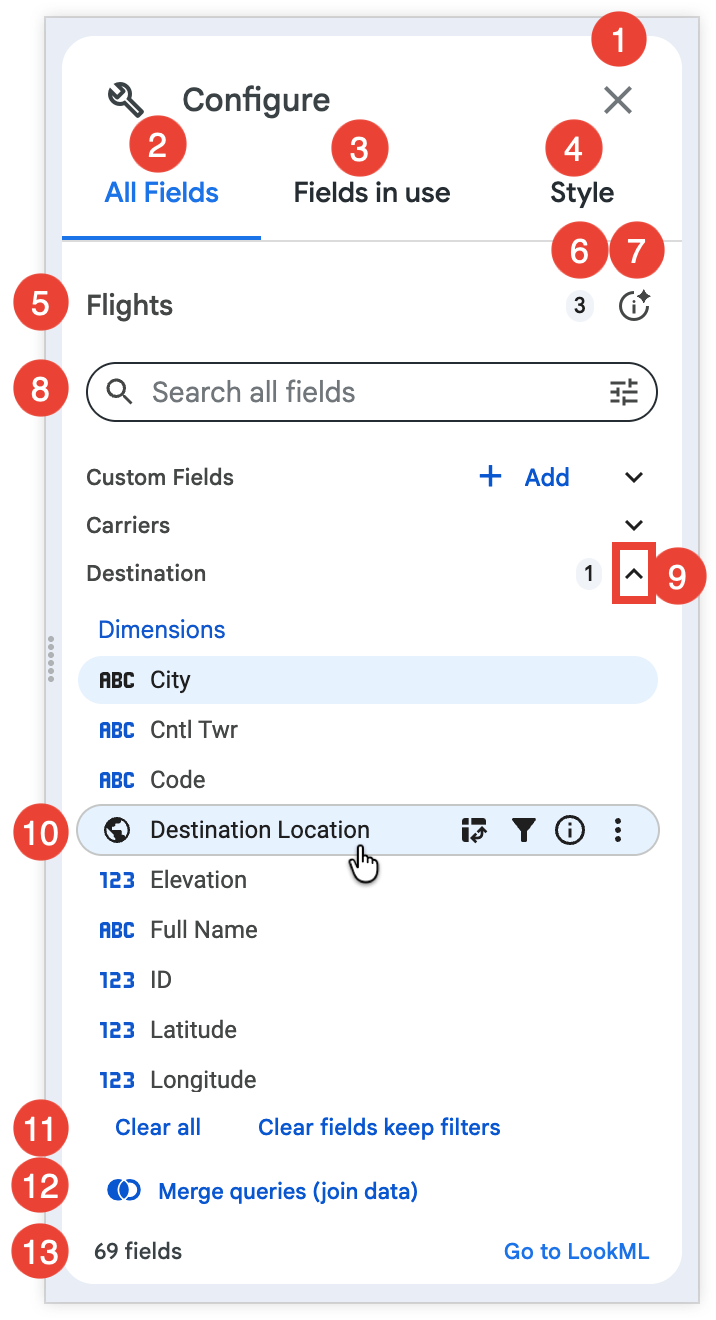
- The Close button: When clicked, closes the Configure panel. Alternatively, use the Configure button to display or hide the Configure panel.
- The All Fields tab: Displays all available fields for an Explore.
- The Fields in use tab: Displays all the Explore fields that are selected in the query.
- The Style tab: Displays the options for configuring the query visualization. Learn more about using the Style tab to configure visualizations.
- The name of the Explore.
- The number of fields that are selected in the Explore query.
- The Explore Summary info button: When clicked, displays a description of the Explore that was either added by a developer, or generated by Gemini in Looker.
- The search bar: Lets users search for fields that match specific terms and criteria.
- The Explore views: Displays the views that are included in the Explore, and the number of fields from that view that are in the Explore query. Click the name of the view to expand or collapse the view details. When expanded, each view lists the fields that are available to use in the Explore, organized under field type headers: Dimensions, Measures, and Filter-Only Fields. Custom fields and table calculations will appear under the Custom Fields view label. The base view is indicated with the Base view label.
- The field-specific information and actions icons: Display a field's current and potential functions in an Explore query, as well as more details about a field.
- The Clear all and Clear fields keep filters options: When clicked, Clear all clears all of the Explore fields, and Clear fields keep filters clears the Explore fields but keeps any filters that are applied.
- The Merge queries (join data) button: Opens the Join data page. Learn more about joining data in the new Explore experience.
- The Explore summary: Displays the total number of fields in an Explore (including custom fields and table calculations when permissions allow), and the Go to LookML link. The Go to LookML link directs users to the
exploredefinition in its LookML project. This link is visible only to users with thesee_lookmlpermission.
Using the field-specific information and actions icons
The icons next to each field provide more information about the field and indicate the available options for that field. The icons are visible when you hold your cursor over a field.
You can click an icon to make changes to a query by using a field, depending on the field's data type, including filtering or pivoting by a field. You can also use icons to view information about a field, or — when permissions allow — to create a custom field that is based on the field.
These icons appear on the All Fields and Fields in use tabs.
The available icons and functions include the following:
- The Pivot data icon: Click this icon to pivot or unpivot a field in an Explore. This icon will persist next to a field name when a field is pivoted. Click the persisted icon to remove the pivot. Learn more about pivoting data.
The Filter by field icon: Click this icon to filter the query results by a field. This icon will persist next to a field name when a field is filtered. Click the persisted icon to remove the filter.
The Info icon: Click this icon to display more information about a field:
- The information includes the field's data type, description (when available), and LookML field name (in
view_name.field_namesyntax) for all users. - For users with the
see_lookmlpermission, the information will include the definition of the LookML field'ssqlparameter, as well as a link to navigate to that field in the LookML project.
- The information includes the field's data type, description (when available), and LookML field name (in
The More menu: Click this icon to create a custom field or to switch a timeframe for a dimension group. This icon is available only to users in certain cases:
- When a user has the
create_custom_fieldspermission. Users with thecreate_custom_fieldspermission can use the More menu to quickly create custom fields, depending on a field's type. - When a dimension group is selected in the Explore query. The Switch to option will appear for dimension groups on the Fields in use tab, in addition to custom fields options.
- When a user has the
Using the data column More menu
In addition to the field-specific information and action icons, you can edit a query and visualization in the new Explore experience with the options in the data column More menu.
The options that are displayed depend on the field type and a user's permissions.
For dimensions and measures, the data column More menu options can include the following:
- Remove: Removes the column field from the Explore query.
- Filter: Filters the Explore query by the column field. Learn more about filtering data in the new Explore experience.
- Remove Filter: Removes a filter field. This option is available when an Explore is filtered by the field.
- Pivot: Pivots a field in an Explore query. Learn more about pivoting data.
- Unpivot: Unpivots a field in an Explore query. This option is available when a field is pivoted, and in the pivot row More menu.
- Switch to: Displays a list of timeframes for dimension groups that users can switch between in a query.
- Hide from visualization: Hides the column field from the visualization. If a field is hidden from the visualization, this option appears as Show in visualization. Learn more about hiding fields from visualizations.
- Hide "No"s from visualization: For
yesnotype fields, hides the rows that correspond to "No"s from the visualization. If "No"s are hidden from the visualization, this option appears as Show "No"s in visualization. Learn more aboutyesnotype fields. - Calculations: Displays a list of shortcut calculations to let users who have the
create_table_calculationspermission create a table calculation that is based on the column field. This option is available only for non-string-based data types. - Bin: Opens the Bin dialog to let users who have the
create_custom_fieldspermission create custom bins that are based on the column field. Custom bins are available only for certain field types. - Group: Opens the Group By dialog to let users who have the
create_custom_fieldspermission create a custom group that is based on the column field. Custom groups are available only for certain field types. - Sort: Sorts the query by the column field in either Ascending or Descending order. Learn more about sorting data.
- Add additional sort: Sorts the query by a secondary column field in either Ascending or Descending order. Learn more about sorting data. This option is only available if an Explore is already sorted by a different field.
In addition to the previous options, table calculations and custom fields data column More menu options can include the following:
- Duplicate: Duplicates the table calculation or the custom field in the query.
- Edit or Edit Calculation: Opens a dialog for editing a table calculation or editing a custom field.
- Delete: Permanently deletes a custom field or table calculation from an Explore query and the Configure panel. To remove a custom field or a table calculation from the Explore query, but not from the Configure panel, use the Remove option.
Using the All Fields tab
When you open an existing Explore in the new Explore experience, the All Fields tab is displayed by default. This tab is the starting place for building an Explore and displays all the available fields that you can select for a query. Fields are organized alphanumerically by type (dimensions, followed by measures) under the name of the view or view label in which they are defined. Each field will show field-specific information and actions, such as a field's current and potential functions in an Explore query.
Click the name of the view to expand or collapse the view details. When expanded, each view lists the fields that are available to use in the Explore, organized under field type headers: Dimensions, Measures, and Filter-Only Fields. Custom fields and table calculations will appear under the Custom Fields view label. The base view is indicated with the Base view label. Users with the create_table_calculations permission can create and edit table calculations, and users with the create_custom_fields permission can create and edit custom fields by clicking + Add, or by choosing a custom field option from a field's More menu.
Fields that are selected in a query will appear highlighted by a background, and any corresponding field action icons (pivot, filter) will appear in bold without you needing to hold the pointer over a field when it is active.
You can click Clear all to remove all of the fields from the Explore, or click Clear fields keep filters to clear the Explore fields but keep any filters that are applied.
Using the Fields in use tab
The Fields in use tab provides a snapshot of the Explore, including the chart type that is selected in the Visualization pane, and all of the fields that are active in an Explore, organized alphanumerically by view or view label, and under the corresponding field type headers (Dimensions, Measures, and Filter-Only Fields).
The Fields in use tab also displays the total number of active fields in an Explore in the Explore summary. A Go to LookML link is also available to users with the see_lookml permission. Go to LookML directs users to the explore definition in its LookML project.
You can click fields to remove them from an Explore, click Clear all to remove all of the fields from the Explore, or click Clear fields keep filters to clear the Explore fields but keep any filters that are applied.
Using the search bar
The search bar lets you quickly find the specific fields that you need to build Explores in the new Explore experience. To perform a search, enter a term into the search bar.
To refine the scope of your search, click Search Options. You can limit your search to field labels, field descriptions, group labels, or view labels.
Adding fields
You can add fields to queries in the new Explore experience in one of several ways:
- By choosing a Quick Start analysis
- By dragging a field from the All Fields tab and dropping it into the Data pane
- By clicking on a field from the All Fields tab
Once you have added all of the fields that you want in the Explore query, click Run to update.
See the sections for Adding table calculations and Adding custom fields on this page for information about performing advanced analyses in the new Explore experience.
Adding table calculations
Users with the create_table_calculations permission can create calculations in the following ways:
By clicking + Add in the Custom Fields view and choosing Table Calculation to open the Create table calculation dialog.
By clicking a field's data column More menu and choosing a shortcut calculation from the Calculations option menu.
Editing and duplicating table calculations
You can edit or duplicate table calculations in the following ways:
- By choosing the appropriate option in the calculation's More menu in the Custom Fields view in the All Fields or Fields in use tabs
- By choosing the appropriate option in the calculation's data column More menu
See Removing fields on this page to learn how to delete or remove table calculations from queries in the new Explore experience.
Adding custom fields
Users with the create_custom_fields permission can create custom fields in the following ways:
By clicking + Add in the Custom Fields view and choosing either the Custom Dimension or Custom Measure option. Choosing one of these options opens the Create Custom measure dialog for custom measures, or the Create Custom dimension dialog for custom dimensions.
By clicking a field's More menu in the All Fields tab or Fields in use tab in the Configure panel and choosing Aggregate, Bin, Group, or Create filtered measure, depending on the field's type.
By clicking a field's data column More menu and choosing Bin or Group to open the Bin dialog or Group By dialog.
Editing and duplicating custom fields
You can edit or duplicate custom fields in the following ways:
- By choosing the appropriate option in the custom field's More menu in the Custom Fields view in the All Fields or Fields in use tabs
- By choosing the appropriate option in the custom field's data column More menu
See Removing fields on this page to learn how to delete or remove custom fields from queries in the new Explore experience.
Removing fields
You can remove fields from queries in the new Explore experience in several ways:
- By clicking an individual field name in the All Fields tab, or in the Fields in use tab.
- By clicking Clear all in the Fields in use tab to remove all of the fields in an Explore query.
- By clicking Clear fields keep filters in the Fields in use tab to remove all of the fields in the Explore query, but keep any filters that are applied to the Explore query.
- By clicking Remove from the data column More menu.
- By clicking Delete from the data column More menu. The Delete option permanently deletes a custom field or table calculation from an Explore query and the Configure panel. To remove a custom field or a table calculation from the Explore query, but not the Configure panel, use the Remove option.
Once you have removed all of the fields that you want to remove from the Explore query, click Run to update.
Sorting data
Unpivoted data in the new Explore experience is sorted by default according to the following prioritization:
- By the first date dimension, descending
- If no date dimension exists, by the first measure, descending
- If no measure exists, by the first added dimension, ascending
For information on sorting pivoted data, see the Pivots and sorting section.
A field's sort order is indicated in the data table in several ways:
- With a number and an ^ upward-facing or ⌄ downward-facing arrow next to the field name that distinguishes its sort-by order and sort direction, as compared to other fields
- With an arrow next to the field name that indicates the sorting direction (^ pointed up for ascending or ⌄ down for descending)
- With a tooltip that appears when you hold the pointer over a field name
You may want to sort data differently than the default order. You can sort by clicking a field's column header in the data table to sort the query by that field:
- Click a field's column header once to sort by that field in descending order.
- Click a field's column header twice to sort that field in ascending order.
Alternatively, you can click the Sort option in the field's data column More menu.
To sort multiple fields, hold down the Shift key and then click the column headers in the order that you want them sorted. Alternatively, you can click the Add additional sort option in the field's data column More menu.
Pivoting data
Multiple dimensions are often easier to look at when you pivot one of the dimensions horizontally. Each value in the dimension will become a column in your query. This makes the information easier to consume visually and reduces the need to scroll to find data. Looker supports up to 200 pivoted values.
To pivot results by a dimension in the new Explore experience, follow these steps:
In the All Fields or Fields in use tab, position your cursor over the dimension name and click the Pivot data icon.
Alternatively, click the Pivot option in a field's data row More menu.
Click Run to update to re-run the query.
You can unpivot a field by clicking the dimension's Pivot data icon from either the All Fields tab or the Fields in use tab. Alternatively, you can click the Unpivot option from a field's data row More menu.
Pivots and sorting
You can also sort pivoted dimensions by clicking the field name header of the dimension in the data table, or by clicking the Sort option in the field's data row More menu menu.
To sort by multiple pivoted dimensions, hold down the Shift key and then click the row headers in the order that you want them sorted. Alternatively, you can click the Add additional sort option in the field's data row More menu. When you're sorting a pivoted measure, any rows with values in that column are sorted first, followed by rows without data in that column (indicated by the ∅ null value symbol).
Reordering columns
You can reorder columns in the Data pane data table by clicking a column header and dragging and dropping the column to its new position. The visualization will reflect the new column order after you click the Run to update button.
The order of columns in the data table is based on field type:
- Dimensions (including custom fields)
- Dimension table calculations
- Measures (including custom fields)
- Measure table calculations
- Row totals
For the most part, columns can be reordered within each field type but cannot be moved out of their field type section.
For example, dimension table calculations can be rearranged among themselves, but you cannot place a dimension table calculation in between two measures.
Columns under a pivoted dimension can be reordered, but the order of pivoted dimensions can be changed only by changing the sort order, not by manual reordering.
Displaying totals
Sometimes a summary of your data is useful. You can add column or row totals to a query in the new Explore experience by clicking the Totals switch in the data table and then rerunning the query.
If you've added row totals, and your query exceeds any row limit that you've set, you won't be able to sort the Row Totals column (although you can sort dimension and measure columns as normal). This is because you might be missing rows in your data that should be included in your totals. If you run into this issue, you can try increasing the query's row limit to 5,000 rows (or up to 50,000 rows if a higher limit is specified by your admin).
When totals aren't available
There are some cases when totals won't be available:
- Column totals are available only for measures and table calculations that exclusively reference measures, not for dimensions or table calculations that reference dimensions.
- Row totals are available only for measures, not for dimensions or table calculations that are based on dimensions.
- Certain types of columns won't be totaled, because of database limitations or because the value wouldn't make sense as a total. For example, you can't add together a list of words.
Things to consider with totals
Additionally, there are some things to keep in mind about how totals work in certain situations:
- Columns that count unique items might not add up as you expect, since the same item might show up in several categories but be counted as only one unique item in the totals. See the Why don't my totals match the values in my table? Best Practices page for more details.
- The Row Totals feature creates an additional query, and this query has a limit of 30,000 rows. If your Explore query has more than 30,000 rows, row totals will be shown for the first 30,000 rows only. Furthermore, if the data is pivoted, the row totals limit is further reduced by the number of options in your pivot.
- Some table calculations that perform aggregations, such as calculations that use
percentileormedian, might not add up as you expect. This is because table calculations calculate totals by using the values in the Total row, not the values in the data column. See the Display potentially confusing table calculation totals as nulls Best Practices page for troubleshooting tips. - If you've filtered your query by a measure, totals may appear to be too high. However, in actuality, what you're seeing is a total for your data before the measure filter is applied. In other words, the measure filter may be hiding some data from your query results, even though that data is included in the total.
- If you've used totals with merged results, Looker calculates totals on each of the component queries and uses those totals in the merged result. Therefore, totals may appear too high, because what you are seeing are totals calculated before the results were merged. One way to avoid this is to align the filters on each query.
- Similarly, if you've placed row or column limits on your query, and your query results exceed that limit, totals may also appear to be too high. However, what you're seeing is a total for your data before the limits are applied. In other words, the limits may be hiding some data from your query results, even though that data is included in the total.
In the situations involving merged results, it is possible to calculate totals only for the data that you can see. To do so, you'll need to use a table calculation. For a column total, use sum(${view_name.field_name}). For a row total, use sum(pivot_row(${view_name.field_name})).
Features for developers
Depending on your permissions, you may see several features that are designed for Looker developers in the Configure panel:
- The Go to LookML option on the All Fields and Fields in use tabs lets developers navigate to the Explore LookML.
- The Go to LookML option in a field's Filter actions menu in the Filters pane lets developers navigate to the field's LookML.
- The
sqlparameter definition in a field's Info icon menu lets developers see a field'ssqldefinition without needing to navigate to the field's LookML. - The Go to LookML option in a field's Info icon menu lets developers see the field's LookML.
- The SQL query button in the new Explore experience Data pane lets Looker developers see the SQL query that Looker sends to the database to retrieve the data.
- The Explore query tracker lets Looker developers track the performance and execution of the Explore query.
Related resources
- Learn how to filter and limit queries in the new Explore experience.
- Learn how to perform ad hoc analyses with table calculations.
- Learn how to create custom fields and measures.
- Learn how to edit visualization configurations in the new Explore experience.