

The Looker Visualization API is a JavaScript API that runs in a sandboxed iframe and is hosted within the Looker application.
You can use the same visualization code to provide a visualization anywhere in Looker: Explores, Looks, dashboards, embeds, or PDF or rendered images.
Each visualization represents a view of a single Looker query. Looker executes the query and passes the results to your visualization code. Looker also passes a DOM element into which your visualization code can draw.
Requirements
Before you begin, ensure that you meet the following requirements:
- Some knowledge of JavaScript and web development is necessary.
- Looker Admin access is required to create and update LookML project manifest files.
Create a Hello World visualization
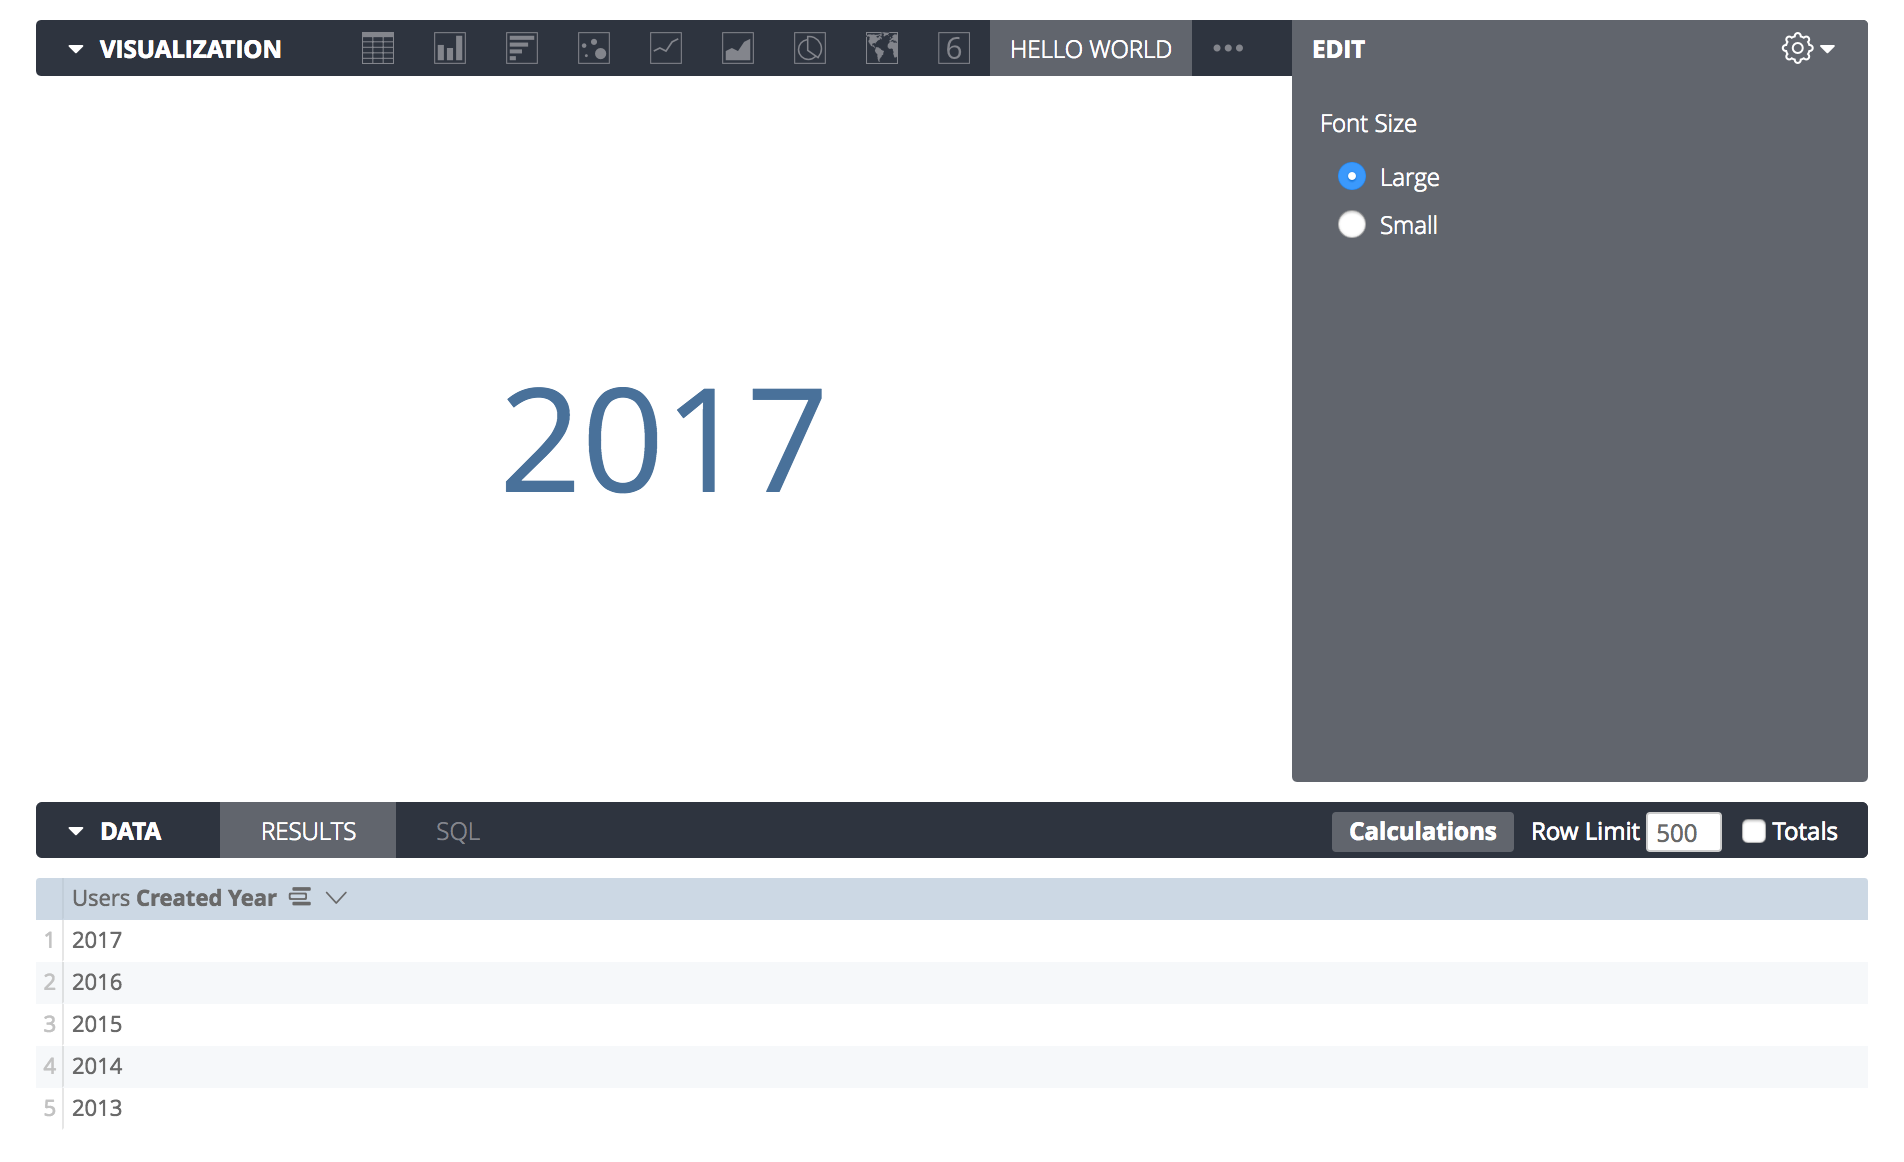
This section describes how to create a custom visualization script that displays the first dimension of a given query.
The final result should look similar to the following image:
Setup
To develop and test a visualization in Looker, you have two options:
- Save the visualization's source code directly in your LookML project (recommended).
- Host your visualization over HTTPS and point to it from Looker.
After you configure one of these options, you can follow the example in this
section to create hello_world.js.
Essential code structure
To view the final source code for this example, see the GitHub repository.
In the folder that you're hosting, create a new blank JavaScript file and name it
hello_world.js.
To register a new custom visualization with Looker, call the
looker.plugins.visualizations.add function and pass it a visualization object.
This object contains the definition of your visualization and its configuration UI.
The following example shows the skeleton of a visualization with all the required
properties filled out. It contains a create function and an updateAsync
function where you can write your visualization code:
looker.plugins.visualizations.add({
  create: function(element, config) {

  },
  updateAsync: function(data, element, config, queryResponse, details, done) {

  }
})
This code is a valid Looker visualization, but it's not yet visual and appears as a blank box.
Setting the stage
Consider the create function, which has two arguments: element and config.
Looker provides an element, which is the
DOM element
that Looker requires you to place your visualization into.
Looker builds this element and makes it the proper size; you
must place content inside it.
The create function provides the opportunity to perform the initial setup of
your element. For this example, you want to create a chart that resembles the
following HTML structure:
<style>
  /* custom styles for your chart */
</style>
<div class="hello-world-vis">
  <div>Data Goes Here</div>
</div>
Using JavaScript, you can insert elements into your DOM element to match this structure.
The following example shows this function with more details added:
create: function(element, config) {

  // Insert a <style> tag with some styles to use later.
  var css = element.innerHTML = `
    <style>
      .hello-world-vis {
        /* Vertical centering */
        height: 100%;
        display: flex;
        flex-direction: column;
        justify-content: center;
        text-align: center;
      }
    </style>
  `;

  // Create a container element to center the text.
  var container = element.appendChild(document.createElement("div"));
  container.className = "hello-world-vis";

  // Create an element to contain the text.
  this._textElement = container.appendChild(document.createElement("div"));

},
This code adds CSS, creates the hello-world-vis container, and adds a div
inside it.
The code also assigns this._textElement to the container that you want to
render into. This is a convenience so you don't have to look it up again later
when the chart begins to render.
The create function is a convenient place to perform setup tasks that only
need to happen once.
Rendering
This section describes how to expand the updateAsync method to visualize
data. This method is called any time the chart must visualize changes or when
any other event occurs that might affect how your chart is rendered (for example,
the chart is resized or a configuration option changes).
For this example, you need to find only the first dimension in the first cell.
You can do so using data, which is an array of every row of the dataset, and
queryResponse, which contains metadata about the query, such as field names
and types.
You can also use a helper method called LookerCharts.Utils.htmlForCell to
provide the proper HTML representation of the data point in that cell. This
method automatically handles elements such as drill links, formatting, and
data actions:
  updateAsync: function(data, element, config, queryResponse, details, done) {

    // Grab the first cell of the data.
    var firstRow = data[0];
    var firstCell = firstRow[queryResponse.fields.dimensions[0].name];

    // Insert the data into the page.
    this._textElement.innerHTML = LookerCharts.Utils.htmlForCell(firstCell);

    // Always call done to indicate a visualization has finished rendering.
    done()
  }
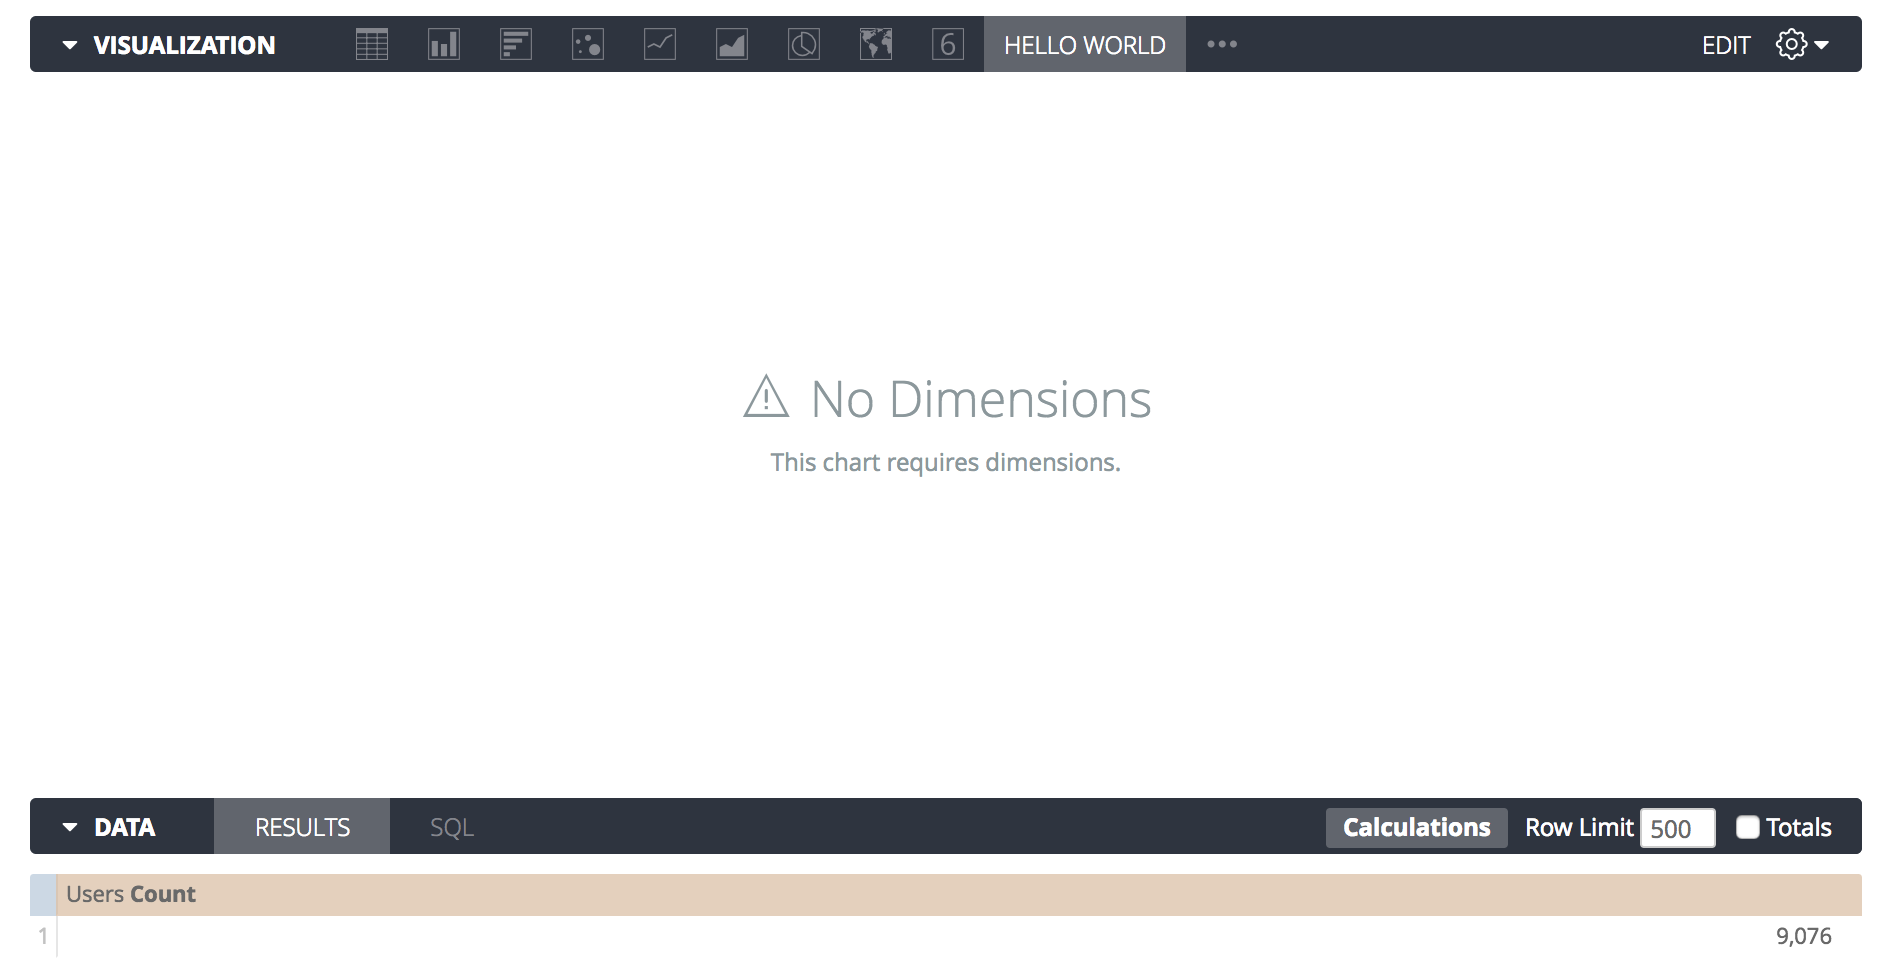
This completes the steps required to have a functioning custom visualization. However, it's important to include a method for handling errors.
Handling errors
The updateAsync code grabs the first row of data, but errors can occur if the
query returns no results or doesn't contain any dimensions.
Without error handling, a JavaScript error appears in the browser console, which might confuse users when the chart doesn't render.
Charts can display custom error messages if they encounter problems while trying
to render. Looker adds two functions to your visualization object:
addError and clearErrors. You can use these functions to display an error message that will make sense to all users.
Because these functions are added to the visualization object, they are available
from the context of your updateAsync function through the this object.
You can modify the beginning of your updateAsync method to detect an error
condition, notify the user of an issue, and exit instead of attempting to render:
  updateAsync: function(data, element, config, queryResponse, details, done) {

    // Clear any errors from previous updates.
    this.clearErrors();

    // Throw some errors and exit if the shape of the data isn't what this chart needs.
    if (queryResponse.fields.dimensions.length == 0) {
      this.addError({title: "No Dimensions", message: "This chart requires dimensions."});
      // Always call done() before exiting early to avoid dashboard exports hanging
      done();
      return;
    }

    if (!data || data.length === 0) {
      this.addError({title: "No Data", message: "The query returned no results."});
      done();
      return;
    }

    // ... the rest of the update code here ...
If the user creates a query that only contains measures, they see an error message similar to the following:
Asynchronous rendering and PDF exports
In the preceding "Hello World" example, the done() function is called
immediately after the DOM is updated. This approach is appropriate because setting
innerHTML is synchronous.
However, if you use charting libraries such as D3.js, Chart.js, or React, your
rendering is likely asynchronous. If you call done() at the bottom of your
script, Looker might capture the screenshot for a PDF or PNG
export before your chart finishes drawing, which can result in a blank tile.
When Looker exports a dashboard, it uses a headless browser and
relies on the done() callback to know when it's safe to take a screenshot.
To ensure that your charts export correctly, you must tie the done() callback to
your library's completion event and disable animations during exports
by using the details.print flag.
The following example shows how to handle asynchronous rendering using D3.js:
  updateAsync: function(data, element, config, queryResponse, details, done) {
    this.clearErrors();

    // Check if Looker is exporting the chart to a PDF/PNG
    const isExport = details && details.print === true;

    // Clear previous elements
    this.svg.selectAll("*").remove();

    const circle = this.svg.append("circle")
      .attr("cx", 50)
      .attr("cy", 50);

    if (isExport) {
      // Instant render for exports. Draw the final state immediately with no transitions
      circle.attr("r", 40);

      // Tell Looker to take the screenshot right now
      done();
    } else {
      // If it's for the browser, start small and animate
      circle.attr("r", 0)
        .transition()
        .duration(1000)
        .attr("r", 40)
        .on("end", () => {
           // Tell Looker the animation is fully complete
           done();
        });
    }
  }
If you use React, ensure you pass the done callback as the third argument to
your render function so Looker waits for React to mount the
components:
  this.chart = ReactDOM.render(
    <MyCustomChart data={data} />,
    element,
    done // Looker waits for React to finish
  );
Configuration
You can allow users to customize aspects of their visualization.
In addition to the other properties of your visualization object, a property
named options is available.
You can use this property to specify what kind of options the chart requires:
looker.plugins.visualizations.add({
  options: {
    font_size: {
      type: "string",
      label: "Font Size",
      values: [
        {"Large": "large"},
        {"Small": "small"}
      ],
      display: "radio",
      default: "large"
    }
  },
  // ... rest of visualization object ...
This example creates a font_size option that displays as radio buttons, allowing
users to choose between "small" and "large" font sizes.
Specifying the options property is required to add the option to the
visualization picker.
To use this option in your code, recall that in the updateAsync method there is
a config parameter. This parameter contains the following selected options:
updateAsync: function(data, element, config, queryResponse, details, done) {
The config object resembles the following:
{font_size: "large"}
When you update the chart, you can check this object and respond accordingly. Add the following check to the end of the update method to implement font size changes:
if (config.font_size == "small") {
  this._textElement.className = "hello-world-text-small";
} else {
  this._textElement.className = "hello-world-text-large";
}
You should also update the <style> tag added in the create method to define the
hello-world-text-small and hello-world-text-large CSS classes:
.hello-world-text-large {
  font-size: 72px;
}
.hello-world-text-small {
  font-size: 18px;
}
Because the updateAsync function is called any time the configuration changes,
and Looker automatically saves the configuration, this is all you
must do to respond to configuration settings.
Next steps
You can view the complete source code to this "Hello World" visualization in the Looker open source GitHub repository.
For more information about additional functionality, see the Visualization API Reference.