部署及使用收集器

本文說明如何部署 OpenTelemetry Collector、設定 Collector 以使用 otlphttp 匯出器和 Telemetry (OTLP) API,以及執行遙測產生器,將指標寫入 Cloud Monitoring。然後在 Cloud Monitoring 中查看這些指標。

如果您使用 Google Kubernetes Engine,可以按照「適用於 GKE 的代管式 OpenTelemetry」一文的說明操作,不必手動部署及設定使用 Telemetry API 的 OpenTelemetry Collector。

如果您使用 SDK 將應用程式的指標直接傳送至 Telemetry API,請參閱「使用 SDK 從應用程式傳送指標」一文,瞭解其他資訊和範例。

您也可以搭配使用 OpenTelemetry Collector 和 Telemetry API,以及 OpenTelemetry 零程式碼檢測。詳情請參閱「使用 Java 適用的 OpenTelemetry 零程式碼檢測功能」。

事前準備

本節說明如何設定環境,以部署及使用收集器。

選取或建立 Google Cloud 專案

選擇這個導覽的 Google Cloud 專案。如果您還沒有 Google Cloud 專案,請建立一個:

  1. 登入 Google Cloud 帳戶。如果您是 Google Cloud新手,歡迎 建立帳戶,親自評估產品在實際工作環境中的成效。新客戶還能獲得價值 $300 美元的免費抵免額,可用於執行、測試及部署工作負載。
  2. In the Google Cloud console, on the project selector page, select or create a Google Cloud project.

    Roles required to select or create a project

    • Select a project: Selecting a project doesn't require a specific IAM role—you can select any project that you've been granted a role on.
    • Create a project: To create a project, you need the Project Creator role (roles/resourcemanager.projectCreator), which contains the resourcemanager.projects.create permission. Learn how to grant roles.

    Go to project selector

  3. Verify that billing is enabled for your Google Cloud project.

  4. In the Google Cloud console, on the project selector page, select or create a Google Cloud project.

    Roles required to select or create a project

    • Select a project: Selecting a project doesn't require a specific IAM role—you can select any project that you've been granted a role on.
    • Create a project: To create a project, you need the Project Creator role (roles/resourcemanager.projectCreator), which contains the resourcemanager.projects.create permission. Learn how to grant roles.

    Go to project selector

  5. Verify that billing is enabled for your Google Cloud project.

安裝指令列工具

本文使用下列指令列工具:

  • gcloud
  • kubectl

gcloudkubectl 工具是 Google Cloud CLI 的一部分。如要瞭解如何安裝這些元件,請參閱「管理 Google Cloud CLI 元件」。如要查看已安裝的 gcloud CLI 元件,請執行下列指令:

gcloud components list

如要設定 gcloud CLI 以供使用,請執行下列指令:

gcloud auth login
gcloud config set project PROJECT_ID

啟用 API

在Google Cloud 專案中啟用 Cloud Monitoring API 和 Telemetry API。請特別注意 Telemetry API telemetry.googleapis.com,您可能第一次遇到這個 API。

執行下列指令來啟用 API:

gcloud services enable monitoring.googleapis.com
gcloud services enable telemetry.googleapis.com

建立叢集

建立 GKE 叢集。

  1. 執行下列指令,建立名為 otlp-test 的 Google Kubernetes Engine 叢集:

    gcloud container clusters create-auto --location CLUSTER_LOCATION otlp-test --project PROJECT_ID
    
  2. 叢集建立完成後,請執行下列指令來連線:

    gcloud container clusters get-credentials otlp-test --region CLUSTER_LOCATION --project PROJECT_ID
    

授權 Kubernetes 服務帳戶

下列指令會將必要的 Identity and Access Management (IAM) 角色授予 Kubernetes 服務帳戶。這些指令假設您使用 Workload Identity Federation for GKE

export PROJECT_NUMBER=$(gcloud projects describe PROJECT_ID --format="value(projectNumber)")

gcloud projects add-iam-policy-binding projects/PROJECT_ID \
  --role=roles/logging.logWriter \
  --member=principal://iam.googleapis.com/projects/$PROJECT_NUMBER/locations/global/workloadIdentityPools/PROJECT_ID.svc.id.goog/subject/ns/opentelemetry/sa/opentelemetry-collector \
  --condition=None

gcloud projects add-iam-policy-binding projects/PROJECT_ID \
  --role=roles/monitoring.metricWriter \
  --member=principal://iam.googleapis.com/projects/$PROJECT_NUMBER/locations/global/workloadIdentityPools/PROJECT_ID.svc.id.goog/subject/ns/opentelemetry/sa/opentelemetry-collector \
  --condition=None

gcloud projects add-iam-policy-binding projects/PROJECT_ID \
  --role=roles/telemetry.tracesWriter \
  --member=principal://iam.googleapis.com/projects/$PROJECT_NUMBER/locations/global/workloadIdentityPools/PROJECT_ID.svc.id.goog/subject/ns/opentelemetry/sa/opentelemetry-collector \
  --condition=None

如果服務帳戶的格式不同,您可以使用 Google Cloud Managed Service for Prometheus 說明文件中的指令授權服務帳戶,並進行下列變更:

  • 將服務帳戶名稱 gmp-test-sa 替換為您的服務帳戶。
  • 授予上一組指令中顯示的角色,而不只是 roles/monitoring.metricWriter 角色。

部署 OpenTelemetry 收集器

複製下列 YAML 檔案,並將其放在名為 collector.yaml 的檔案中,即可建立收集器設定。您也可以在 GitHub 的 otlp-k8s-ingest 存放區中找到下列設定。

在副本中,請務必將 ${GOOGLE_CLOUD_PROJECT} 替換為您的專案 ID PROJECT_ID

只有使用 OpenTelemetry Collector 0.140.0 以上版本時,才能使用 Prometheus 指標的 OTLP。

# Copyright 2024 Google LLC
#
# Licensed under the Apache License, Version 2.0 (the "License");
# you may not use this file except in compliance with the License.
# You may obtain a copy of the License at
#
#     http://www.apache.org/licenses/LICENSE-2.0
#
# Unless required by applicable law or agreed to in writing, software
# distributed under the License is distributed on an "AS IS" BASIS,
# WITHOUT WARRANTIES OR CONDITIONS OF ANY KIND, either express or implied.
# See the License for the specific language governing permissions and
# limitations under the License.

exporters:
  # The googlecloud exporter is used for logs
  googlecloud:
    log:
      default_log_name: opentelemetry-collector
    user_agent: Google-Cloud-OTLP manifests:0.4.0 OpenTelemetry Collector Built By Google/0.128.0 (linux/amd64)
  googlemanagedprometheus:
    user_agent: Google-Cloud-OTLP manifests:0.4.0 OpenTelemetry Collector Built By Google/0.128.0 (linux/amd64)
  # The otlphttp exporter is used to send traces to Google Cloud Trace and
  # metrics to Google Managed Prometheus using OTLP http/proto.
  # The otlp exporter could also be used to send them using OTLP grpc
  otlphttp:
    encoding: proto
    endpoint: https://telemetry.googleapis.com
    # Use the googleclientauth extension to authenticate with Google credentials
    auth:
      authenticator: googleclientauth


extensions:
  # Standard for the collector. Used for probes.
  health_check:
    endpoint: ${env:MY_POD_IP}:13133
  # This is an auth extension that adds Google Application Default Credentials to http and gRPC requests.
  googleclientauth:


processors:
  # This filter is a standard part of handling the collector's self-observability metrics. Not related to OTLP ingestion.
  filter/self-metrics:
    metrics:
      include:
        match_type: strict
        metric_names:
        - otelcol_process_uptime
        - otelcol_process_memory_rss
        - otelcol_grpc_io_client_completed_rpcs
        - otelcol_googlecloudmonitoring_point_count

  # The recommended batch size for the OTLP endpoint is 200 metric data points.
  batch:
    send_batch_max_size: 200
    send_batch_size: 200
    timeout: 5s

  # The k8sattributes processor adds k8s resource attributes to metrics based on the source IP that sent the metrics to the collector.
  # k8s attributes are important for avoiding errors from timeseries "collisions".
  # These attributes help distinguish workloads from each other, and provide useful metadata (e.g. namespace) when querying.
  k8sattributes:
    extract:
      metadata:
      - k8s.namespace.name
      - k8s.deployment.name
      - k8s.statefulset.name
      - k8s.daemonset.name
      - k8s.cronjob.name
      - k8s.job.name
      - k8s.replicaset.name
      - k8s.node.name
      - k8s.pod.name
      - k8s.pod.uid
      - k8s.pod.start_time
    passthrough: false
    pod_association:
    - sources:
      - from: resource_attribute
        name: k8s.pod.ip
    - sources:
      - from: resource_attribute
        name: k8s.pod.uid
    - sources:
      - from: connection

  # Standard processor for gracefully degrading when overloaded to prevent OOM.
  memory_limiter:
    check_interval: 1s
    limit_percentage: 65
    spike_limit_percentage: 20

  # Standard processor for enriching self-observability metrics. Unrelated to OTLP ingestion.
  metricstransform/self-metrics:
    transforms:
    - action: update
      include: otelcol_process_uptime
      operations:
      - action: add_label
        new_label: version
        new_value: Google-Cloud-OTLP manifests:0.4.0 OpenTelemetry Collector Built By Google/0.128.0 (linux/amd64)

  # The resourcedetection processor, similar to the k8sattributes processor, enriches metrics with important metadata.
  # The gcp detector provides the cluster name and cluster location.
  resourcedetection:
    detectors: [gcp]
    timeout: 10s

  # This transform processor avoids ingestion errors if metrics contain attributes with names that are reserved for the prometheus_target resource.
  transform/collision:
    metric_statements:
    - context: datapoint
      statements:
      - set(attributes["exported_location"], attributes["location"])
      - delete_key(attributes, "location")
      - set(attributes["exported_cluster"], attributes["cluster"])
      - delete_key(attributes, "cluster")
      - set(attributes["exported_namespace"], attributes["namespace"])
      - delete_key(attributes, "namespace")
      - set(attributes["exported_job"], attributes["job"])
      - delete_key(attributes, "job")
      - set(attributes["exported_instance"], attributes["instance"])
      - delete_key(attributes, "instance")
      - set(attributes["exported_project_id"], attributes["project_id"])
      - delete_key(attributes, "project_id")

  # The relative ordering of statements between ReplicaSet & Deployment and Job & CronJob are important.
  # The ordering of these controllers is decided based on the k8s controller documentation available at
  # https://kubernetes.io/docs/concepts/workloads/controllers.
  # The relative ordering of the other controllers in this list is inconsequential since they directly
  # create pods.
  transform/aco-gke:
    metric_statements:
    - context: datapoint
      statements:
      - set(attributes["top_level_controller_type"], "ReplicaSet") where resource.attributes["k8s.replicaset.name"] != nil
      - set(attributes["top_level_controller_name"], resource.attributes["k8s.replicaset.name"]) where resource.attributes["k8s.replicaset.name"] != nil
      - set(attributes["top_level_controller_type"], "Deployment") where resource.attributes["k8s.deployment.name"] != nil
      - set(attributes["top_level_controller_name"], resource.attributes["k8s.deployment.name"]) where resource.attributes["k8s.deployment.name"] != nil
      - set(attributes["top_level_controller_type"], "DaemonSet") where resource.attributes["k8s.daemonset.name"] != nil
      - set(attributes["top_level_controller_name"], resource.attributes["k8s.daemonset.name"]) where resource.attributes["k8s.daemonset.name"] != nil
      - set(attributes["top_level_controller_type"], "StatefulSet") where resource.attributes["k8s.statefulset.name"] != nil
      - set(attributes["top_level_controller_name"], resource.attributes["k8s.statefulset.name"]) where resource.attributes["k8s.statefulset.name"] != nil
      - set(attributes["top_level_controller_type"], "Job") where resource.attributes["k8s.job.name"] != nil
      - set(attributes["top_level_controller_name"], resource.attributes["k8s.job.name"]) where resource.attributes["k8s.job.name"] != nil
      - set(attributes["top_level_controller_type"], "CronJob") where resource.attributes["k8s.cronjob.name"] != nil
      - set(attributes["top_level_controller_name"], resource.attributes["k8s.cronjob.name"]) where resource.attributes["k8s.cronjob.name"] != nil
  # For each Prometheus unknown-typed metric, which is a gauge, create a counter that is an exact copy of this metric.
  # The GCP OTLP endpoint will add appropriate the appropriate suffixes for the counter and gauge.
  transform/unknown-counter:
    metric_statements:
    - context: metric
      statements:
      # Copy the unknown metric, but add a suffix so we can distinguish the copy from the original.
      - copy_metric(Concat([metric.name, "unknowncounter"], ":")) where metric.metadata["prometheus.type"] == "unknown" and not HasSuffix(metric.name, ":unknowncounter")
      # Change the copy to a monotonic, cumulative sum.
      - convert_gauge_to_sum("cumulative", true) where HasSuffix(metric.name, ":unknowncounter")
      # Delete the extra suffix once we are done.
      - set(metric.name, Substring(metric.name, 0, Len(metric.name)-Len(":unknowncounter"))) where HasSuffix(metric.name, ":unknowncounter")

  # When sending telemetry to the GCP OTLP endpoint, the gcp.project_id resource attribute is required to be set to your project ID.
  resource/gcp_project_id:
    attributes:
    - key: gcp.project_id
      # MAKE SURE YOU REPLACE THIS WITH YOUR PROJECT ID
      value: ${GOOGLE_CLOUD_PROJECT}
      action: insert
  # The metricstarttime processor is important to include if you are using the prometheus receiver to ensure the start time is set properly.
  # It is a no-op otherwise.
  metricstarttime:
    strategy: subtract_initial_point

receivers:
  # This collector is configured to accept OTLP metrics, logs, and traces, and is designed to receive OTLP from workloads running in the cluster.
  otlp:
    protocols:
      grpc:
        endpoint: ${env:MY_POD_IP}:4317
      http:
        cors:
          allowed_origins:
          - http://*
          - https://*
        endpoint: ${env:MY_POD_IP}:4318

  # Push the collector's own self-observability metrics to the otlp receiver.
  otlp/self-metrics:
    protocols:
      grpc:
        endpoint: ${env:MY_POD_IP}:14317

service:
  extensions:
  - health_check
  - googleclientauth
  pipelines:
    # Recieve OTLP logs, and export logs using the googlecloud exporter.
    logs:
      exporters:
      - googlecloud
      processors:
      - k8sattributes
      - resourcedetection
      - memory_limiter
      - batch
      receivers:
      - otlp
    # Recieve OTLP metrics, and export metrics to GMP using the otlphttp exporter.
    metrics/otlp:
      exporters:
      - otlphttp
      processors:
      - k8sattributes
      - memory_limiter
      - resource/gcp_project_id
      - resourcedetection
      - transform/collision
      - transform/aco-gke
      - transform/unknown-counter
      - metricstarttime
      - batch
      receivers:
      - otlp
    # Scrape self-observability Prometheus metrics, and export metrics to GMP using the otlphttp exporter.
    metrics/self-metrics:
      exporters:
      - otlphttp
      processors:
      - filter/self-metrics
      - metricstransform/self-metrics
      - k8sattributes
      - memory_limiter
      - resource/gcp_project_id
      - resourcedetection
      - batch
      receivers:
      - otlp/self-metrics
    # Recieve OTLP traces, and export traces using the otlphttp exporter.
    traces:
      exporters:
      - otlphttp
      processors:
      - k8sattributes
      - memory_limiter
      - resource/gcp_project_id
      - resourcedetection
      - batch
      receivers:
      - otlp
  telemetry:
    logs:
      encoding: json
    metrics:
      readers:
      - periodic:
          exporter:
            otlp:
              protocol: grpc
              endpoint: ${env:MY_POD_IP}:14317

設定已部署的 OpenTelemetry 收集器

建立 Kubernetes 資源,設定收集器部署作業。

  1. 執行下列指令,建立 opentelemetry 命名空間,並在該命名空間中建立收集器設定:

    kubectl create namespace opentelemetry
    
    kubectl create configmap collector-config -n opentelemetry --from-file=collector.yaml
    
  2. 執行下列指令,使用 Kubernetes 資源設定收集器:

    kubectl apply -f https://raw.githubusercontent.com/GoogleCloudPlatform/otlp-k8s-ingest/refs/heads/otlpmetric/k8s/base/2_rbac.yaml
    
    kubectl apply -f https://raw.githubusercontent.com/GoogleCloudPlatform/otlp-k8s-ingest/refs/heads/otlpmetric/k8s/base/3_service.yaml
    
    kubectl apply -f https://raw.githubusercontent.com/GoogleCloudPlatform/otlp-k8s-ingest/refs/heads/otlpmetric/k8s/base/4_deployment.yaml
    
    kubectl apply -f https://raw.githubusercontent.com/GoogleCloudPlatform/otlp-k8s-ingest/refs/heads/otlpmetric/k8s/base/5_hpa.yaml
    
  3. 等待收集器 Pod 達到「執行中」狀態,並準備好 1/1 個容器。如果是首次部署工作負載,在 Autopilot 上大約需要三分鐘。如要檢查 Pod,請使用下列指令:

    kubectl get po -n opentelemetry -w
    

    如要停止監控 Pod 狀態,請輸入 Ctrl-C 停止指令。

  4. 您也可以檢查收集器記錄,確保沒有明顯錯誤:

    kubectl logs -n opentelemetry deployment/opentelemetry-collector
    

部署遙測生成器

你可以使用開放原始碼的 telemetrygen 工具測試設定。這個應用程式會產生遙測資料,並傳送至收集器。

  1. 如要在 opentelemetry-demo 命名空間中部署 telemetrygen 應用程式,請執行下列指令:

    kubectl apply -f https://raw.githubusercontent.com/GoogleCloudPlatform/otlp-k8s-ingest/refs/heads/main/sample/app.yaml
    
  2. 建立部署後,系統可能需要一段時間才能建立 Pod 並開始執行。如要檢查 Pod 的狀態,請執行下列指令:

    kubectl get po -n opentelemetry-demo -w
    

    如要停止監控 Pod 狀態,請輸入 Ctrl-C 停止指令。

使用 Metrics Explorer 查詢指標

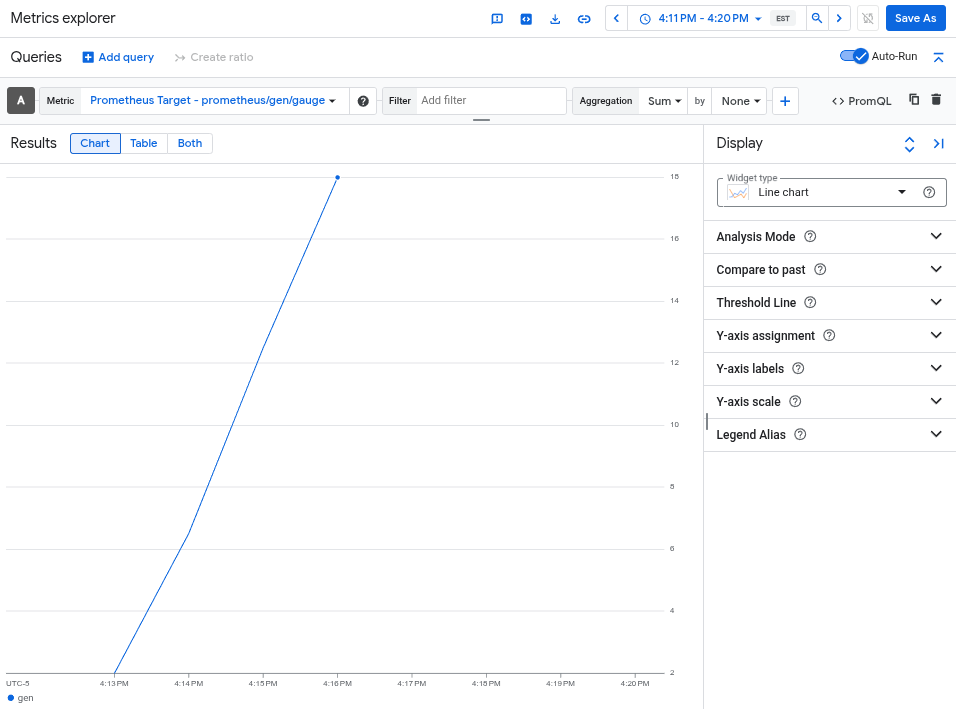
telemetrygen 工具會寫入名為 gen 的指標。您可以在 Metrics Explorer 的查詢產生器介面和 PromQL 查詢編輯器中,查詢這項指標。

前往 Google Cloud 控制台的 「指標探索器」頁面:

前往 Metrics Explorer

如果您是使用搜尋列尋找這個頁面,請選取子標題為「Monitoring」的結果

  • 如果您使用 Metrics Explorer 查詢建構工具介面,指標的完整名稱為 prometheus.googleapis.com/gen/gauge
  • 如果您使用 PromQL 查詢編輯器,可以透過名稱 gen 查詢指標。

下圖顯示 Metrics Explorer 中的 gen 指標圖表:

圖表會顯示由 otlphttp 匯出工具擷取的 gen 指標。

刪除叢集

查詢指標驗證部署作業後,即可刪除叢集。如要刪除叢集,請執行下列指令:

gcloud container clusters delete --location CLUSTER_LOCATION otlp-test --project PROJECT_ID

後續步驟