
This document outlines the steps to instrument and deploy a self-hosted Model Context Protocol (MCP) server, enabling the collection of telemetry. The example in this document builds an MCP server by using FastMCP and deploys the MCP server using Cloud Run. FastMCP includes OpenTelemetry instrumentation that collects telemetry from all MCP operations.
This document describes the following steps:
- Prepare your Python project with the
uvpackage manager. - Create an MCP server for math operations.
- Deploy to Cloud Run.
- Authenticate MCP client.
- Test the self-hosted MCP server.
- View your telemetry data.
Before you begin
- Sign in to your Google Cloud account. If you're new to Google Cloud, create an account to evaluate how our products perform in real-world scenarios. New customers also get $300 in free credits to run, test, and deploy workloads.
-
In the Google Cloud console, on the project selector page, select or create a Google Cloud project.
Roles required to select or create a project
- Select a project: Selecting a project doesn't require a specific IAM role—you can select any project that you've been granted a role on.
-
Create a project: To create a project, you need the Project Creator role
(
roles/resourcemanager.projectCreator), which contains theresourcemanager.projects.createpermission. Learn how to grant roles.
-
Verify that billing is enabled for your Google Cloud project.
-
In the Google Cloud console, on the project selector page, select or create a Google Cloud project.
Roles required to select or create a project
- Select a project: Selecting a project doesn't require a specific IAM role—you can select any project that you've been granted a role on.
-
Create a project: To create a project, you need the Project Creator role
(
roles/resourcemanager.projectCreator), which contains theresourcemanager.projects.createpermission. Learn how to grant roles.
-
Verify that billing is enabled for your Google Cloud project.
Enable the Artifact Registry, Cloud Run, Cloud Build, Telemetry, Cloud Logging, Cloud Monitoring, and Cloud Trace APIs.
Roles required to enable APIs
To enable APIs, you need the
serviceusage.services.enablepermission. If you created the project, then you likely already have this permission through the Owner role (roles/owner). Otherwise, you can get this permission through the Service Usage Admin role (roles/serviceusage.serviceUsageAdmin). Learn how to grant roles.- Set up your Cloud Run development environment in your Google Cloud project.
- Make sure you have the appropriate
permissions to deploy services, and the Cloud Run Admin (
roles/run.admin) and Service Account User (roles/iam.serviceAccountUser) roles granted to your account. - Grant the Cloud Run
Invoker (
roles/run.invoker) role to your account. This role allows the self-hosted MCP server to access the Cloud Run service. -
In the Google Cloud console, go to the IAM page.
Go to IAM - Select the project.
- Click Grant access.
-
In the New principals field, enter your user identifier. This is typically the email address used to deploy the Cloud Run service.
- In the Select a role list, select a role.
- To grant additional roles, click Add another role and add each additional role.
- Click Save.
- PROJECT_ID: The identifier of the project.
- PRINCIPAL: An identifier for the principal that you want to
grant the role to. Principal identifiers usually have the following form:
PRINCIPAL-TYPE:ID. For example,user:my-user@example.com. For a full list of the formats thatPRINCIPALcan have, see Principal identifiers. - ROLE: An IAM role.
If you are under a domain restriction organization policy restricting unauthenticated invocations for your project, then you must access your deployed service as described in Testing private services.
- Install Uv, a Python package and project manager.
Learn how to grant the roles
Console
gcloud
To grant the required IAM roles to your account on your project:
   gcloud projects add-iam-policy-binding PROJECT_ID \
       --member=PRINCIPAL \
       --role=ROLE
Replace:
Prepare your Python project
The following steps describe how to set up your Python project with the uv package manager.
Create a folder named
mcp-on-cloudrunto store the source code for deployment:mkdir mcp-on-cloudrun cd mcp-on-cloudrunCreate a Python project with the
uvtool to generate apyproject.tomlfile:uv init --name "mcp-on-cloudrun" --description "Example of deploying an MCP server on Cloud Run" --bare --python 3.10The
uv initcommand creates the followingpyproject.tomlfile:[project] name = "mcp-server" version = "0.1.0" description = "Example of deploying an MCP server on Cloud Run" readme = "README.md" requires-python = ">=3.10" dependencies = []Create the following additional new files:
server.pyfor the MCP server source code.otel_setup.pyto configure OpenTelemetry.test_server.pyto test the self-hosted server.- A Dockerfile for deploying to Cloud Run.
touch server.py otel_setup.py test_server.py DockerfileYour project directory should contain the following structure:
├── mcp-on-cloudrun
│   ├── pyproject.toml
│   ├── otel_setup.py
│   ├── server.py
│   ├── test_server.py
│   └── Dockerfile
Create an MCP server for math operations
In this section, you set up a math MCP server with FastMCP. FastMCP provides a quick way to build MCP servers and clients with Python.
Follow these steps to create an MCP server for math operations such as addition and subtraction.
Run the following command to add FastMCP and the required OpenTelemetry dependencies in the
pyproject.tomlfile:uv add fastmcp==3.2.0 opentelemetry-api==1.40.0 opentelemetry-sdk==1.40.0 opentelemetry-exporter-otlp-proto-grpc==1.40.0 --no-syncAdd the following OpenTelemetry setup code in the
otel_setup.pyfile:Add the following math MCP server source code in the
server.pyfile:Include the following code in the Dockerfile to use the
uvtool for running theserver.pyfile:
Deploy to Cloud Run
You can deploy the MCP server as a container image or as source code:
Container image
To deploy an MCP server packaged as a container image, follow these instructions.
Create an Artifact Registry repository to store the container image:
gcloud artifacts repositories create self-hosted-mcp-servers \
--repository-format=docker \
--location=us-central1 \
--description="Repository for self-hosted MCP servers" \
--project=PROJECT_ID
Build the container image and push it to Artifact Registry with Cloud Build:
gcloud builds submit --region=us-central1 --tag us-central1-docker.pkg.dev/PROJECT_ID/self-hosted-mcp-servers/mcp-server:latestDeploy the MCP server container image to Cloud Run:
gcloud run deploy mcp-server \
--image us-central1-docker.pkg.dev/PROJECT_ID/self-hosted-mcp-servers/mcp-server:latest \
--region=us-central1 \
--no-allow-unauthenticated
Source
You can deploy self-hosted MCP servers to Cloud Run from their sources.
Deploy from source by running the following command:
gcloud run deploy mcp-server --no-allow-unauthenticated --region=us-central1 --source .
Authenticate MCP client
If you deployed your service with the --no-allow-unauthenticated flag, any MCP
client that connects to your self-hosted MCP server must authenticate.
Grant the Cloud Run Invoker (
roles/run.invoker) role to the service account. This Identity and Access Management policy binding makes sure that a strong security mechanism is used to authenticate your local MCP client.Run the Cloud Run proxy to create an authenticated tunnel to the self-hosted MCP server on your local machine:
gcloud run services proxy mcp-server --region=us-central1If the Cloud Run proxy is not yet installed, this command prompts you to download the proxy. Follow the prompts to download and install the proxy.
Cloud Run authenticates all traffic to http://127.0.0.1:8080 and forwards
requests to the self-hosted MCP server.
Test the self-hosted MCP server
You test and connect to your self-hosted MCP server by using the FastMCP client
and accessing the URL http://127.0.0.1:8080/mcp.
To test and invoke the add and subtract mechanism, follow these steps:
Before running the test server, run the Cloud Run proxy.
Create a test file called
test_server.pyand add the following code:In a new terminal, run the test server:
uv run test_server.pyYou should see the following output:
 🛠️ Tool found: add
 🛠️ Tool found: subtract
 🪛 Calling add tool for 1 + 2
 ✅ Result: 3
 🪛 Calling subtract tool for 10 - 3
 ✅ Result: 7
View your telemetry data
This section describes how you can view the log, metric, and trace data your self-hosted MCP server generates.
Before you begin
To get the permissions that you need to view your log, metric, and trace data, ask your administrator to grant you the following IAM roles on your project:
- Logs Viewer (
roles/logging.viewer) - Monitoring Viewer (
roles/monitoring.viewer) - Cloud Trace User (
roles/cloudtrace.user)
For more information about granting roles, see Manage access to projects, folders, and organizations.
You might also be able to get the required permissions through custom roles or other predefined roles.
View telemetry
To learn about how to view your log, metric, and trace data, see the following:
Log data
In the Google Cloud console, go to the Logs Explorer page:
If you use the search bar to find this page, then select the result whose subheading is Logging.
For more information about using the Logs Explorer page, see View and analyze logs.
Metric data
In the Google Cloud console, go to the leaderboard Metrics explorer page:
If you use the search bar to find this page, then select the result whose subheading is Monitoring.
For more information about using the Metrics Explorer page, see Create charts with Metrics Explorer.
Trace data
In the Google Cloud console, go to the
![]() Trace explorer page:
Trace explorer page:
You can also find this page by using the search bar.
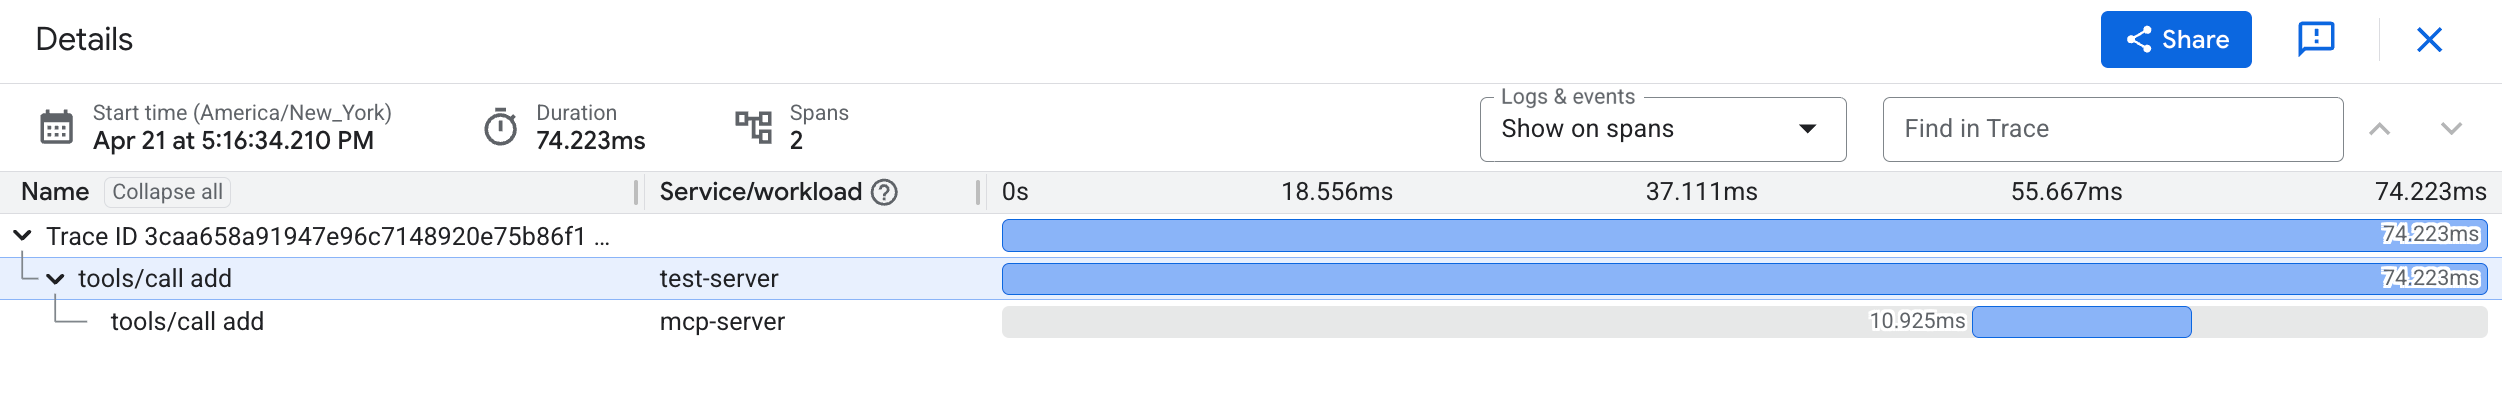
The following screenshot illustrates the Details pane in the
Trace Explorer page, which displays trace spans generated
from tools/call operations:
For more information about using the Trace Explorer page, see Find and explore traces.
What's next
Learn how to investigate MCP calls using Cloud Trace.
Learn more about the options you have to view, explore, and analyze your telemetry data.
Learn more about hosting MCP servers on Cloud Run.
Learn how to use an MCP server to deploy code to Cloud Run.