
本文示範如何使用 OpenTelemetry 零程式碼檢測功能,自動檢測在 Google Kubernetes Engine (GKE) 上執行的 Java 應用程式。零程式碼檢測功能可讓您全面觀察 Java 工作負載,且手動操作量極少。
這份逐步操作說明文件提供詳細步驟,說明如何將範例 Java 應用程式部署至 GKE、使用 OpenTelemetry 自動檢測應用程式,以及使用 Google Cloud Observability 顯示產生的遙測信號。
本逐步導覽說明如何自動檢測在 GKE 上執行的 Java 工作負載,但您可以將這些操作說明擴展至其他支援的語言。
為什麼要使用零程式碼插碼?
OpenTelemetry 中的零程式碼檢測 (也稱為自動檢測) 是一項強大工具,可讓應用程式開發人員在程式碼中加入可設定的觀測能力,不必編寫任何額外程式碼或修改現有程式碼。零程式碼插碼功能會自動將插碼新增至主動部署的應用程式程式庫,藉由發出黃金信號,提供可靠的應用程式效能洞察資料。因此,無程式碼檢測是應用程式觀測能力歷程的絕佳起點。
Java 中的零程式碼檢測功能會檢測該語言生態系統中廣泛使用的熱門程式庫,藉此發出指標和追蹤範圍。如果是 Java,指標包括:
- JVM 執行階段指標,由 Java 平台發出
- Java Http Client 用戶端程式庫和 Google Http Client 用戶端程式庫等程式庫發出的 HttpClient 指標和 HttpClient 時距。
- 資料庫用戶端指標和 資料庫用戶端範圍,可從 JDBC 和 Lettuce 等程式庫發出。
發出的指標集取決於受監控的應用程式,以及應用程式使用的程式庫。如需可由 Java 零程式碼檢測代理程式檢測的程式庫和架構完整清單,請參閱「支援的程式庫和架構」。
自動插碼功能可協助您執行下列操作:
- 無須變更任何程式碼,即可監控黃金信號。
- 將高 p99.9 延遲時間與個別使用者追蹤記錄建立關聯,涵蓋每個 RPC 呼叫。
- 從各種熱門程式庫和架構,取得指標、記錄和追蹤記錄的一致遙測資料。
如要進一步瞭解零程式碼檢測,請參閱 OpenTelemetry 的零程式碼。
總覽
如要為在 GKE 上執行的 Java 工作負載新增可觀測性,請部署下列元件:
- OpenTelemetry 零程式碼檢測,可從應用程式產生遙測資料。
- OpenTelemetry Collector 會收集應用程式產生的遙測資料,並加入重要中繼資料和內容,然後將資料傳送至 Google Cloud 供使用。
在本逐步導覽中,您會在 GKE 上部署已檢測的 Java 應用程式,將指標和追蹤記錄傳送至 Google Cloud。接著,您可以使用 Google Cloud的觀測功能 (例如 Metrics Explorer、Logs Explorer 和 Trace Explorer) 查看這些遙測信號。如要瞭解如何查看及使用產生的遙測資料,請參閱「查看遙測資料」。
本逐步導覽會使用下列付費服務來寫入信號:
- Cloud Monitoring 的 Managed Service for Prometheus
- Cloud Logging
- Cloud Trace
- Google Kubernetes Engine
- Cloud Build
- Artifact Registry
您可以使用 Pricing Calculator 根據預測用量估算費用。
事前準備
本節說明如何設定環境,以部署及檢測應用程式,然後執行該應用程式。
選取或建立 Google Cloud 專案
選擇這個導覽的 Google Cloud 專案。如果您還沒有 Google Cloud 專案,請建立一個:
- 登入 Google Cloud 帳戶。如果您是 Google Cloud新手,歡迎 建立帳戶,親自評估產品在實際工作環境中的成效。新客戶還能獲得價值 $300 美元的免費抵免額,可用於執行、測試及部署工作負載。
-
In the Google Cloud console, on the project selector page, select or create a Google Cloud project.
Roles required to select or create a project
- Select a project: Selecting a project doesn't require a specific IAM role—you can select any project that you've been granted a role on.
-
Create a project: To create a project, you need the Project Creator role
(
roles/resourcemanager.projectCreator), which contains theresourcemanager.projects.createpermission. Learn how to grant roles.
-
Verify that billing is enabled for your Google Cloud project.
-
In the Google Cloud console, on the project selector page, select or create a Google Cloud project.
Roles required to select or create a project
- Select a project: Selecting a project doesn't require a specific IAM role—you can select any project that you've been granted a role on.
-
Create a project: To create a project, you need the Project Creator role
(
roles/resourcemanager.projectCreator), which contains theresourcemanager.projects.createpermission. Learn how to grant roles.
-
Verify that billing is enabled for your Google Cloud project.
安裝指令列工具
本文使用下列指令列工具:
gcloudkubectl
gcloud 和 kubectl 工具是 Google Cloud CLI 的一部分。如要瞭解如何安裝這些元件,請參閱「管理 Google Cloud CLI 元件」。如要查看已安裝的 gcloud CLI 元件,請執行下列指令:
gcloud components list
設定環境變數
為減少輸入常用值、避免輸入錯誤,並讓本文件中的指令可執行,請設定下列環境變數:
export GOOGLE_CLOUD_PROJECT=PROJECT_ID
export CLUSTER_NAME=CLUSTER_NAME
export CLUSTER_REGION=us-east1
export ARTIFACT_REGISTRY=opentelemetry-autoinstrument-registry
export REGISTRY_LOCATION=us-east4
執行指令前,請先替換下列變數,或使用預設值:
- PROJECT_ID:專案的 ID。
- CLUSTER_NAME:叢集名稱。這可以是新叢集或現有叢集。
- us-east1:叢集所在的區域。如果使用現有叢集,請使用該叢集的區域。
- opentelemetry-autoinstrument-registry:Artifact Registry 存放區的名稱。 這可以是新的或現有的存放區。
- us-east4:Artifact Registry 存放區的區域。 如果您使用現有存放區,請使用該存放區的區域。
如果在執行本文中的指令時發生錯誤,請檢查終端機環境中是否已正確設定這些變數。
啟用 API
如要使用本文中的服務,您必須在 Google Cloud 專案中啟用下列 API:
- Artifact Registry API:
artifactregistry.googleapis.com - Cloud Build API:
cloudbuild.googleapis.com - Google Kubernetes Engine:
container.googleapis.com - Identity and Access Management API:
iam.googleapis.com - Cloud Logging API:
logging.googleapis.com - Cloud Monitoring API:
monitoring.googleapis.com - Telemetry API:
telemetry.googleapis.com
這些 API (Telemetry API 可能除外) 可能已在專案中啟用。 Google Cloud 執行下列指令,列出已啟用的 API:
gcloud services list
啟用所有未啟用的 API。
請特別注意 Telemetry API telemetry.googleapis.com,您可能第一次遇到這個 API。
如要啟用尚未啟用的 API,請執行對應 API 的指令:
gcloud services enable artifactregistry.googleapis.com
gcloud services enable cloudbuild.googleapis.com
gcloud services enable container.googleapis.com
gcloud services enable iam.googleapis.com
gcloud services enable logging.googleapis.com
gcloud services enable monitoring.googleapis.com
gcloud services enable telemetry.googleapis.com
取得權限
-
如要取得執行應用程式,以及讓應用程式寫入記錄、指標和追蹤資料所需的權限,請要求管理員授予您下列 IAM 角色:
- 專案的「記錄寫入者」 (
roles/logging.logWriter) - Monitoring 指標寫入者 (
roles/monitoring.metricWriter) 專案 - 專案的「Cloud 遙測資料追蹤記錄寫入者」 (
roles/telemetry.tracesWriter) - 專案的開發人員 (
roles/container.developer) - 專案的 Cloud Build 編輯者 (
roles/cloudbuild.builds.editor) - 專案的 Artifact Registry 寫入者 (
roles/artifactregistry.writer) - 專案的服務帳戶使用者 (
roles/iam.serviceAccountUser) - 配額專案的服務使用情形用戶 (
roles/serviceusage.serviceUsageConsumer)
如果您在 Cloud Shell、 Google Cloud 資源或本機開發環境中執行範例,這些權限就已足夠。如要瞭解如何設定配額專案,請參閱「設定配額專案」。
- 專案的「記錄寫入者」 (
-
如要取得查看記錄、指標和追蹤資料所需的權限,請要求管理員授予您專案的下列 IAM 角色:
- 記錄檢視器 (
roles/logging.viewer) - Monitoring 檢視者 (
roles/monitoring.viewer) - Cloud Trace 使用者 (
roles/cloudtrace.user)
- 記錄檢視器 (
設定叢集
為範例應用程式和收集器設定 GKE 叢集:
執行下列指令,登入 Google Cloud :
gcloud auth login
gcloud config set project PROJECT_ID
如果還沒有 GKE 叢集,請執行下列指令,建立 Autopilot 叢集:
gcloud container clusters create-auto --region us-east1 CLUSTER_NAME --project PROJECT_ID如要與叢集互動,請執行下列指令,連線至本機
kubectl公用程式:gcloud container clusters get-credentials CLUSTER_NAME --region us-east1 --project PROJECT_ID
部署 Java 應用程式
本節中的步驟會在叢集上部署未經過檢測的 Java 範例應用程式,也就是 OpenTelemetry Spring Boot 檢測範例。本節會使用 Cloud Build 和 Artifact Registry 建立及儲存應用程式映像檔。
如果還沒有 Artifact Registry 存放區,請執行下列指令來建立存放區:
gcloud artifacts repositories create opentelemetry-autoinstrument-registry --repository-format=docker --location=us-east4 --description="GKE Autoinstrumentation sample app"執行下列指令,複製範例應用程式:
git clone https://github.com/GoogleCloudPlatform/opentelemetry-operations-java.git請設定下列環境變數:
export GOOGLE_CLOUD_PROJECT=PROJECT_ID
export ARTIFACT_REGISTRY=opentelemetry-autoinstrument-registry
export REGISTRY_LOCATION=us-east4
執行下列指令,建構應用程式映像檔並推送至 Artifact Registry 存放區:
pushd opentelemetry-operations-java/examples/instrumentation-quickstart && \ gcloud builds submit --config <(envsubst < cloudbuild-uninstrumented-app.yaml) . && \ popd為應用程式建立 Kubernetes 部署作業設定檔。 複製下列設定,並儲存至名為
deployment.yaml的檔案:apiVersion: v1 kind: Service metadata: name: quickstart-app labels: app: quickstart-app app.kubernetes.io/part-of: gke-autoinstrument-guide spec: ports: - port: 8080 targetPort: 8080 name: quickstart-app selector: app: quickstart-app --- apiVersion: apps/v1 kind: Deployment metadata: name: quickstart-app labels: app: quickstart-app app.kubernetes.io/part-of: gke-autoinstrument-guide spec: replicas: 2 selector: matchLabels: app: quickstart-app template: metadata: labels: app: quickstart-app spec: containers: - name: quickstart-app image: us-east4-docker.pkg.dev/PROJECT_ID/opentelemetry-autoinstrument-registry/java-quickstart:latest ports: - containerPort: 8080 name: quickstart-app執行下列指令,為應用程式建立命名空間:
kubectl create namespace APPLICATION_NAMESPACE執行下列指令,將 Deployment 設定套用至叢集:
kubectl apply -f deployment.yaml -n APPLICATION_NAMESPACE建立部署後,系統可能需要一段時間才能建立 Pod 並開始執行。如要檢查 Pod 的狀態,請執行下列指令:
kubectl get po -n APPLICATION_NAMESPACE -w如要停止監控 Pod 狀態,請輸入 Ctrl-C 停止指令。
設定 OpenTelemetry Collector 執行個體
在本節中,您將建立另一個部署作業,在 GKE 叢集中執行 Google 建構的 OpenTelemetry Collector 執行個體。收集器已設定為使用下列匯出工具匯出資料:
- 使用 OTLP HTTP 匯出工具取得指標
- 使用 OTLP HTTP 匯出工具追蹤
- 使用 Google Cloud Exporter 匯出記錄
您不必按照本文件中的手動步驟部署 OpenTelemetry Collector,可以改用 GKE 適用的代管 OpenTelemetry,在代管環境中使用 Google 建構的 OpenTelemetry Collector。
執行下列指令,授權 Kubernetes 服務帳戶部署 OpenTelemetry Collector:
export PROJECT_NUMBER=$(gcloud projects describe PROJECT_ID --format="value(projectNumber)")

gcloud projects add-iam-policy-binding projects/PROJECT_ID \
  --role=roles/logging.logWriter \
  --member=principal://iam.googleapis.com/projects/$PROJECT_NUMBER/locations/global/workloadIdentityPools/PROJECT_ID.svc.id.goog/subject/ns/opentelemetry/sa/opentelemetry-collector \
  --condition=None

gcloud projects add-iam-policy-binding projects/PROJECT_ID \
  --role=roles/monitoring.metricWriter \
  --member=principal://iam.googleapis.com/projects/$PROJECT_NUMBER/locations/global/workloadIdentityPools/PROJECT_ID.svc.id.goog/subject/ns/opentelemetry/sa/opentelemetry-collector \
  --condition=None

gcloud projects add-iam-policy-binding projects/PROJECT_ID \
  --role=roles/telemetry.tracesWriter \
  --member=principal://iam.googleapis.com/projects/$PROJECT_NUMBER/locations/global/workloadIdentityPools/PROJECT_ID.svc.id.goog/subject/ns/opentelemetry/sa/opentelemetry-collector \
  --condition=None
執行下列指令,在 GKE 叢集上部署 Google 建構的 OpenTelemetry Collector 執行個體,並採用建議的預設設定:
kubectl kustomize https://github.com/GoogleCloudPlatform/otlp-k8s-ingest//k8s/base?ref=otlpmetric | envsubst | kubectl apply -f -這項設定會將收集器部署至
opentelemetry命名空間。建立部署後,系統可能需要一段時間才能建立 Pod 並開始執行。如要檢查 Pod 的狀態,請執行下列指令:
kubectl get po -n opentelemetry -w如要停止監控 Pod 狀態,請輸入 Ctrl-C 停止指令。
設定 OpenTelemetry 零程式碼檢測
如要為部署在 GKE 上的應用程式設定 OpenTelemetry 零程式碼檢測,請在 GKE 叢集上安裝 OpenTelemetry Operator。OpenTelemetry Operator 提供 Kubernetes 自訂資源定義 (CRD) 的存取權,也就是 Instrumentation 資源,可用於將自動檢測功能插入叢集內執行的 Kubernetes 資源。
系統會使用特殊註解,將 Instrumentation Resource「插入」或「套用」至特定工作負載。OpenTelemetry 運算子會觀察叢集內執行的資源上的這些註解,並在這些資源管理的應用程式中插入適當的檢測。
如果尚未安裝 Helm CLI,請執行下列指令來安裝 Helm:
curl -fsSL -o get_helm.sh https://raw.githubusercontent.com/helm/helm/main/scripts/get-helm-3

chmod 700 get_helm.sh

./get_helm.sh
如果叢集上尚未安裝
cert-manager,請執行下列指令進行安裝:helm repo add jetstack https://charts.jetstack.io helm repo update helm install \ --create-namespace \ --namespace cert-manager \ --set installCRDs=true \ --set global.leaderElection.namespace=cert-manager \ --set extraArgs={--issuer-ambient-credentials=true} \ cert-manager jetstack/cert-manager執行下列指令,並使用 0.140.0 以上版本,安裝 OpenTelemetry Operator:
kubectl apply -f https://github.com/open-telemetry/opentelemetry-operator/releases/download/v0.140.0/opentelemetry-operator.yaml建立名為
instrumentation.yaml的檔案,並在當中加入下列內容,為 Instrumentation Custom Resource 建立設定檔:apiVersion: opentelemetry.io/v1alpha1 kind: Instrumentation metadata: name: sample-java-auto-instrumentation spec: exporter: endpoint: http://opentelemetry-collector.opentelemetry.svc.cluster.local:4317 sampler: type: parentbased_traceidratio # Adjust the sampling rate to control cost argument: "0.01" java: env: - name: OTEL_EXPORTER_OTLP_PROTOCOL value: grpc - name: OTEL_LOGS_EXPORTER value: none為運算子建立命名空間。您可以使用應用程式命名空間的相同值 APPLICATION_NAMESPACE。
kubectl create namespace INSTRUMENTATION_NAMESPACE在叢集中建立 Instrumentation 自訂資源,然後執行下列指令套用
instrumentation.yaml檔案:kubectl apply -f instrumentation.yaml -n INSTRUMENTATION_NAMESPACE將自動檢測註解套用至先前部署的 Java 應用程式範例。執行下列指令,使用註解修補原始部署作業:
kubectl patch deployment.apps/quickstart-app -n APPLICATION_NAMESPACE -p '{"spec":{"template":{"metadata":{"annotations":{"instrumentation.opentelemetry.io/inject-java": "'"INSTRUMENTATION_NAMESPACE"'/sample-java-auto-instrumentation"}}}}}'修補 Deployment 後,應用程式 Deployment 會重新啟動,您可以執行下列指令,檢查應用程式中 Pod 的狀態:
kubectl get po -n APPLICATION_NAMESPACE -w如要停止監控 Pod 狀態,請輸入 Ctrl-C 停止指令。
部署在 GKE 叢集中的 Java 應用程式現在會自動完成檢測。
從已部署的應用程式產生遙測資料
如要從自動檢測的應用程式產生遙測資料,您需要向應用程式傳送要求,模擬使用者活動。您可以執行流量模擬器,產生穩定的流量。本節說明如何下載模擬器、使用 Cloud Build 建構模擬器、將映像檔儲存在 Artifact Registry 中,以及部署模擬器:
執行下列指令,下載流量模擬器應用程式:
mkdir traffic-simulator && pushd traffic-simulator && \
curl -O https://raw.githubusercontent.com/GoogleCloudPlatform/opentelemetry-operator-sample/refs/heads/main/recipes/self-managed-otlp-ingest/traffic/hey.Dockerfile  && \
curl -O https://raw.githubusercontent.com/GoogleCloudPlatform/opentelemetry-operator-sample/refs/heads/main/recipes/self-managed-otlp-ingest/traffic/cloudbuild-hey.yaml && \
popd
先前的指令會執行下列動作:
- 建立獨立目錄,用於建構流量模擬器應用程式。
- 下載應用程式的 Dockerfile。
- 下載 Cloud Build 設定,建構應用程式映像檔。
執行下列指令,透過 Cloud Build 建立應用程式映像檔,並推送至 Artifact Registry:
pushd traffic-simulator && \
gcloud builds submit --config <(envsubst < cloudbuild-hey.yaml) . && \
popd
將下列內容複製到
traffic-simulator目錄中名為quickstart-traffic.yaml的檔案,為模擬器建立部署設定檔:apiVersion: apps/v1 kind: Deployment metadata: name: traffic-simulator labels: app.kubernetes.io/part-of: gke-autoinstrument-guide spec: replicas: 1 selector: matchLabels: app: traffic-simulator template: metadata: labels: app: traffic-simulator spec: containers: - name: traffic-simulator image: us-east4-docker.pkg.dev/PROJECT_ID/opentelemetry-autoinstrument-registry/hey:latest args: - -c=2 - -q=1 - -z=1h - http://quickstart-app:8080/multi執行下列指令,部署流量模擬器:
pushd traffic-simulator && \
kubectl apply -f quickstart-traffic.yaml -n APPLICATION_NAMESPACE && \
popd
建立部署後,系統可能需要一段時間才能建立 Pod 並開始執行。如要檢查 Pod 的狀態,請執行下列指令:
kubectl get po -n APPLICATION_NAMESPACE -w如要停止監控 Pod 狀態,請輸入 Ctrl-C 停止指令。
查看遙測資料
流量模擬器開始將要求傳送至應用程式後,部署的 Java 應用程式就會產生遙測資料。指標和追蹤記錄可能需要幾分鐘才會開始顯示在 Google Cloud中。
OpenTelemetry 運算子插入的檢測功能會依附OpenTelemetry Java 代理程式。OpenTelemetry Java 代理程式內建許多熱門Java 程式庫和架構的檢測功能,可發出指標。
注入的檢測也會自動擷取對範例應用程式公開的任何端點所發出的呼叫追蹤記錄。流量模擬器會以固定速率,持續向 Java 應用程式公開的
/multi端點傳送要求。/multi端點會將要求傳送至/single端點,以生成最終回應。這些互動最終會成為追蹤記錄,可使用「追蹤記錄探索工具」查看。
查看指標
您可以在 Cloud Monitoring 的 Metrics Explorer 中查看自動插碼指標。本節包含以 PromQL 編寫的查詢範例。
前往 Google Cloud 控制台的 leaderboard「指標探索器」頁面:
如果您是使用搜尋列尋找這個頁面,請選取子標題為「Monitoring」的結果。
您可以查看範例應用程式的下列指標:
JVM 執行階段指標:OpenTelemetry Java 代理程式會發出基礎 JVM 的指標。這些指標會揭露 JVM 記憶體、垃圾回收、類別、執行緒和其他相關概念的資訊。如需支援的 JVM 指標完整清單,請參閱「JVM Runtime Metrics Semantic Conventions」(JVM 執行階段指標語意慣例) 頁面。
JVM 記憶體用量: 將下列 PromQL 查詢貼到 Metrics Explorer:
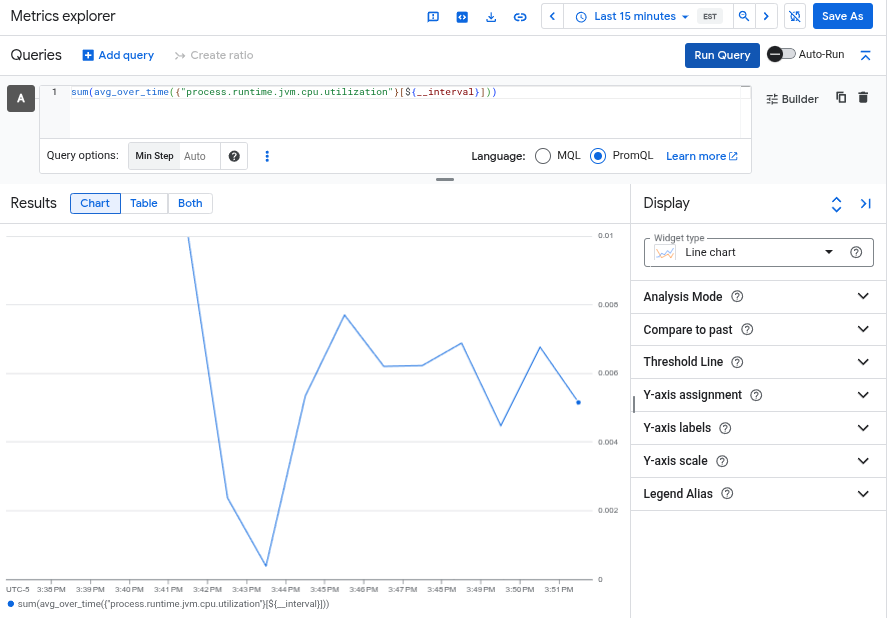
sum(avg_over_time({"process.runtime.jvm.memory.usage"}[${__interval}]))JVM CPU 使用率: 將下列 PromQL 查詢貼到 Metrics Explorer:
sum(avg_over_time({"process.runtime.jvm.cpu.utilization"}[${__interval}]))下圖顯示 JVM CPU 使用率指標:
Spring Boot 指標:範例應用程式使用 Spring Boot 架構,OpenTelemetry 也支援 Java 的零程式碼檢測功能。
HTTP 用戶端平均時間: 將下列 PromQL 查詢貼到 Metrics Explorer:
sum(rate({"http.client.duration_sum"}[${__interval}])) by (cluster, job) / sum(rate({"http.client.duration_count"}[${__interval}])) by (cluster, job)HTTP 伺服器平均時間: 將下列 PromQL 查詢貼到 Metrics Explorer:
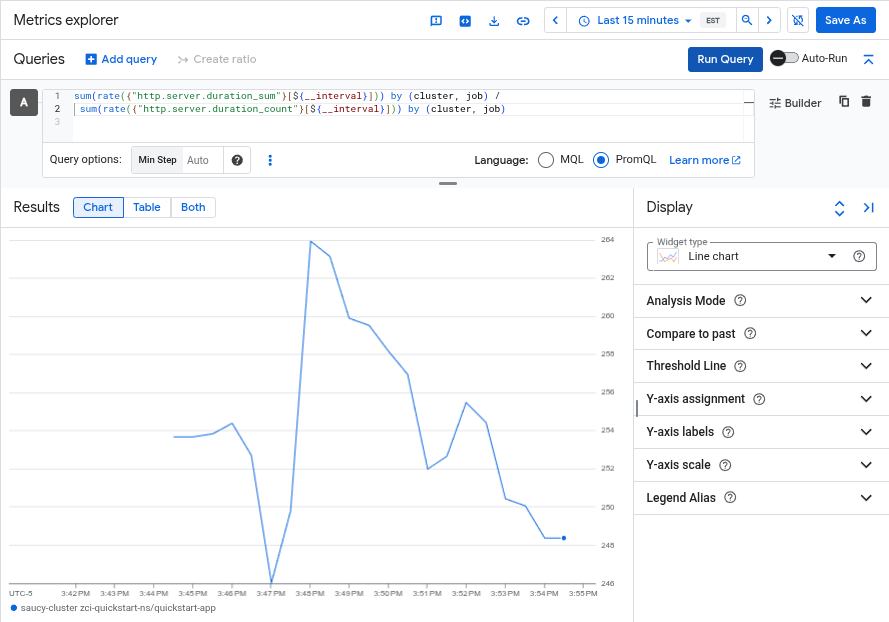
sum(rate({"http.server.duration_sum"}[${__interval}])) by (cluster, job) / sum(rate({"http.server.duration_count"}[${__interval}])) by (cluster, job)下圖顯示 Spring Boot 平均 HTTP 伺服器時間長度指標:
如要進一步瞭解如何使用 Metrics Explorer,請參閱「在使用 Metrics Explorer 時選取指標」。
查看追蹤記錄
您可以在 Cloud Trace 的 Trace Explorer 中查看自動檢測的追蹤記錄。您可以在「追蹤記錄探索器」中,依「服務名稱」篩選這些追蹤記錄,並將服務名稱設為 quickstart-app。
前往 Google Cloud 控制台的 ![]() 「Trace Explorer」頁面:
「Trace Explorer」頁面:
前往「Trace explorer」(Trace 探索工具)
您也可以透過搜尋列找到這個頁面。
下列螢幕截圖顯示 OpenTelemetry quickstart-app 部署作業產生的追蹤記錄:
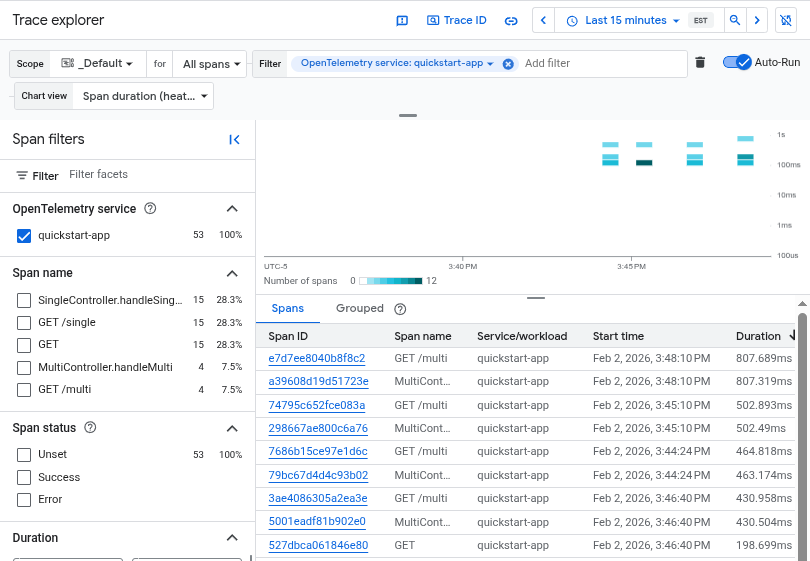
如要進一步瞭解如何使用 Trace 探索工具,請參閱「尋找及探索追蹤記錄」。
清除所用資源
如果您建立新 Google Cloud 專案,且現在不再需要該項專案,請執行下列指令刪除專案:
gcloud projects delete PROJECT_ID
如果您使用的是現有專案,可以刪除本逐步導覽建立的資源,以節省費用:
執行下列指令來刪除 GKE 叢集:
gcloud container clusters delete CLUSTER_NAME --location=us-east1執行下列指令,刪除 Artifact Registry 存放區:
gcloud artifacts repositories delete opentelemetry-autoinstrument-registry --location=us-east4