
部署 Google Cloud Managed Service for Prometheus 後,您可以查詢傳送至代管服務的資料,並在圖表和資訊主頁中顯示結果。
本文說明指標範圍 (決定可查詢的資料),以及如何使用 Cloud Monitoring 擷取及運用收集到的資料。
Managed Service for Prometheus 的所有查詢介面都已設定為使用 Cloud Monitoring API 從 Monarch 擷取資料。只要查詢 Monarch,而非查詢本機 Prometheus 伺服器的資料,就能大規模進行全域監控。
事前準備
如果您尚未部署代管服務,請設定代管收集或自行部署收集。如果您只對使用 PromQL 查詢 Cloud Monitoring 指標感興趣,可以略過這個步驟。
查詢和指標範圍
無論使用哪種方法查詢資料,可查詢的資料都取決於 Cloud Monitoring 建構的指標範圍。
Monitoring 指標範圍是僅限讀取時間的建構元件,可讓您查詢屬於多個 Google Cloud 專案的指標資料。每個指標範圍都會由指定 Google Cloud 專案代管,該專案稱為「範圍專案」。
根據預設,專案是自身指標範圍的限定範圍專案,而指標範圍包含該專案的指標和設定。限定範圍專案的指標範圍可包含多個受監控的專案,且限定範圍專案可查看指標範圍內所有受監控專案的指標和設定。受監控專案也可以屬於多個指標範圍。
在限定範圍專案中查詢指標時,如果該專案代管多專案指標範圍,您就能從多項專案擷取資料。如果指標範圍包含所有專案,系統就會評估全域查詢和規則。
如要進一步瞭解專案範圍和指標範圍,請參閱「指標範圍」。如要瞭解如何設定多專案指標範圍,請參閱「查看多項專案的指標」。
Cloud Monitoring 中的 Managed Service for Prometheus 資料
Managed Service for Prometheus 與 Cloud Monitoring 共用資料儲存後端 Monarch。您可以搭配使用 Cloud Monitoring 提供的所有工具,以及 Managed Service for Prometheus 收集的資料。舉例來說,您可以按照「Google Cloud Monitoring 控制台」一文的說明,使用 Metrics Explorer,並根據這些指標設定快訊。您也可以將 Grafana 資訊主頁匯入 Cloud Monitoring。
在 Cloud Monitoring 中處理指標資料 (包括 Managed Service for Prometheus 的資料) 時,您可以使用 Cloud Monitoring 提供的查詢工具:
在 Cloud Monitoring 中使用 PromQL 查詢
如要查詢 Prometheus 資料,最簡單的方法是使用 Google Cloud 控制台的 Cloud Monitoring Metrics Explorer 頁面。如要確認 Prometheus 資料是否正確收集,請執行下列操作:
-
前往 Google Cloud 控制台的 leaderboard「指標探索器」頁面:
如果您是使用搜尋列尋找這個頁面,請選取子標題為「Monitoring」的結果。
在查詢建立工具窗格的工具列中,選取名稱為 code「PromQL」PromQL的按鈕。
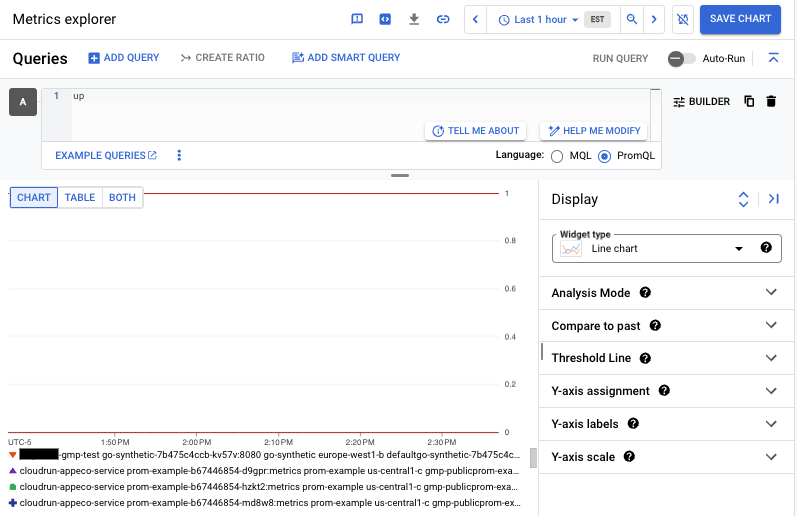
在編輯器中輸入以下查詢,然後點選「執行查詢」:
up
如果系統正在擷取資料,您會看到類似下方的圖表:
如要瞭解如何使用 PromQL 查詢 Cloud Monitoring 系統指標,請參閱「Cloud Monitoring 指標的 PromQL」。
如要進一步瞭解如何在 Metrics Explorer 和 Cloud Monitoring 圖表中,使用 PromQL,請參閱「在 Cloud Monitoring 中使用 PromQL」。
Cloud Monitoring 中的其他查詢選項
如要以 Cloud Monitoring 時間序列的形式查看 Prometheus 資料,並建立圖表和資訊主頁,您也可以使用選單導向的介面或 MQL。以下是 Metrics Explorer 中的簡單查詢:
-
前往 Google Cloud 控制台的 leaderboard「指標探索器」頁面:
如果您是使用搜尋列尋找這個頁面,請選取子標題為「Monitoring」的結果。
指定要在圖表中顯示的資料。除了使用先前所述的 PromQL 按鈕外,您也可以使用選單導向介面。如要建構查詢,請按照下列步驟操作:
在查詢建立工具窗格中,按一下「選取指標」。
在搜尋欄位中輸入「up/」來篩選清單,然後依序選取「Prometheus Target」、「Up」和「Prometheus/up/gauge」。
按一下「套用」。
這項查詢產生的圖表會顯示與 PromQL 範例中圖表相同的資料。
使用選單導向介面建立的查詢可以轉換為 PromQL,方法是選取「PromQL」PromQL按鈕。這項翻譯功能可能無法正確轉換直方圖函式或其他不常見的運算子。
prometheus_target 資源
在 Cloud Monitoring 中,時間序列資料會根據受控資源類型寫入。如果是 Prometheus 指標,受監控的資源類型為 prometheus_target。如果 Prometheus 指標的監控查詢不是以 PromQL 編寫,就必須指定這個資源類型。
prometheus_target 資源具有下列標籤,可用於篩選及操控查詢資料:
project_id:與這個資源相關聯的 Google Cloud 專案 ID。location:資料儲存的實際位置 (Google Cloud 區域)。這個值通常是 GKE 叢集或 Compute Engine 執行個體的區域。如果資料是從 AWS 或內部部署作業收集而來,則值可能是最接近的 Google Cloud 區域。cluster:GKE 叢集或相關概念,可能為空白。namespace:GKE 命名空間或相關概念,可能為空白。job:Prometheus 目標的工作標籤 (如已知);規則評估結果可能為空白。instance:Prometheus 目標的執行個體標籤 (如有),規則評估結果可能為空白。
這些標籤的值是在收集期間設定。