

With modern visualization themes and dashboard styles, you can create clean, professional charts and streamlined dashboards with improved data density. By applying updated typography, intentional color hierarchy, and adaptive layouts, modern styling enhances data legibility and provides a cohesive viewing and editing experience.
To use these styling options, an admin must enable the Modern User Interface preview feature on the Preview page of the Admin panel. This preview feature is supported on all Looker deployment types, including Looker (original) and Looker (Google Cloud core).
When enabled, the Modern User Interface preview feature introduces the following settings and updates:
- Modern visualizations: The Visualization Theme setting for Looker charts lets users pick a new Modern visualization theme for Looker charts.
- Modern dashboards: The Dashboard style setting for dashboards lets users pick a new Modern style for Looker dashboards.
Modern visualizations
When the Modern User Interface preview feature is enabled, you can use the Visualization Theme setting to select Modern or Classic visualization themes for your Looker charts. Choosing the Modern visualization theme helps you create clean, readable, and professional charts with a clear and modern look and feel.
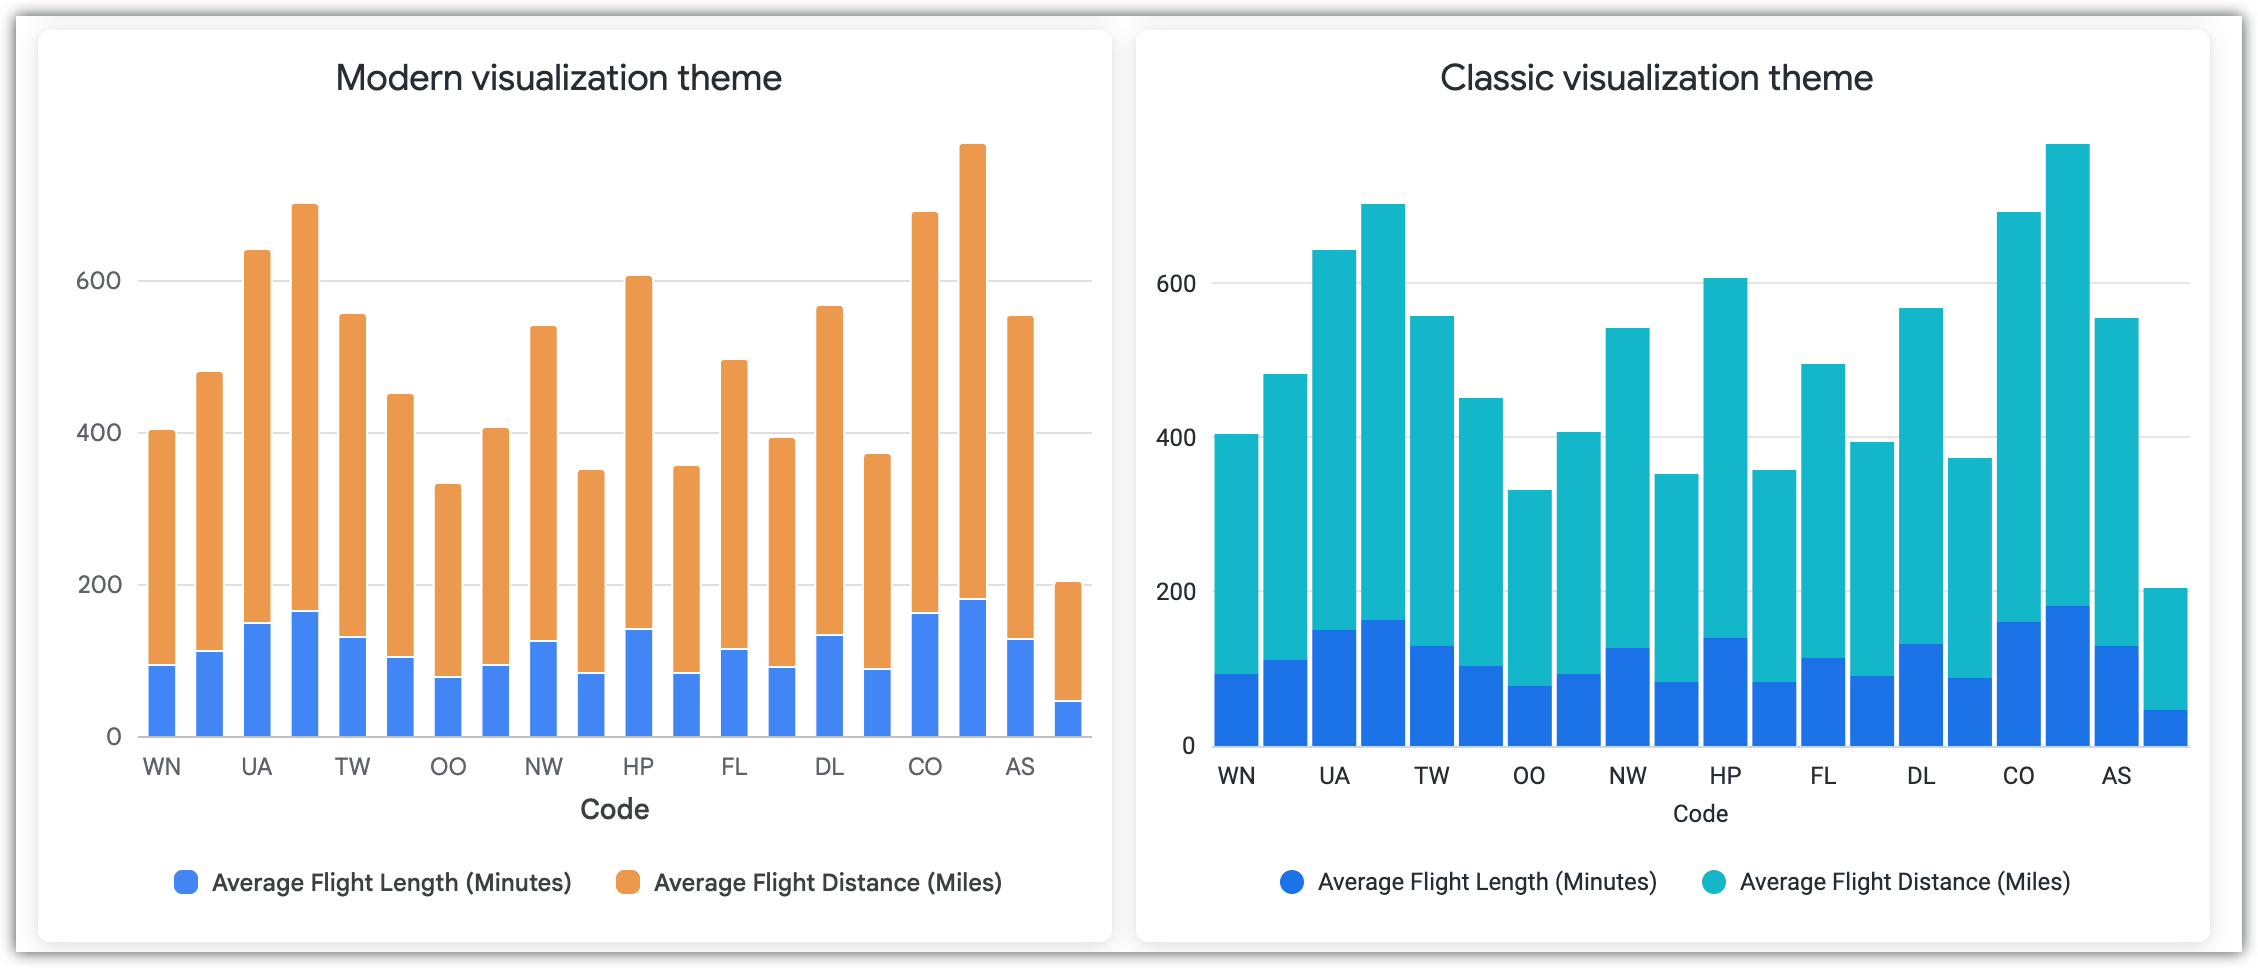
The following image shows a comparison between the Modern and the Classic visualization themes.
Supported chart types
During the preview launch, the Modern visualization theme supports Looker's most popular built-in chart types:
- Cartesian charts: column, bar, line, and area charts
- Pie charts: pie and donut multiples charts
- Single value charts
- Table charts
All other chart types (such as boxplot, funnel, maps, scatter, table (legacy), timeline, and waterfall) aren't supported by the Modern visualization theme. If a Look or an Explore uses an unsupported chart type, the Visualization Theme setting won't appear in its edit menu.
How Modern and Classic visualization themes differ
The Modern visualization theme is designed to optimize chart layout, typography, colors, and interactive behaviors.
The following table describes how visualizations that use the Modern theme differ from those that use the Classic style.
| Visual element | Classic visualization theme | Modern visualization theme |
|---|---|---|
| Typography |
|
|
| Default colors |
|
|
| Cartesian charts (bar, column, line, area) |
|
|
| Pie and donut charts |
|
|
| Single value charts |
|
|
| Interactions and tooltips |
|
|
The Modern color collection
If the Modern User Interface preview feature is enabled, you will see the Modern color collection as an option for the Default Visualization Colors setting. Even if you don't select the Modern color collection for this setting, if you select the Modern visualization theme for a visualization, it will use the Modern color collection by default.
The Modern color collection was developed with the following goals:
- Ensure sufficient contrast between chart elements and backgrounds for visibility and accessibility.
- Use a color sequence that is differentiable (has distinct visual contrast) for individuals with color vision deficiencies.
- Prevent distraction and maintain focus on data by reducing the intensity of the color palette.
Enabling the Modern visualization theme (for admins)
To make the Modern visualization theme available on an instance, a Looker admin must enable the Modern User Interface preview feature on the Preview page of the Admin panel. The preview feature is disabled by default.
When the Modern User Interface feature is enabled, the Modern theme becomes the default theme for new query charts. However, charts that are created before the Modern User Interface feature is enabled don't automatically adopt the Modern theme.
If you want to set the Modern theme's color collection as the default palette for all new visualizations in Looker, including visualizations that don't support visualization themes, you can select it in the Default Visualization Colors setting on the Settings page of the Admin panel once the Modern User Interface preview feature is enabled. This setting enables only the color palettes, not the other features of the Modern theme. If you enable the Modern User Interface feature and want new visualizations of all chart types to use the same default visualization colors, select Modern for this setting.
Choosing themes for individual charts
To set a visualization theme for a chart, you must have the proper permissions and use the chart settings.
User permissions
To use and save visualizations with the Modern visualization theme, you must have the following Looker permissions:
- To configure Modern styles in Explores: Users must have the
explorepermission for the relevant models. - To save Modern visualization styles to individual Looks: Users must have the
explore,save_content, andsave_lookspermissions. Users also must have the Manage Access, Edit access level for any Looks that they want to edit.
Chart settings
When the Modern User Interface feature is enabled, you can change the visualization theme by using the following steps:
Table charts
For table charts, you can choose which visualization theme you'd like applied by making a selection in the Table Theme field.
- If you are viewing a Look, click the Edit button to edit the Look.
- In a Look or an Explore, in the Visualization tab, click Edit to open the edit menu.
- Navigate to the Plot tab of the edit menu.
- In the Table Theme drop-down field, select Modern or one of the other table themes. The visualization updates to show the chosen theme.
- Once you have selected your preferred theme, you can save the visualization as a Look or add it to a dashboard. Your theme selection is saved as part of the visualization's configuration.
Other charts
For column, bar, line, area, pie, donut multiples, or single value charts, you can choose which visualization theme you'd like applied by making a selection in the Visualization theme field.
- If you are viewing a Look, click the Edit button to edit the Look.
- In a Look or an Explore, in the Visualization tab, click Edit to open the edit menu.
- Navigate to the Plot tab of the edit menu.
- In the Visualization theme drop-down field, select Modern or Classic. The visualization updates to show the chosen theme.
- Once you have selected your preferred theme, you can save the visualization as a Look or add it to a dashboard. Your theme selection is saved as part of the visualization's configuration.
Dashboard tiles
- Place the dashboard in edit mode.
- Open the Edit Tile window for the tile.
- in the Visualization tab, click Edit to open the edit menu.
- Navigate to the Plot tab of the edit menu.
- In the Visualization Theme drop-down field, select Modern or Classic. The visualization updates to show the chosen theme.
- Once you have selected your preferred theme, you can save the change by clicking Save on the Edit Tile window and then clicking Save on the dashboard.
LookML dashboard elements
The Modern and Classic themes can be used in LookML dashboard elements for the supported chart types.
To use themes, use the modern2026 parameter, and set it to true for the Modern theme or to false for the Classic theme.
To apply the Modern color collection to a dashboard element, use the collection_id parameter and set it to looker_2026.
Custom style retention
When you apply the Modern visualization theme to an existing Explore or Look, Looker updates your visualization's underlying styles without discarding your custom configurations. Any custom formatting choices that you have explicitly saved take priority over the new theme defaults.
- Custom styles (preserved): If you have manually customized specific formatting properties (such as entering custom color codes, adjusting axis bounds to specific numbers, or manually defining chart series names), Looker preserves these overrides exactly as they are. Your custom choices won't be overwritten by the Modern theme.
- Untouched properties (updated): Any style settings that you didn't modify (properties left at their default states) are automatically upgraded to the Modern theme's styling, such as the new fonts, muted gridlines, and rounded corners.
For example, if you have a Classic theme column chart where you customized the column colors to match your company's brand, switching to the Modern theme preserves those specific brand colors. However, the chart's fonts, gridline styling, and column corners will still automatically upgrade to the Modern style.
Resetting to defaults
If you want to completely apply the Modern theme to a visualization that contains custom styles, you can reset customized properties back to their default states:
- From a Look or dashboard, enter edit mode for the visualization.
- In the Edit menu, locate the properties that you want to reset (such as custom color selections or font sizes).
- Clear the custom values or select the default settings to remove the override. The properties will immediately inherit the Modern theme's defaults.
Known limitations
While the Modern visualization theme is in preview, the following limitations are present:
- The Modern theme is available only for the chart types that are listed in the Supported chart types section. All other built-in Looker visualizations, including maps, will render using the Classic theme.
- The Modern visualization theme applies only to built-in Looker visualizations. It does not affect custom visualizations that are developed through the Looker Extension Framework or those installed from the Looker Marketplace.
- Visualization themes can't be edited programmatically through the Looker API or the Embed SDK.
Modern dashboards
When the Modern User Interface preview feature is enabled, new dashboards default to using the Modern dashboard style. Using the Modern dashboard style creates dashboards with a modern, streamlined appearance and an emphasis on data density. Alternatively, you can use Looker's pre-existing Classic dashboard style. Use the Dashboard style setting to select Modern or Classic dashboard styles for your dashboards.
Using the Modern dashboard style doesn't automatically update the charts in the dashboard to the Modern visualization theme. To use the Modern visualization theme in dashboard tiles, you must enter edit mode for the dashboard and edit each tile that uses a supported chart type to use the Modern visualization theme.
The following image shows an example of a dashboard that uses the Modern dashboard style with tiles that use the Modern visualization theme.
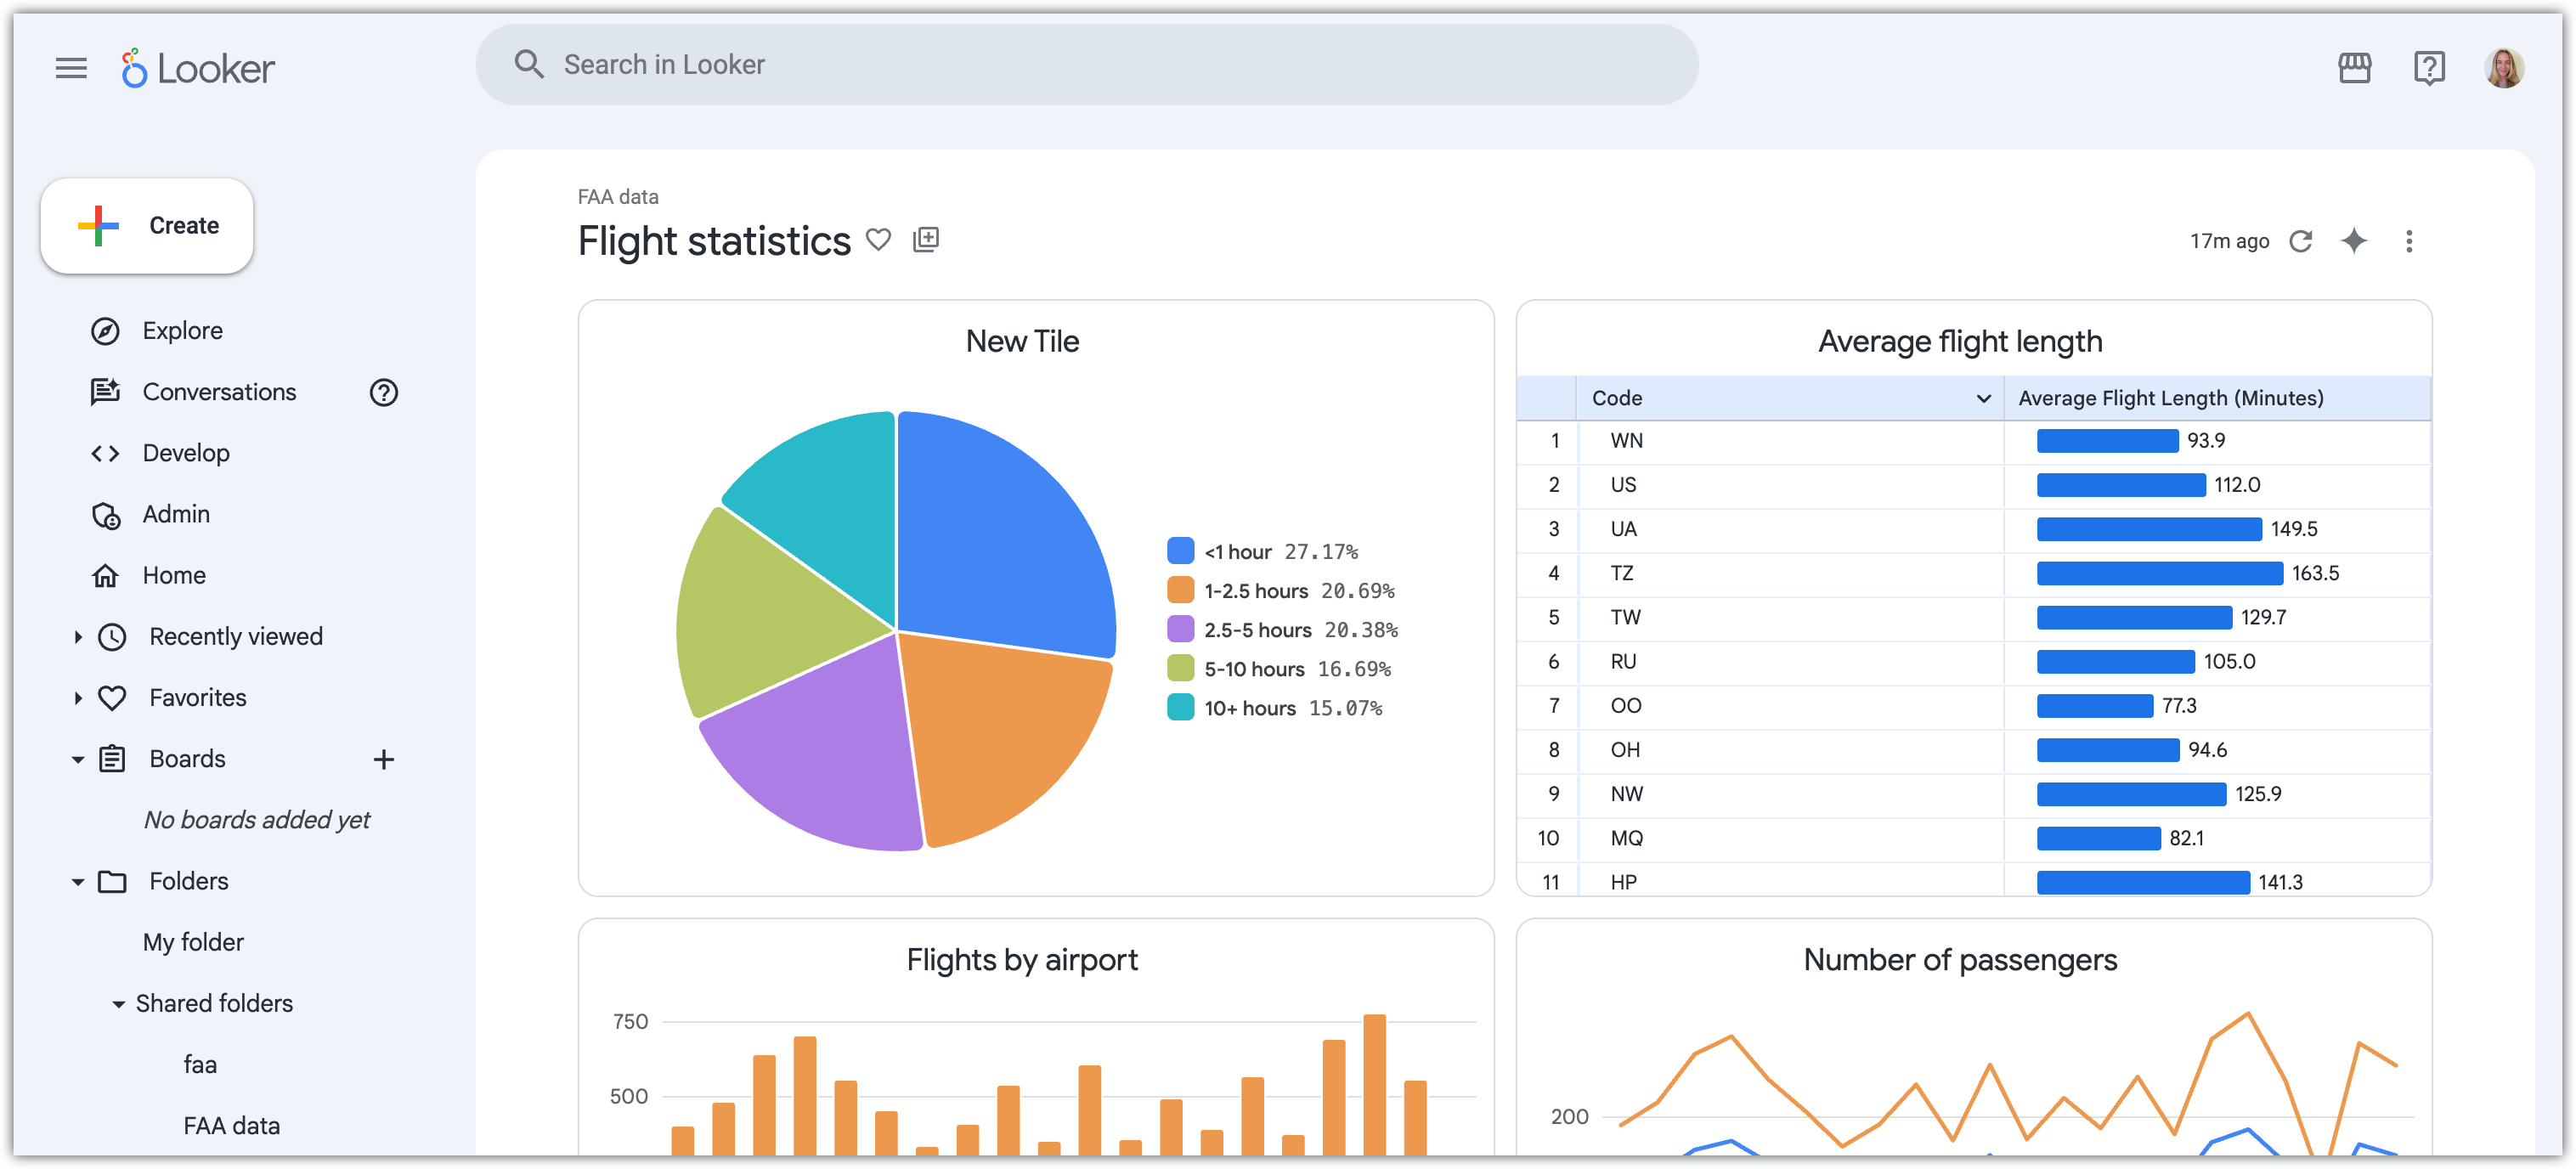
The Classic dashboard style is shown in the Viewing dashboards documentation.
How Modern and Classic dashboard styles differ
The Modern dashboard style is designed to improve data density and provide a more precise, cohesive editing experience.
The following table describes how dashboards that use the Modern style differ from the Classic style.
| Element | Classic dashboard style | Modern dashboard style |
|---|---|---|
| Layout and density |
|
|
| Look and feel |
|
|
Enabling the Modern dashboard style (for admins)
To make the Modern dashboard style available on an instance, a Looker admin must enable the Modern User Interface preview feature on the Preview page of the Admin panel.
Dashboards that are created before the Modern User Interface feature is enabled retain the Classic dashboard style, but they can be updated to the Modern style by using the Dashboard style setting. Dashboards that are created after the Modern User Interface feature is enabled default to the Modern dashboard style.
Setting a style for individual dashboards
To set a dashboard style, you must have the proper permissions and use the dashboard Settings menu.
User permissions
To use and save dashboards with the Modern style, users must have the save_dashboards Looker permission. Users also must have the Manage Access, Edit access level for any dashboards that they want to edit.
The Dashboard style setting
When the Modern User Interface feature is enabled, the Modern dashboard style is the default for new dashboards. You can set the dashboard style for new or pre-existing dashboards by using the following steps:
User-defined dashboard
- Place the dashboard in edit mode.
- Open the dashboard's Settings menu.
- In the General tab of the Settings menu, use the Dashboard style setting to select the Modern or the Classic dashboard style from the drop-down options. The dashboard updates to show the selected style.
- Click Save in the Settings menu.
- Click Save on the dashboard to apply the selected style.
LookML dashboard
To use the Modern dashboard style, set the style dashboard parameter to modern. To use the Classic dashboard style, set the style dashboard parameter to classic.
Embedded dashboards
For embedded dashboards that use embedded themes, some Modern styling will look different than styling in non-embedded dashboards. We recommend using the Classic dashboard style for embedded dashboards that use embedded themes.
What's next:
- Creating visualizations and graphs: Learn the basics of creating visualizations in Looker.
- Color collections: Explore the different color collections available in Looker, including the new Modern collection.