
While developing your agent application, you can test interactions with your agent using the Preview agent simulator.
The simulator is found in the bottom left of the page. You can type a message to the agent, followed by pressing Enter, and the agent will respond. Alternatively, you can use the microphone button to send audio messages.
Options
The simulator has multiple options accessible from the panel title bar:
- Start new conversation: Clears any conversation data displayed in the preview window.
- Conversation history: Displays prior conversation data. You must have data logging enabled to see conversation history (available in Settings -> Logging).
- Hide/Show trace: Shows or hides debug trace information. This option is set to Show by default.
- Save as golden: Use the conversation as an evaluation.
Injecting data
You can click the plus button in the message input area to inject certain types of data:
- Upload files
- Variables
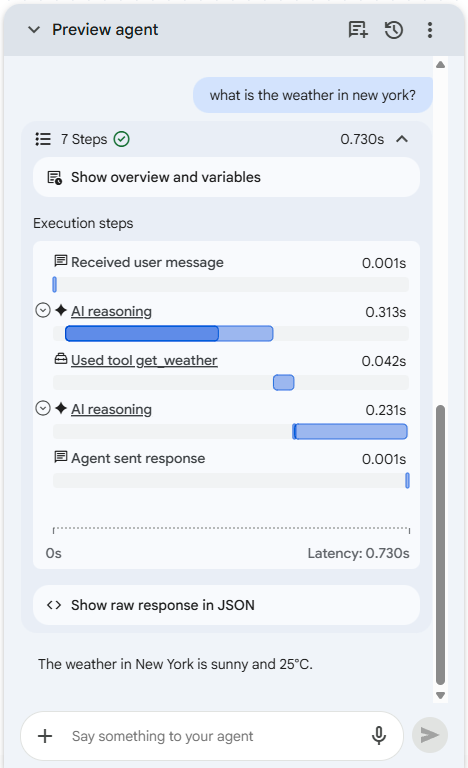
Tracing information
For each conversational turn with your agent, you can view tracing information which includes:
- steps performed
- latency for steps
- tool execution with input and output
- error information
- raw JSON responses
You can click the expansion buttons and links for tracing items to get more details about each tracing item. You can use this information to help understand the steps the agent application performs for each conversational turn and to help debug issues.
CX Insights integration
When looking at the conversation history, you can click Go to Insights above the history to open your conversation history filtered for this agent application in CX Insights.