
BigQuery Colab Enterprise 노트북에서 SQL 셀 또는 코드 셀을 사용하여 쿼리 결과를 탐색할 수 있습니다.
이 튜토리얼에서는 BigQuery 공개 데이터 세트에서 데이터를 쿼리하고 노트북에서 쿼리 결과를 탐색합니다.
목표
- BigQuery에서 쿼리를 만들고 실행합니다.
- SQL 셀 및 코드 셀을 사용하여 노트북에서 쿼리 결과를 탐색합니다.
비용
이 튜토리얼에서는 Google Cloud 공개 데이터 세트 프로그램을 통해 제공되는 데이터 세트를 사용합니다. 이러한 데이터 세트의 스토리지 비용은 Google에서 부담하며 데이터에 대한 공개 액세스를 제공합니다. 개발자에게는 데이터에서 수행하는 쿼리 요금이 청구됩니다. 자세한 내용은 BigQuery 가격 책정을 참조하세요.
시작하기 전에
-
콘솔의 프로젝트 선택기 페이지에서 프로젝트를 선택하거나 만듭니다. Google Cloud Google Cloud
프로젝트를 선택하거나 만드는 데 필요한 역할
- 프로젝트 선택: 프로젝트를 선택하는 데 특정 IAM 역할이 필요하지 않습니다. 역할이 부여된 프로젝트를 선택할 수 있습니다.
-
프로젝트 만들기: 프로젝트를 만들려면
resourcemanager.projects.create권한이 포함된 프로젝트 생성자 역할 (roles/resourcemanager.projectCreator)이 필요합니다. 역할 부여 방법 알아보기.
-
BigQuery API를 사용 설정합니다.
API 사용 설정에 필요한 역할
API를 사용 설정하려면
serviceusage.services.enable권한이 포함된 서비스 사용량 관리자 IAM 역할(roles/serviceusage.serviceUsageAdmin)이 필요합니다. 역할 부여 방법 알아보기새 프로젝트의 경우 BigQuery가 자동으로 사용 설정됩니다.
코드 애셋의 기본 리전 설정
프로젝트의 모든 새 코드 애셋은 기본 리전을 사용합니다. Google Cloud 애셋이 생성된 후에는 리전을 변경할 수 없습니다.
새 코드 애셋의 기본 리전을 설정하려면 다음 단계를 따르세요.
BigQuery 페이지로 이동합니다.
왼쪽 창에서 파일 을 클릭하여 파일 브라우저를 엽니다.
프로젝트 이름 옆에 있는 파일 패널 작업 보기 > 코드 리전 전환을 클릭합니다.
기본값으로 사용할 코드 리전을 선택합니다.
저장 을 클릭합니다.
지원되는 리전 목록은 BigQuery Studio 위치를 참조하세요.
필수 권한
노트북을 만들고 실행하려면 다음 Identity and Access Management(IAM) 역할이 필요합니다.
- BigQuery 사용자(
roles/bigquery.user) - 노트북 런타임 사용자(
roles/aiplatform.notebookRuntimeUser) - 코드 생성자(
roles/dataform.codeCreator)
노트북에서 쿼리 결과 열기
SQL 쿼리를 실행한 후 노트북을 사용하여 데이터를 탐색할 수 있습니다. 이 방법은 데이터를 사용하기 전에 BigQuery에서 데이터를 수정하려는 경우나 테이블에서 필드 하위 집합만 필요한 경우에 유용합니다.
Google Cloud 콘솔에서 BigQuery 페이지로 이동합니다.
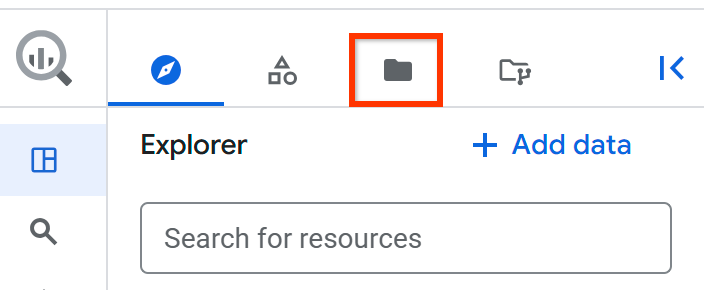
왼쪽 창에서 탐색기 를 클릭합니다.
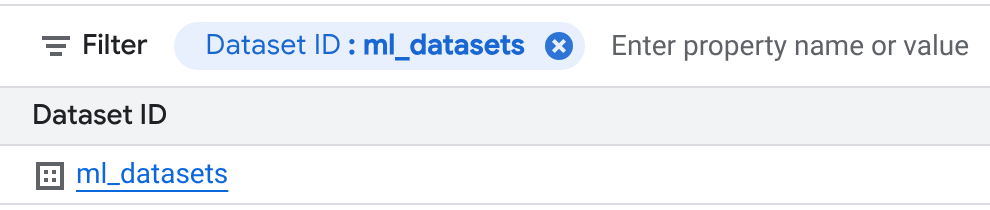
bigquery-public-data프로젝트로 이동하여 노드 전환 을 클릭하여 펼친 후 데이터 세트 를 클릭합니다. 세부정보 창에 프로젝트의 모든 데이터 세트 목록을 보여주는 새 탭이 열립니다.필터 상자에서 데이터 세트 ID를 선택하고 ml_datasets를 입력합니다.
데이터 세트 페이지에서 ml_datasets > penguins 를 클릭합니다.
쿼리 를 클릭합니다.
다음 예시와 같이 읽도록 생성된 쿼리에 필드 선택에 필요한 별표 (
*)를 추가합니다.SELECT * FROM `bigquery-public-data.ml_datasets.penguins` LIMIT 1000;
실행 을 클릭합니다.
쿼리 결과 섹션에서 다음에서 열기를 클릭한 후 노트북을 클릭합니다.
사용할 노트북 준비
런타임에 연결하고 애플리케이션 기본값을 설정하여 사용할 노트북을 준비합니다.
노트북 헤더에서 연결을 클릭하여 기본 런타임에 연결합니다.
설정 코드 블록에서 셀 실행을 클릭합니다.
데이터 탐색
코드 셀 옵션 > SQL 셀 추가를 클릭합니다.
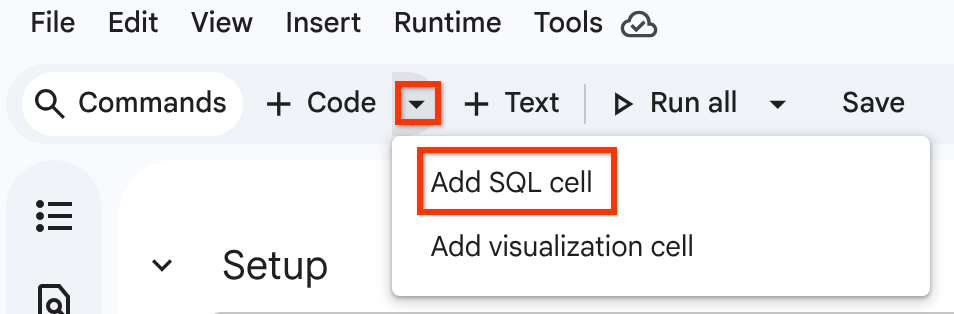
SQL 셀에 다음 쿼리를 입력합니다.
SELECT * FROM `bigquery-public-data.ml_datasets.penguins` LIMIT 1000;셀 실행 을 클릭합니다.
쿼리 결과가 BigQuery DataFrame에 표시됩니다.
또는 쿼리 편집기에서 이전에 실행한 쿼리 작업을 사용하여 쿼리 결과를 BigQuery DataFrame에 로드하려면 다음 단계를 따르세요.
BigQuery 작업에서 DataFrame으로 로드된 결과 집합 섹션으로 이동합니다.
코드 블록에서 셀 실행 을 클릭합니다.
쿼리 결과가 BigQuery DataFrame에 표시됩니다.
데이터의 설명 측정항목을 가져오려면 다음 단계를 따르세요.
describe()를 사용하여 설명 통계 표시 섹션으로 이동합니다.
코드 블록에서 셀 실행 을 클릭합니다.
결과가 BigQuery DataFrame에 표시됩니다.
선택사항: 다른 Python 함수나 패키지를 사용하여 데이터를 탐색하고 분석합니다.
다음 코드 샘플은 bigframes.pandas를 사용하여 데이터를 분석하고 bigframes.ml을 사용하여 BigQuery DataFrame의 penguins 데이터에서 선형 회귀 모델을 만드는 방법을 보여줍니다.
삭제
이 튜토리얼에서 사용된 리소스 비용이 Google Cloud 계정에 청구되지 않도록 하려면 리소스가 포함된 프로젝트를 삭제하거나 프로젝트를 유지하고 개별 리소스를 삭제하세요.
비용이 청구되지 않도록 하는 가장 쉬운 방법은 이 튜토리얼에서 만든 Google Cloud 프로젝트 를 삭제하는 것입니다.
- 콘솔에서 리소스 관리 페이지로 이동합니다. Google Cloud
- 프로젝트 목록에서 삭제할 프로젝트를 선택하고 삭제를 클릭합니다.
- 대화상자에서 프로젝트 ID를 입력한 후 종료 를 클릭하여 프로젝트를 삭제합니다.
다음 단계
- BigQuery에서 노트북 만들기 자세히 알아보기
- BigQuery DataFrames를 사용한 데이터 탐색 자세히 알아보기