
Monitor materialized views
You can monitor materialized view by using tools that include information schema and log monitoring.
To create a list of materialized views, see List materialized views.
Materialized view information schema view
To discover materialized views, query the INFORMATION_SCHEMA.TABLES
view. To retrieve the properties of a
materialized view, query the
INFORMATION_SCHEMA.TABLE_OPTIONS view.
Materialized views are not listed in the INFORMATION_SCHEMA.VIEWS view
table.
Monitor automatic refresh
This section describes how to view refresh details for materialized views.
View last refresh status
To retrieve the current status of materialized views, call the
tables.get method, or query the
INFORMATION_SCHEMA.MATERIALIZED_VIEWS view.
For example:
SELECT
  table_name, last_refresh_time, refresh_watermark, last_refresh_status
FROM
  `DATASET`.INFORMATION_SCHEMA.MATERIALIZED_VIEWS;
If the value for last_refresh_status is not NULL, the last automatic
refresh job failed. Manual refresh requests are not reflected here. Changes to
base tables can invalidate a materialized view definition, resulting in an error
during automatic refresh. For more information, see Incremental
updates. For
example, if a column that is referenced by the materialized view gets dropped
from the base table, the last_refresh_status field returns an
invalidQuery error. For more information, see Error
messages.
List automatic refresh jobs
To list materialized view automatic refresh jobs, call the jobs.list
method. To retrieve details about
the jobs, call the jobs.get
method. You can also query the
INFORMATION_SCHEMA.JOBS_BY_* views to
retrieve job details. Automatic refresh jobs contain the materialized_view_refresh
prefix within the job ID and
are started by a BigQuery administrator account.
For example:
SELECT
  job_id, total_slot_ms, total_bytes_processed,
  materialized_view_statistics.materialized_view[SAFE_OFFSET(0)].rejected_reason
  AS full_refresh_reason
FROM
  `region-us.INFORMATION_SCHEMA.JOBS_BY_PROJECT`
WHERE
  job_id LIKE '%materialized_view_refresh_%'
LIMIT 10;
To monitor the cost of refresh jobs and adjust the automatic refresh interval if
needed, view the total_bytes_processed and total_slot_ms fields.
For example, if the ingestion rate in the base tables is relatively small, it makes sense to refresh the view less often. If the underlying data changes quickly, it makes sense to refresh more often.
If the base tables ingest data at predefined points in time, such as by using a nightly extract, transform, and load (ETL) pipeline, consider taking control of the materialized view maintenance schedule as follows:
Perform a manual refresh, either as part of the ETL pipeline, or by configuring a scheduled query at specific times of the day.
Table truncation, partition truncation, partition
expiration, and UPDATE, DELETE, and MERGE data manipulation language (DML)
statements on a base table can all invalidate their materialized views. If the
materialized view is partitioned, the modified partitions are invalidated;
otherwise, the entire materialized view is invalidated. Therefore, you might want to batch your DML statements and perform the manual
refresh at the end of your query.
For more information on pricing for materialized views, see materialized views pricing.
Monitor failed materialized views refresh
You can create automation to monitor failed materialized view refreshes and send alerts using BigQuery audit logs in Cloud Logging. BigQuery creates log entries for materialized views refresh jobs, including failures. Logs Explorer in the Google Cloud console helps you retrieve, view, and analyze log entries. These entries are stored in log buckets, which are the containers that Cloud Logging uses to store your log data.
To create a metric and an alert, follow these steps:
Console
Follow these steps to create a log-based metric that sends an alert when more than three materialized view refreshes fail in a 10-minute interval.
Create a log-based metric
- To set up Logs Explorer, follow the instructions in View and analyze logs.
In Logs Explorer, confirm that the Show query setting is toggled on.
When you use the Google Cloud console, the scope of the project is the single project that is selected in the Google Cloud console project picker. To learn how to add additional projects, see Add projects to a metrics scope.
In the Query pane, paste the following query to capture all failed automatic materialized view refresh jobs in the current project's logging scope:
severity: "ERROR"
protoPayload.metadata.jobChange.after: "DONE"
protoPayload.metadata.jobChange.job.jobConfig.queryConfig.query =~ "CALL BQ.REFRESH_MATERIALIZED_VIEW\('.*'\)"
protoPayload.resourceName =~ ".*materialized_view_refresh_[\w]"
Click Run query.
Click Actions, and then select Create metric.
To create an alert based on the number of errors, for the metric type select Counter and enter a Log-based metric name and Description for your metric. The Units field can be left blank.
To define your metric filter in the Filter selection section, apply the following settings:
Use the Select project or log bucket menu to choose whether the metric counts the log entries in your Google Cloud project or only those log entries in a specific log bucket.
Create a filter that collects only the log entries that you want to count in your metric using the logging query language. You can also use regular expressions to create your metric's filters.
To see which log entries match your filter, click Preview logs.
Click Add label.
Enter a unique Label name and Description to help you identify your metric. Leave Label type as String, the default.
For Field name, enter the following string:
protoPayload.metadata.jobChange.job.jobConfig.queryConfig.query
For Regular expression, enter the following string:
CALL BQ.REFRESH_MATERIALIZED_VIEW\('(.*)'\)
Click Done and click Create metric.
For more information about counter metrics, see Configure counter metrics.
Create an alert
Complete the following steps to create an alert policy that specifies the conditions and sends an email when three materialized view refresh jobs fail within a ten-minute period. This option provides added flexibility when configuring an alerting policy. If you create a logs-based metric directly, an alert is sent each time a failed materialized view refresh error is present in the logs.
In the Google Cloud console, go to the Log-based Metrics page.
Adjacent to your user-defined logs-based metric for materialized view refreshes, click More actions > Create alert from metric.
In Select a metric, select the name of the metric you specified previously for Log-based metric name.
In Add filters, add an additional filter to the alert based on the naming convention of the materialized view defined in the Regular expression field.
This step is useful if you need to define a separate notification channel for multiple teams that use the same project but are logically divided by the materialized view naming convention. For more information about alert criteria, see Filter charted data in "Select metrics when using Metrics Explorer".
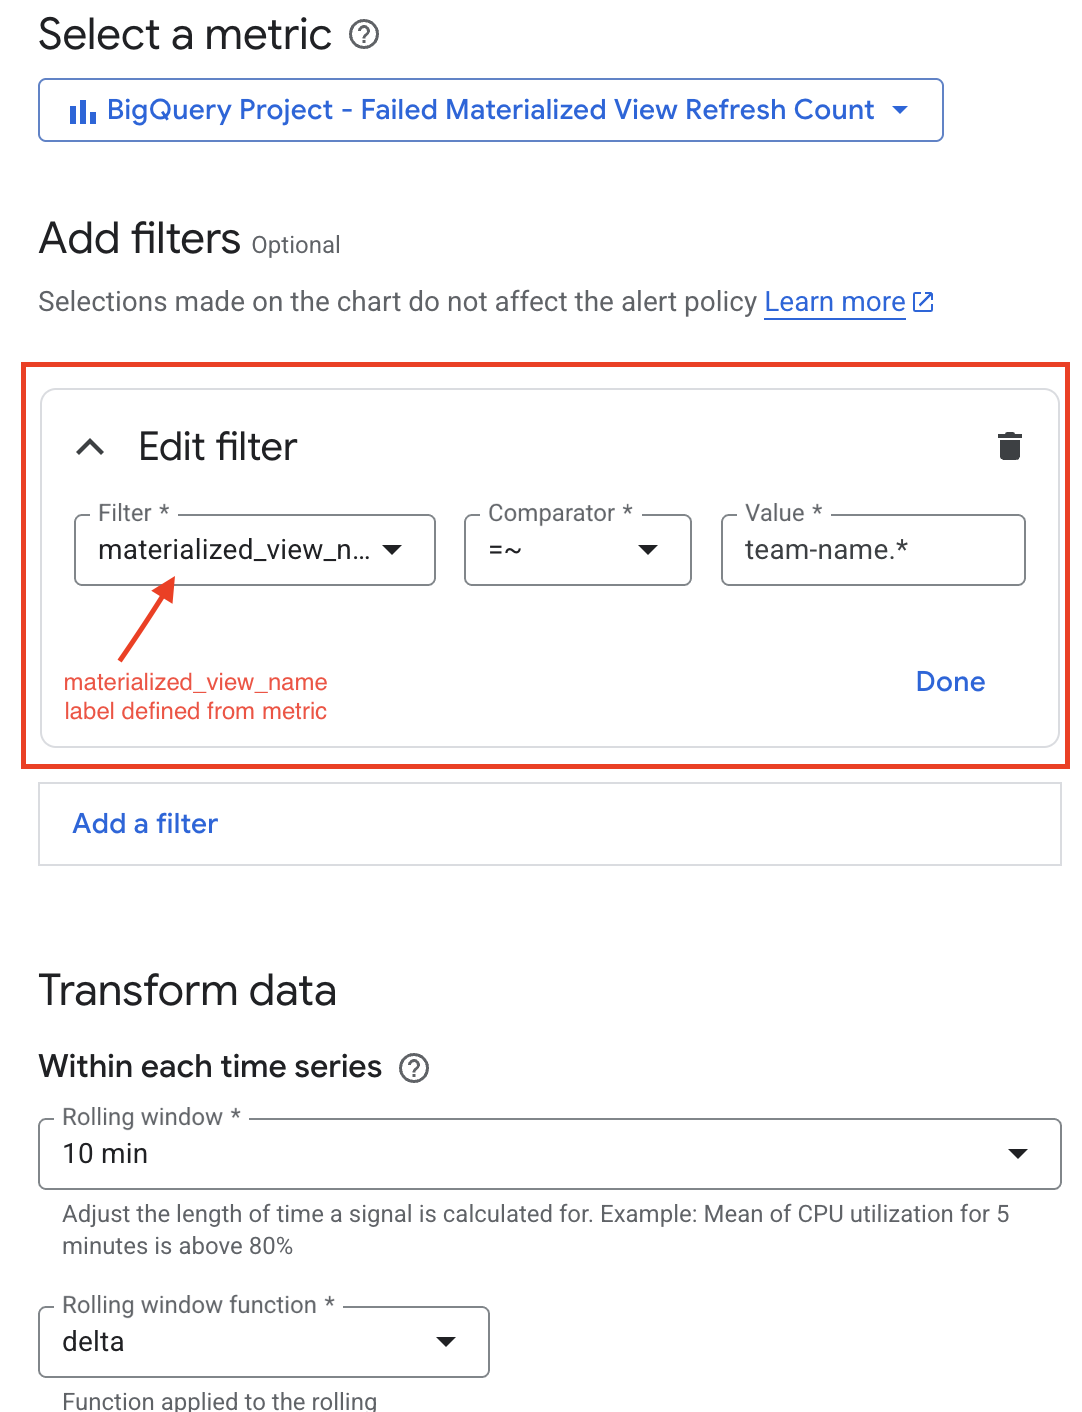
In the Rolling window setting of the Transform data section, specify a value greater than 10 minutes to ensure that multiple log entries matching your filter are counted, and click Next.
Specify Threshold value,
3for example, and optionally, configure the Alert trigger and Threshold position fields. Click Next.Choose a notification channel for alerting.
Click Create policy.
When the number of failed materialized view refreshes exceeds your threshold, your notification channel is alerted.
Terraform
You can create a custom metric, alert policy, notification channel, and logging scope by using Terraform. The following Terraform sample uses a query to monitor and log each failed materialized view refresh job.
resource "google_logging_metric" "failed_mv_refresh_metric" {
project = var.project_id
name    = var.logging_metric_name
filter = trimspace(<<EOT
  severity="ERROR"
  AND protoPayload.metadata.jobChange.after="DONE"
  AND protoPayload.metadata.jobChange.job.jobConfig.queryConfig.query=~"CALL BQ.REFRESH_MATERIALIZED_VIEW\('.*'\)"
  AND protoPayload.resourceName=~".*materialized_view_refresh_[\\w]"
  EOT
  )
metric_descriptor {
  metric_kind  = "DELTA"
  value_type   = "INT64"
  unit         = "1"
  display_name = "Failed Materialized View Refresh Count"

  labels {
    key          = "materialized_view_name"
    value_type   = "STRING"
    description  = "The name of the materialized view that failed to refresh."
  }
}
label_extractors = {
  "materialized_view_name" = "REGEXP_EXTRACT(protoPayload.metadata.jobChange.job.jobConfig.queryConfig.query, \"CALL BQ\\.REFRESH_MATERIALIZED_VIEW\\('(.*)'\\)\")"
}
}
The following sample creates an alert which can be used to send an email when the number of failed materialized view refresh jobs exceeds a threshold.
resource "google_monitoring_alert_policy" "failed_mv_refresh_alert" {
project      = var.project_id
display_name = var.alert_policy_display_name
combiner     = "OR"

conditions {
  display_name = "Condition: Materialized View Refresh Failure Count Exceeds Threshold"

  condition_threshold {
    filter = "metric.type=\"logging.googleapis.com/user/${google_logging_metric.failed_mv_refresh_metric.name}\" AND resource.type=\"bigquery_project\""

    duration = "${var.alert_duration_seconds}s"

    comparison = "COMPARISON_GT"

    threshold_value = var.alert_threshold_count

    aggregations {
      alignment_period   = "${var.alert_rolling_window_seconds}s"
      per_series_aligner = "ALIGN_DELTA"
      cross_series_reducer = "REDUCE_SUM"
      group_by_fields        = []
    }

    trigger {
      count = 1
    }
  }
}

notification_channels = [
  google_monitoring_notification_channel.email_channel.id,
]
}
For additional examples, see the following:
For more information about counter metrics, see Log-based metrics overview.
Monitor materialized view usage
To view the materialized view usage for a query job, you can call the
jobs.get method or query the
INFORMATION_SCHEMA.JOBS_BY_* view,
and view the materialized_view_statistics field, which provides details about the
use of materialized views by the query, including the following details:
- Whether the materialized view was used.
- If the materialized view was not used, the reason it was rejected.
For example:
SELECT
  job_id, materialized_view_statistics
FROM
  region-US.INFORMATION_SCHEMA.JOBS_BY_PROJECT
WHERE
  job_id = '<my-query-job-id>';
To view the usage of a materialized view over time, query the
INFORMATION_SCHEMA.JOBS_BY_* views.
For example, the following query returns a summary of recent query jobs that use the target materialized view:
SELECT
  mv.table_reference.dataset_id,
  mv.table_reference.table_id,
  MAX(job.creation_time) latest_job_time,
  COUNT(job_id) job_count
FROM
  region-US.INFORMATION_SCHEMA.JOBS_BY_PROJECT job,
  UNNEST(materialized_view_statistics.materialized_view) mv
WHERE
  job.creation_time > TIMESTAMP_SUB(CURRENT_TIMESTAMP, INTERVAL 7 DAY)
  AND mv.table_reference.dataset_id = 'MY_DATASET'
  AND mv.table_reference.table_id = 'MY_MATERIALIZED_VIEW'
  AND mv.chosen = TRUE
GROUP BY 1, 2;
Troubleshoot slow queries with materialized views
If your query uses materialized views and is running slower than expected, do the following:
- Verify that the intended materialized views are actually being used by the query. For detailed instructions, see Monitor materialized view usage.
- Check the freshness of your materialized view.
- Review the materialized view definition and the data it references and consider techniques to optimize your materialized view usage.