
Google Cloud Observability includes observability services that help you understand the behavior, health, and performance of your applications, including agentic applications. Understanding how applications behave and how components connect helps you anticipate, identify, and respond to unexpected changes quickly and effectively.
This document includes the following information:
- Definitions of terms such as observability, agent observability, and application observability and APM.
- The benefits of observability services for developing and maintaining reliable applications.
- How Google Cloud Observability helps you monitor and maintain application and infrastructure health.
- Steps to get started with observability in Google Cloud.
Observability
Observability is a comprehensive approach to collecting and analyzing telemetry data to help you understand the state of your applications, including agentic applications, and their operating environment. Telemetry data includes log data, metric data, and trace data. It can also include other data that your applications generate, such as prompts and responses. Telemetry data provides the information you need to understand the health and performance of your applications.
- Metric data
- Metric data is numeric data about health or performance that the system measures at regular intervals—for example, CPU utilization and request latency. Unexpected changes to metric data might indicate an issue that you need to investigate. Over time, you can also analyze patterns to understand usage patterns and anticipate resource needs.
- Log data
A log is a generated record of system or application activity over time. Each log is a collection of timestamped log entries, and each log entry describes a specific event.
Log data often contains rich, detailed information that helps you understand what occurred in a specific part of your application. However, log data doesn't effectively show how a change in one application component relates to activity in other components. Trace data can bridge this gap.
- Trace data
A trace represents the path of a request across the components of your distributed application. That is, each trace represents a single end-to-end operation. Because traces are composed of spans, which are records for a single function or operation, they let you follow the flow of requests and examine latency data. This information can help you identify the root cause of an issue.
For agentic applications, traces capture the actions that your agent performs. For example, a trace can capture MCP calls.
- Other data
You can gain additional insights by analyzing log data, metric data, and trace data along with other relevant information. For example, a label that indicates the severity of an incident or a customer ID in log data provides context that is useful for troubleshooting and debugging.
Agent observability
Agent observability refers to methods to understand the internal state and behavior of software agents, especially AI-powered agents built using Large Language Models (LLMs). AI agents are non-deterministic and complex. Therefore, observability is crucial to understand, debug, evaluate, and improve their performance, safety, and reliability.
Google Cloud provides support for application observability with Application Monitoring, which creates dashboards that display telemetry data, AI resource metric data, and information such as open incidents. To learn more, see the Agent and application observability in Google Cloud section of this document.
Application observability and APM
Application Performance Monitoring (APM) monitors, diagnoses, and manages the performance, availability, and user experience of software applications, including agentic applications. An APM system typically provides dashboards that display telemetry data and services that monitor telemetry data. These systems help you identify failures.
Application observability uses telemetry data to generate insights that help you understand the behavior of your applications.
Google Cloud provides support for application observability with Application Monitoring, which creates dashboards that display telemetry data, AI resource metric data, and information such as open incidents. To learn more, see the Agent and application observability in Google Cloud section of this document.
Observability services
Observability services collect, analyze, and correlate telemetry data, such as log data, metric data, and trace data. They provide the following capabilities to help you maintain application reliability:
- Proactively detect issues before they affect users.
- Troubleshoot both known and new issues.
- Debug applications during development.
- Understand the impact of changes to your applications.
- Discover new insights through data exploration.
To learn more about reliability practices, including principles and practices related to observability, read the book Site Reliability Engineering: How Google Runs Production Systems. Topics include Monitoring distributed systems, Alerting, and Troubleshooting.
Google Cloud Observability
Services in Google Cloud Observability help you collect, analyze, and correlate telemetry data, from both your applications and the underlying infrastructure. These services also provide built-in defaults to help you get started. For example, Application Monitoring creates dashboards and topology maps for your App Hub-registered applications, services, and workloads.
Automatic collection of telemetry data
Monitoring, Logging, and Trace are services that are enabled by default when you create a Google Cloud project. These services provide the core capabilities to collect, analyze, and visualize your telemetry data:
- Automatically collect telemetry data for most Google Cloud services.
- Automatically collect audit logs for most Google Cloud services.
- Provide visualization services, including dashboards and telemetry explorers, that let you view and examine your telemetry data. For example, the Trace explorer lets you view traces, spans, and metadata, including multimodal prompts and responses. For more information, see Query and view telemetry data.
- Provide SQL-based analysis services for your log data and trace data. For example, you can use BigQuery to compare URLs in your log data with a public dataset of known malicious URLs.
- Provide application monitoring and telemetry monitoring. For example, you can create alerting policies that notify you when your log data or metric data meets conditions that you specify. You can also use synthetic monitoring to test the performance of your applications.
Collect telemetry data from your instrumented applications. Instrumentation is code that you add to an application to emit telemetry data.
To instrument your application, we recommend that you use an open-source, vendor-neutral instrumentation framework, such as OpenTelemetry, instead of vendor- and product-specific APIs or client libraries. For information about these frameworks, see Instrumentation and observability and Choose an instrumentation approach.
Agent and application observability
Application Monitoring in Google Cloud provides both agent observability and application observability. This service provides dashboards and topology maps that let you understand the health and performance of your App Hub applications, services, and workloads. It also generates and displays metrics such as error rates and token usage for AI resources. To generate these metrics, Application Monitoring filters and aggregates your trace data using application-specific labels and events that follow the OpenTelemetry GenAI semantic conventions.
For agent observability, we recommend building your agents with the Agent Development Kit (ADK) framework. Because ADK relies on OpenTelemetry, the telemetry ADK generates is consistent with the OpenTelemetry GenAI semantic conventions.
To debug failures, monitor costs, or analyze agent behavior—including from Gemini Enterprise Agent Platform, Agent Gateway, and Model Armor agents—you need log, metric, and trace data:
- Logs provide information about events and errors.
- Metrics lets you monitor your latency and token usage.
- Traces provide information about execution paths, and are analyzed to derive metrics such as the number of model calls or total token usage. These derived metrics provide visibility into agent performance and behavior. For more information, see View AI resources.
- Prompt and response data lets you assess agent quality and decision-making using the Gen AI evaluation service.
The Application Monitoring dashboard for an application displays a list of the application's services and workloads, such as Gemini Enterprise apps, Gemini Enterprise Agent Platform agents and MCP servers:
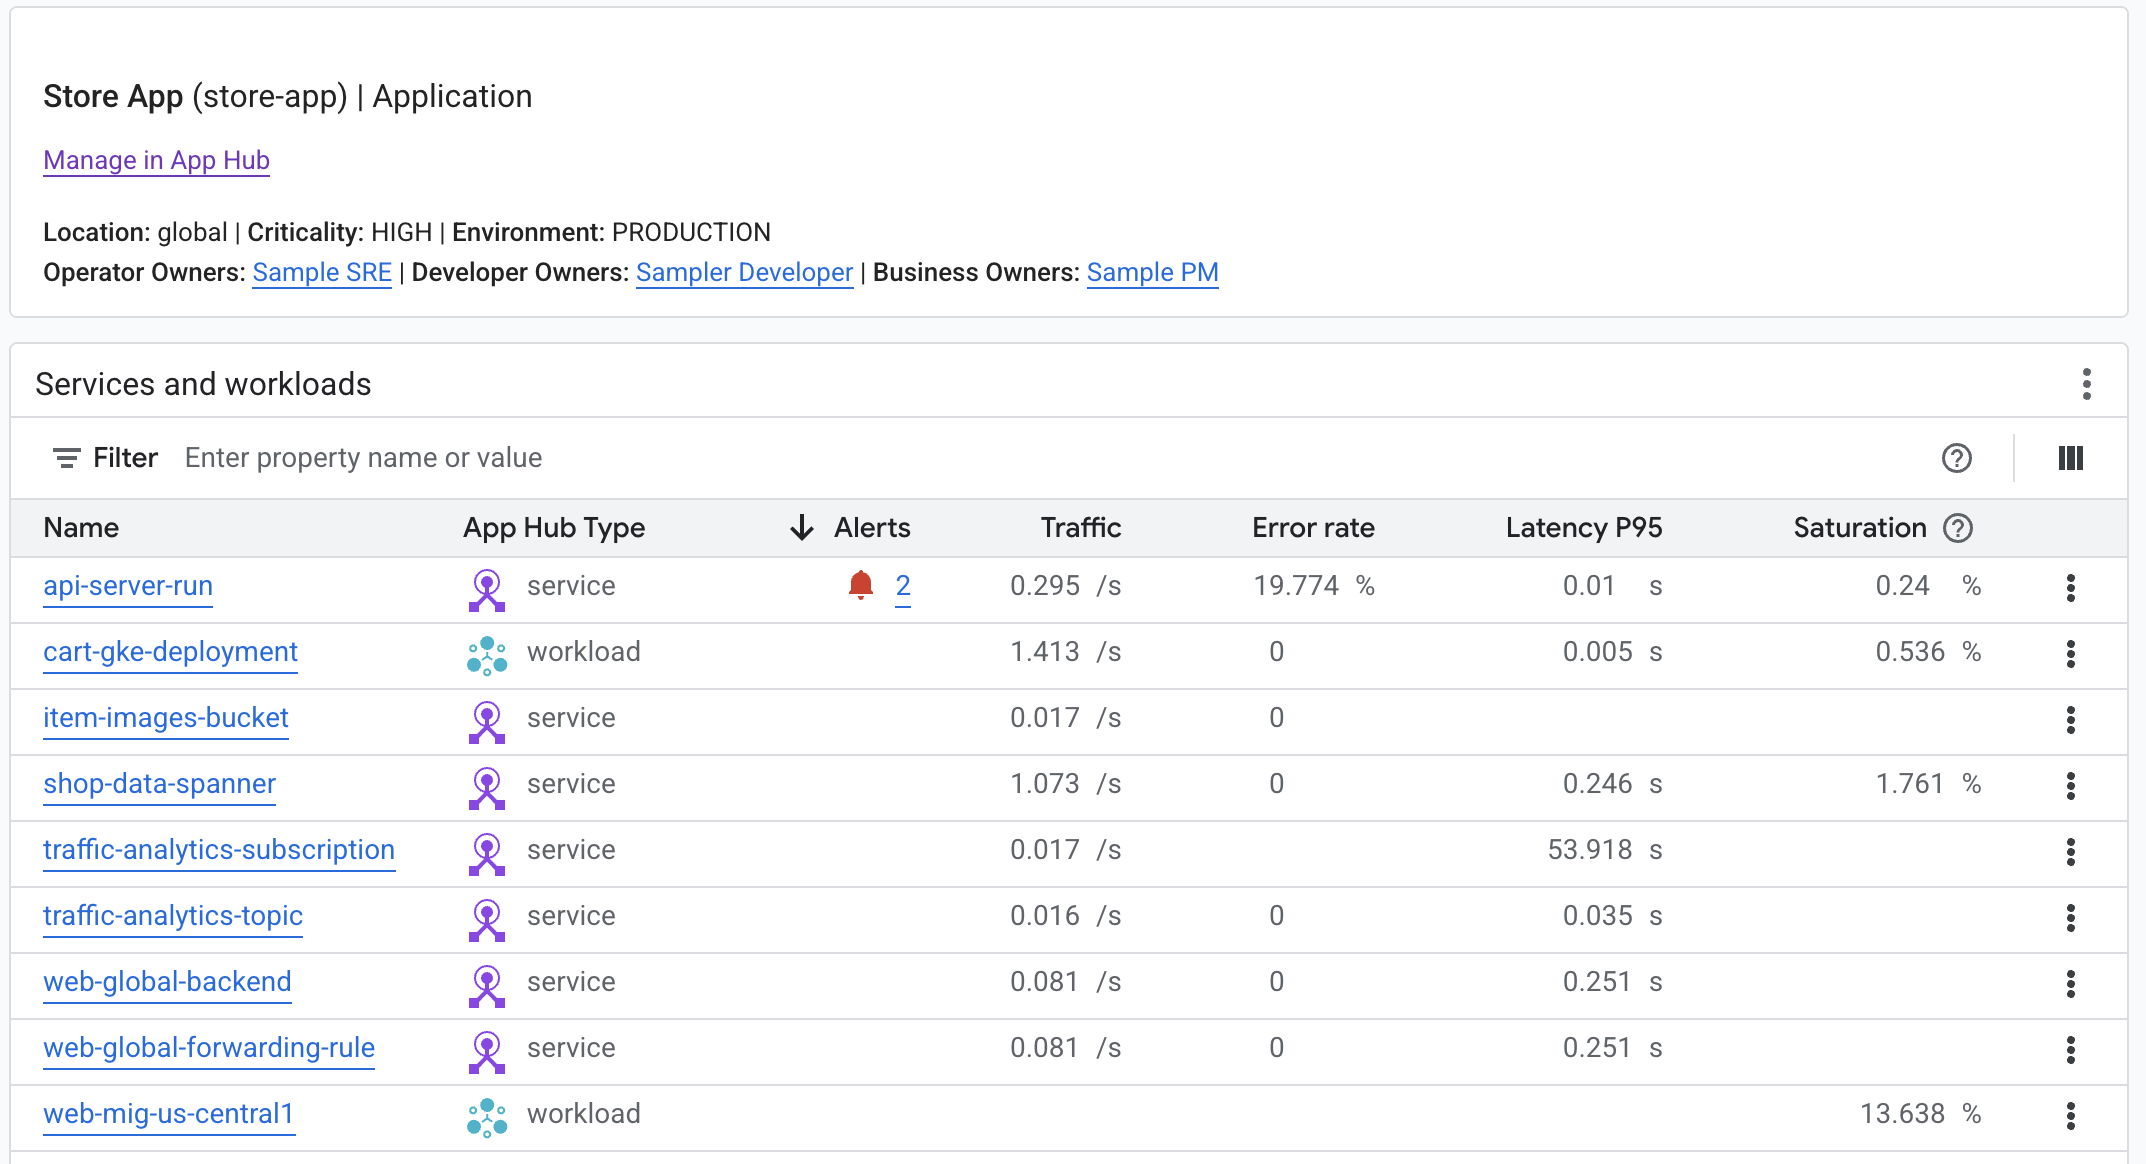
You can identify agentic services and workloads by using the infrastructure type or the App Hub functional type. The functional type column is hidden by default.
For code samples, see the following:
Support for identifying errors
Error Reporting analyzes log entries from Cloud Logging to find errors. When Error Reporting finds errors, it annotates the associated log entries and creates an error group. Explore these error groups to identify the cause and history of the error.
Profiling support
Cloud Profiler lets you analyze CPU and memory usage for your applications to identify opportunities to improve performance.
Get started
This section describes steps you can take to become familiar with observability features in Google Cloud.
Try the quickstarts
Try the quickstarts to become familiar with the available services.
View automatically collected data
Most Google Cloud services automatically generate log data and metric data. This means that you can start viewing some observability data for supported Google Cloud services without additional configuration.
- Some Google Cloud services such as Google Kubernetes Engine (GKE), Compute Engine, and Cloud SQL provide default dashboards in the Google Cloud console to view observability data in the context of the service.
- Compute Engine, GKE, and Cloud Run generate system metric data and log data by default. You configure the collection of additional data.
- Cloud Run functions and App Engine automatically generate metric data, log data, and trace data.
You can also chart collected metric data in Metrics Explorer, view log data in Logs Explorer, or view trace data in Trace. To review related data together, create custom dashboards. For example, you can create a dashboard that includes log data, performance metric data, and alerting policies for virtual machines.
Configure Compute Engine VMs to collect additional data
By default, Compute Engine VMs collect only basic system metric data and log data. However, you can install the Ops Agent to collect additional telemetry data from your Compute Engine instances and applications for troubleshooting, performance monitoring, and alerting. The Ops Agent is not an agentic application. Instead, it is a deterministic piece of software that collects telemetry data.
- Automatically collect host metric data, such as CPU, GPU, memory, and process metric data.
- Automatically collect system log data, such as syslog from Linux VMs and Windows Event Log from Windows VMs.
- You can observe your applications with the following:
- Third-party application integrations for popular software, such as Postgres, MongoDB, and Java Virtual Machine. These integrations include pre-configured dashboards and alert policies.
- Prometheus metric data
- OpenTelemetry Protocol (OTLP) metric data and trace data
- Application log data
- For a summary of the collected telemetry data, see the Ops Agent overview.
Configure GKE clusters to collect additional data
By default, GKE clusters send system log data and system metric data to Logging and Monitoring. Google Cloud Managed Service for Prometheus handles the collection of third-party metric data and user-defined metric data.
- Use observability metric data packages to understand the state of your applications and cluster resources. For example, control plane metric data is useful for creating SLOs to monitor service availability and latency.
- Monitor third-party applications such as Postgres, MongoDB, and Redis. These integrations provide pre-configured dashboards and alert policies.
Configure Cloud Run to collect custom data
If you have a Cloud Run service that writes Prometheus metric data, then you can use the Prometheus sidecar to send the metric data to Cloud Monitoring.
If your Cloud Run service writes OTLP metric data instead, then you can use an OpenTelemetry sidecar. For an example, see the tutorial for collecting OTLP metric data using the sidecar.