
Neste documento, descrevemos como implantar o coletor OpenTelemetry, configurar
o coletor para usar o exportador otlphttp e a
API Telemetry (OTLP) e executar um gerador de telemetria
para gravar métricas no Cloud Monitoring. É possível visualizar essas métricas no Cloud Monitoring.
Se você estiver usando o Google Kubernetes Engine, siga as instruções em OpenTelemetry gerenciado para GKE, em vez de implantar e configurar manualmente um coletor do OpenTelemetry que usa a API Telemetry.
Se você estiver usando um SDK para enviar métricas de um aplicativo diretamente para a API Telemetry, consulte Usar SDKs para enviar métricas de aplicativos para mais informações e exemplos.
Você também pode usar um coletor do OpenTelemetry e a API Telemetry em conjunto com a instrumentação sem código do OpenTelemetry. Para mais informações, consulte Usar a instrumentação sem código do OpenTelemetry para Java.
Antes de começar
Nesta seção, descrevemos como configurar seu ambiente para implantar e usar o coletor.
Selecione ou crie um projeto do Google Cloud
Escolha um projeto do Google Cloud para este tutorial. Se você ainda não tiver um projeto do Google Cloud , crie um:
- Faça login na sua conta do Google Cloud . Se você começou a usar o Google Cloud, crie uma conta para avaliar o desempenho de nossos produtos em situações reais. Clientes novos também recebem US$ 300 em créditos para executar, testar e implantar cargas de trabalho.
-
In the Google Cloud console, on the project selector page, select or create a Google Cloud project.
Roles required to select or create a project
- Select a project: Selecting a project doesn't require a specific IAM role—you can select any project that you've been granted a role on.
-
Create a project: To create a project, you need the Project Creator role
(
roles/resourcemanager.projectCreator), which contains theresourcemanager.projects.createpermission. Learn how to grant roles.
-
Verify that billing is enabled for your Google Cloud project.
-
In the Google Cloud console, on the project selector page, select or create a Google Cloud project.
Roles required to select or create a project
- Select a project: Selecting a project doesn't require a specific IAM role—you can select any project that you've been granted a role on.
-
Create a project: To create a project, you need the Project Creator role
(
roles/resourcemanager.projectCreator), which contains theresourcemanager.projects.createpermission. Learn how to grant roles.
-
Verify that billing is enabled for your Google Cloud project.
Instalar ferramentas de linha de comando
Este documento usa as seguintes ferramentas de linha de comando:
gcloudkubectl
As ferramentas gcloud e kubectl fazem parte da
Google Cloud CLI. Para informações sobre como instalá-los, consulte
Como gerenciar componentes da CLI do Google Cloud. Para ver os
componentes da CLI gcloud que você instalou, execute o seguinte
comando:
gcloud components list
Para configurar a CLI gcloud para uso, execute os seguintes comandos:
gcloud auth login
gcloud config set project PROJECT_ID
Ativar APIs
Ative a API Cloud Monitoring e a API Telemetry no seu
Google Cloud projeto. Preste atenção especial à API Telemetry, telemetry.googleapis.com. Este documento pode ser a primeira vez que você encontra essa API.
Ative as APIs executando os seguintes comandos:
gcloud services enable monitoring.googleapis.com
gcloud services enable telemetry.googleapis.com
Criar um cluster
Criar um cluster do GKE.
Crie um cluster do Google Kubernetes Engine chamado
otlp-testexecutando o seguinte comando:gcloud container clusters create-auto --location CLUSTER_LOCATION otlp-test --project PROJECT_IDDepois que o cluster for criado, conecte-se a ele executando o seguinte comando:
gcloud container clusters get-credentials otlp-test --region CLUSTER_LOCATION --project PROJECT_ID
Autorizar a conta de serviço do Kubernetes
Os comandos a seguir concedem os papéis necessários do Identity and Access Management (IAM) à conta de serviço do Kubernetes. Estes comandos pressupõem que você está usando a Federação de Identidade da Carga de Trabalho para GKE:
export PROJECT_NUMBER=$(gcloud projects describe PROJECT_ID --format="value(projectNumber)")

gcloud projects add-iam-policy-binding projects/PROJECT_ID \
  --role=roles/logging.logWriter \
  --member=principal://iam.googleapis.com/projects/$PROJECT_NUMBER/locations/global/workloadIdentityPools/PROJECT_ID.svc.id.goog/subject/ns/opentelemetry/sa/opentelemetry-collector \
  --condition=None

gcloud projects add-iam-policy-binding projects/PROJECT_ID \
  --role=roles/monitoring.metricWriter \
  --member=principal://iam.googleapis.com/projects/$PROJECT_NUMBER/locations/global/workloadIdentityPools/PROJECT_ID.svc.id.goog/subject/ns/opentelemetry/sa/opentelemetry-collector \
  --condition=None

gcloud projects add-iam-policy-binding projects/PROJECT_ID \
  --role=roles/telemetry.tracesWriter \
  --member=principal://iam.googleapis.com/projects/$PROJECT_NUMBER/locations/global/workloadIdentityPools/PROJECT_ID.svc.id.goog/subject/ns/opentelemetry/sa/opentelemetry-collector \
  --condition=None
Se a conta de serviço tiver um formato diferente, use o comando na documentação do Google Cloud Managed Service para Prometheus para autorizar a conta de serviço com as seguintes mudanças:
- Substitua o nome da conta de serviço
gmp-test-sapela sua conta. - Conceda os papéis mostrados no conjunto anterior de comandos, não apenas
o papel
roles/monitoring.metricWriter.
Implantar o OpenTelemetry Collector
Crie a configuração do coletor fazendo uma cópia do seguinte
arquivo YAML e colocando-o em um arquivo chamado collector.yaml. Você também pode encontrar
a seguinte configuração no GitHub no repositório
otlp-k8s-ingest.
Na sua cópia, substitua a ocorrência de ${GOOGLE_CLOUD_PROJECT} pelo ID do projeto, PROJECT_ID.
O OTLP para métricas do Prometheus só funciona quando você usa a versão 0.140.0 ou mais recente do coletor do OpenTelemetry.
Configurar o OpenTelemetry Collector implantado
Configure a implantação do coletor criando recursos do Kubernetes.
Crie o namespace
opentelemetrye a configuração do coletor no namespace executando os seguintes comandos:kubectl create namespace opentelemetry kubectl create configmap collector-config -n opentelemetry --from-file=collector.yamlConfigure o coletor com recursos do Kubernetes executando os seguintes comandos:
kubectl apply -f https://raw.githubusercontent.com/GoogleCloudPlatform/otlp-k8s-ingest/refs/heads/otlpmetric/k8s/base/2_rbac.yaml

kubectl apply -f https://raw.githubusercontent.com/GoogleCloudPlatform/otlp-k8s-ingest/refs/heads/otlpmetric/k8s/base/3_service.yaml

kubectl apply -f https://raw.githubusercontent.com/GoogleCloudPlatform/otlp-k8s-ingest/refs/heads/otlpmetric/k8s/base/4_deployment.yaml

kubectl apply -f https://raw.githubusercontent.com/GoogleCloudPlatform/otlp-k8s-ingest/refs/heads/otlpmetric/k8s/base/5_hpa.yaml
Aguarde até que os pods do coletor alcancem o estado "Em execução" e tenham 1/1 contêineres prontos. Isso leva cerca de três minutos no Autopilot, se for a primeira carga de trabalho implantada. Para verificar os pods, use o seguinte comando:
kubectl get po -n opentelemetry -wPara parar de monitorar o status do pod, pressione Ctrl+C para interromper o comando.
Você também pode verificar os registros do coletor para garantir que não haja erros óbvios:
kubectl logs -n opentelemetry deployment/opentelemetry-collector
Implantar o gerador de telemetria
É possível testar sua configuração usando a ferramenta telemetrygen de código aberto. Esse app
gera telemetria e a envia para o coletor.
Para implantar o app
telemetrygenno namespaceopentelemetry-demo, execute o seguinte comando:kubectl apply -f https://raw.githubusercontent.com/GoogleCloudPlatform/otlp-k8s-ingest/refs/heads/main/sample/app.yamlDepois de criar a implantação, pode levar um tempo para que os pods sejam criados e comecem a ser executados. Para verificar o status dos pods, execute o comando a seguir:
kubectl get po -n opentelemetry-demo -wPara parar de monitorar o status do pod, pressione Ctrl+C para interromper o comando.
Consultar uma métrica usando o Metrics Explorer
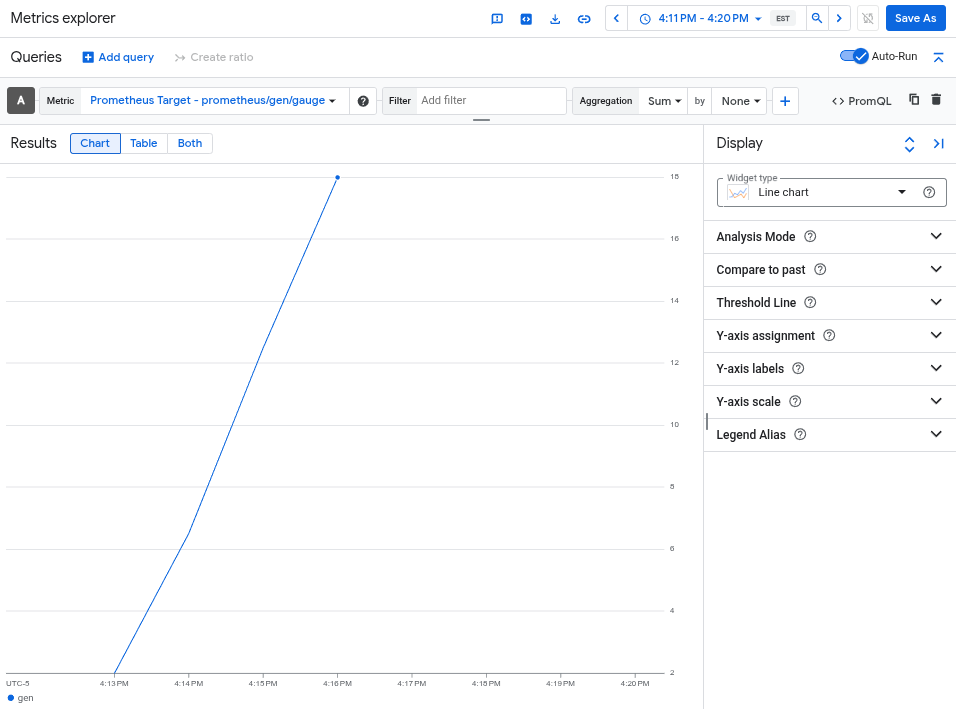
A ferramenta telemetrygen grava em uma métrica chamada gen. É possível consultar essa métrica na interface do criador de consultas e no editor de consultas PromQL do Metrics Explorer.
No console Google Cloud , acesse a página do leaderboard Metrics explorer:
Se você usar a barra de pesquisa para encontrar essa página, selecione o resultado com o subtítulo Monitoring.
- Se você usa a interface do criador de consultas do Metrics Explorer, o nome completo da métrica é
prometheus.googleapis.com/gen/gauge. - Se você usar o editor de consultas do PromQL, poderá consultar a métrica
usando o nome
gen.
A imagem a seguir mostra um gráfico da métrica gen no Metrics Explorer:
excluir o cluster
Depois de verificar a implantação consultando a métrica, é possível excluir o cluster. Para excluir o cluster, execute o seguinte comando:
gcloud container clusters delete --location CLUSTER_LOCATION otlp-test --project PROJECT_ID
Usar outros coletores baseados no OpenTelemetry
Talvez seja possível usar outros coletores baseados no OpenTelemetry para enviar métricas OTLP à API Telemetry, mas o Google Cloud não oferece suporte ao cliente para coletores não padrão baseados no OpenTelemetry.
Por exemplo, é possível enviar métricas usando o Grafana Alloy versão 1.16.0 ou mais recente autenticando com o componente otelcol.auth.google e configurando-o de maneira semelhante a um coletor OpenTelemetry padrão usando as instruções neste documento.
A seguir
- Para informações sobre como usar um coletor do OpenTelemetry e a API Telemetry com a instrumentação sem código do OpenTelemetry, consulte Usar a instrumentação sem código do OpenTelemetry para Java.
- Para informações sobre como enviar métricas de aplicativos que usam SDKs, consulte Usar SDKs para enviar métricas de aplicativos.
- Para informações sobre como migrar para o exportador
otlphttpde outro exportador, consulte Migrar para o exportador OTLP. - Para saber mais sobre a API Telemetry, consulte Visão geral da API Telemetry (OTLP).