
Questo documento descrive come eseguire il deployment di OpenTelemetry Collector, configurare
il collettore per utilizzare l'esportatore otlphttp e l'API
Telemetry (OTLP) ed eseguire un generatore di telemetria
per scrivere metriche in Cloud Monitoring. Puoi quindi visualizzare queste metriche in Cloud Monitoring.
Se utilizzi Google Kubernetes Engine, puoi seguire le istruzioni riportate in Managed OpenTelemetry per GKE, anziché eseguire manualmente il deployment e la configurazione di un OpenTelemetry Collector che utilizza l'API Telemetry.
Se utilizzi un SDK per inviare metriche da un'applicazione direttamente all'API Telemetry, consulta Utilizzare gli SDK per inviare metriche dalle applicazioni per ulteriori informazioni ed esempi.
Puoi anche utilizzare un agente di raccolta OpenTelemetry e l'API Telemetry in combinazione con l'instrumentazione zero-code di OpenTelemetry. Per saperne di più, consulta Utilizzare la strumentazione zero-code OpenTelemetry per Java.
Prima di iniziare
Questa sezione descrive come configurare l'ambiente per il deployment e l'utilizzo dell'agente di raccolta.
Seleziona o crea un Google Cloud progetto
Scegli un Google Cloud progetto per questa procedura dettagliata. Se non hai ancora un progetto Google Cloud , creane uno:
- Accedi al tuo account Google Cloud . Se non conosci Google Cloud, crea un account per valutare le prestazioni dei nostri prodotti in scenari reali. I nuovi clienti ricevono anche 300 $di crediti senza costi per l'esecuzione, il test e il deployment dei workload.
-
In the Google Cloud console, on the project selector page, select or create a Google Cloud project.
Roles required to select or create a project
- Select a project: Selecting a project doesn't require a specific IAM role—you can select any project that you've been granted a role on.
-
Create a project: To create a project, you need the Project Creator role
(
roles/resourcemanager.projectCreator), which contains theresourcemanager.projects.createpermission. Learn how to grant roles.
-
Verify that billing is enabled for your Google Cloud project.
-
In the Google Cloud console, on the project selector page, select or create a Google Cloud project.
Roles required to select or create a project
- Select a project: Selecting a project doesn't require a specific IAM role—you can select any project that you've been granted a role on.
-
Create a project: To create a project, you need the Project Creator role
(
roles/resourcemanager.projectCreator), which contains theresourcemanager.projects.createpermission. Learn how to grant roles.
-
Verify that billing is enabled for your Google Cloud project.
Installare gli strumenti a riga di comando
Questo documento utilizza i seguenti strumenti a riga di comando:
gcloudkubectl
Gli strumenti gcloud e kubectl fanno parte di
Google Cloud CLI. Per informazioni sulla loro installazione, vedi
Gestione dei componenti di Google Cloud CLI. Per visualizzare i componenti di gcloud CLI installati, esegui questo comando:
gcloud components list
Per configurare gcloud CLI per l'utilizzo, esegui i seguenti comandi:
gcloud auth login
gcloud config set project PROJECT_ID
Abilita API
Abilita l'API Cloud Monitoring e l'API Telemetry nel tuo
progettoGoogle Cloud . Presta particolare attenzione all'API Telemetry, telemetry.googleapis.com; questo documento
potrebbe essere la prima volta che incontri questa API.
Abilita le API eseguendo questi comandi:
gcloud services enable monitoring.googleapis.com
gcloud services enable telemetry.googleapis.com
Crea un cluster
Creare un cluster GKE.
Crea un cluster Google Kubernetes Engine denominato
otlp-testeseguendo il seguente comando:gcloud container clusters create-auto --location CLUSTER_LOCATION otlp-test --project PROJECT_IDDopo aver creato il cluster, connettiti eseguendo il seguente comando:
gcloud container clusters get-credentials otlp-test --region CLUSTER_LOCATION --project PROJECT_ID
Autorizza il account di servizio Kubernetes
I seguenti comandi concedono i ruoli Identity and Access Management (IAM) necessari al account di servizio Kubernetes. Questi comandi presuppongono che tu stia utilizzando Workload Identity Federation for GKE:
export PROJECT_NUMBER=$(gcloud projects describe PROJECT_ID --format="value(projectNumber)")

gcloud projects add-iam-policy-binding projects/PROJECT_ID \
  --role=roles/logging.logWriter \
  --member=principal://iam.googleapis.com/projects/$PROJECT_NUMBER/locations/global/workloadIdentityPools/PROJECT_ID.svc.id.goog/subject/ns/opentelemetry/sa/opentelemetry-collector \
  --condition=None

gcloud projects add-iam-policy-binding projects/PROJECT_ID \
  --role=roles/monitoring.metricWriter \
  --member=principal://iam.googleapis.com/projects/$PROJECT_NUMBER/locations/global/workloadIdentityPools/PROJECT_ID.svc.id.goog/subject/ns/opentelemetry/sa/opentelemetry-collector \
  --condition=None

gcloud projects add-iam-policy-binding projects/PROJECT_ID \
  --role=roles/telemetry.tracesWriter \
  --member=principal://iam.googleapis.com/projects/$PROJECT_NUMBER/locations/global/workloadIdentityPools/PROJECT_ID.svc.id.goog/subject/ns/opentelemetry/sa/opentelemetry-collector \
  --condition=None
Se il tuo account di servizio ha un formato diverso, puoi utilizzare il comando nella documentazione di Google Cloud Managed Service per Prometheus per autorizzare il service account, con le seguenti modifiche:
- Sostituisci il nome del service account
gmp-test-sacon il tuo account di servizio. - Concedi i ruoli mostrati nel set di comandi precedente, non solo
il ruolo
roles/monitoring.metricWriter.
Esegui il deployment di OpenTelemetry Collector
Crea la configurazione dell'agente di raccolta copiando il seguente
file YAML e inserendolo in un file denominato collector.yaml. Puoi anche trovare
la seguente configurazione su GitHub nel repository
otlp-k8s-ingest.
Nella tua copia, assicurati di sostituire l'occorrenza di ${GOOGLE_CLOUD_PROJECT}
con il tuo ID progetto, PROJECT_ID.
OTLP per le metriche Prometheus funziona solo se utilizzi OpenTelemetry Collector versione 0.140.0 o successive.
Configura l'agente di raccolta OpenTelemetry di cui è stato eseguito il deployment
Configura il deployment dell'agente di raccolta creando risorse Kubernetes.
Crea lo spazio dei nomi
opentelemetrye crea la configurazione dell'agente di raccolta nello spazio dei nomi eseguendo i seguenti comandi:kubectl create namespace opentelemetry kubectl create configmap collector-config -n opentelemetry --from-file=collector.yamlConfigura l'agente di raccolta con le risorse Kubernetes eseguendo i seguenti comandi:
kubectl apply -f https://raw.githubusercontent.com/GoogleCloudPlatform/otlp-k8s-ingest/refs/heads/otlpmetric/k8s/base/2_rbac.yaml

kubectl apply -f https://raw.githubusercontent.com/GoogleCloudPlatform/otlp-k8s-ingest/refs/heads/otlpmetric/k8s/base/3_service.yaml

kubectl apply -f https://raw.githubusercontent.com/GoogleCloudPlatform/otlp-k8s-ingest/refs/heads/otlpmetric/k8s/base/4_deployment.yaml

kubectl apply -f https://raw.githubusercontent.com/GoogleCloudPlatform/otlp-k8s-ingest/refs/heads/otlpmetric/k8s/base/5_hpa.yaml
Attendi che i pod del raccoglitore raggiungano lo stato "Running" e che 1/1 container siano pronti. Se questo è il primo carico di lavoro di cui viene eseguito il deployment, l'operazione richiede circa tre minuti su Autopilot. Per controllare i pod, utilizza il seguente comando:
kubectl get po -n opentelemetry -wPer interrompere il monitoraggio dello stato del pod, premi Ctrl+C per interrompere il comando.
Puoi anche controllare i log dell'agente di raccolta per assicurarti che non ci siano errori evidenti:
kubectl logs -n opentelemetry deployment/opentelemetry-collector
Esegui il deployment del generatore di telemetria
Puoi testare la tua configurazione utilizzando lo
strumento telemetrygen open source. Questa app
genera dati di telemetria e li invia all'agente di raccolta.
Per eseguire il deployment dell'app
telemetrygennello spazio dei nomiopentelemetry-demo, esegui questo comando:kubectl apply -f https://raw.githubusercontent.com/GoogleCloudPlatform/otlp-k8s-ingest/refs/heads/main/sample/app.yamlDopo aver creato il deployment, potrebbe essere necessario un po' di tempo prima che i pod vengano creati e inizino a essere eseguiti. Per controllare lo stato dei pod, esegui questo comando:
kubectl get po -n opentelemetry-demo -wPer interrompere il monitoraggio dello stato del pod, premi Ctrl+C per interrompere il comando.
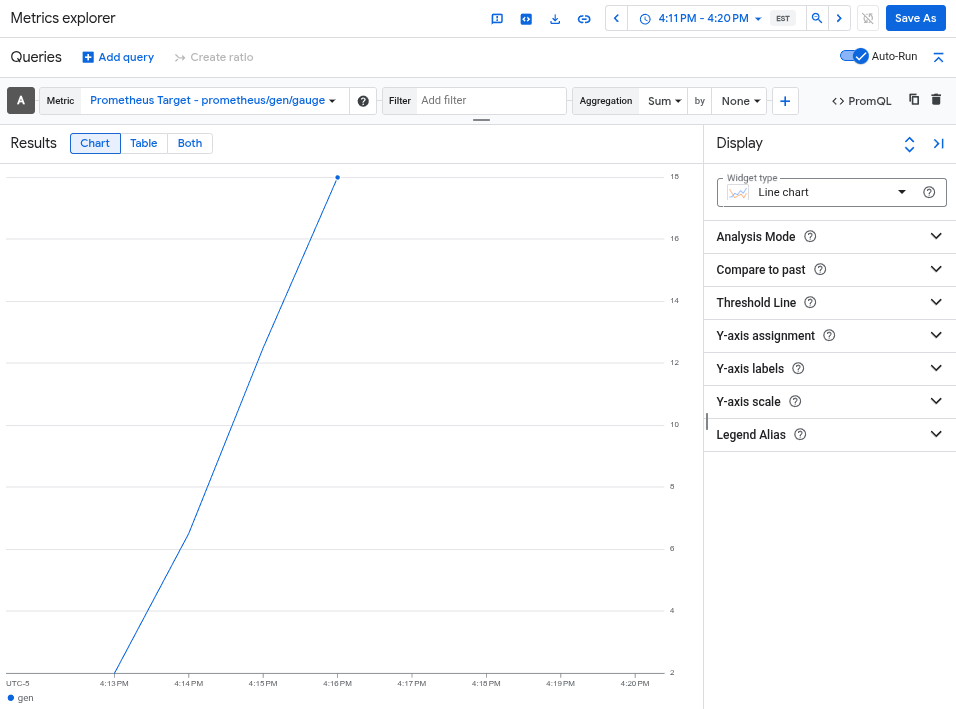
Eseguire query su una metrica utilizzando Metrics Explorer
Lo strumento telemetrygen scrive in una metrica chiamata gen. Puoi eseguire query
su questa metrica sia dall'interfaccia di Query Builder sia dall'editor di query PromQL
in Metrics Explorer.
Nella console Google Cloud , vai alla pagina leaderboard Esplora metriche:
Se utilizzi la barra di ricerca per trovare questa pagina, seleziona il risultato con il sottotitolo Monitoring.
- Se utilizzi l'interfaccia di creazione delle query di Metrics Explorer, il nome completo della metrica è
prometheus.googleapis.com/gen/gauge. - Se utilizzi l'editor di query PromQL, puoi eseguire query sulla metrica
utilizzando il nome
gen.
L'immagine seguente mostra un grafico della metrica gen in Metrics Explorer:
Elimina il cluster
Dopo aver verificato il deployment eseguendo una query sulla metrica, puoi eliminare il cluster. Per eliminare il cluster, esegui questo comando:
gcloud container clusters delete --location CLUSTER_LOCATION otlp-test --project PROJECT_ID
Utilizzare altri raccoglitori basati su OpenTelemetry
Potresti essere in grado di utilizzare altri raccoglitori basati su OpenTelemetry per inviare metriche OTLP all'API Telemetry, anche se Google Cloud non fornisce assistenza clienti per i raccoglitori basati su OpenTelemetry non standard.
Ad esempio, puoi inviare metriche utilizzando
Grafana Alloy versione 1.16.0 o
successiva eseguendo l'autenticazione con il
componente otelcol.auth.google
e configurandolo in modo simile a un agente di raccolta OpenTelemetry standard
utilizzando le istruzioni riportate in questo documento.
Passaggi successivi
- Per informazioni sull'utilizzo di un agente di raccolta OpenTelemetry e dell'API Telemetry con l'instrumentazione zero-code di OpenTelemetry, consulta Utilizzare l'instrumentazione zero-code di OpenTelemetry per Java.
- Per informazioni sull'invio di metriche da applicazioni che utilizzano SDK, consulta Utilizzare gli SDK per inviare metriche dalle applicazioni.
- Per informazioni sulla migrazione all'esportatore
otlphttpda un altro esportatore, vedi Eseguire la migrazione all'esportatore OTLP. - Per scoprire di più sull'API Telemetry, consulta la panoramica dell'API Telemetry (OTLP).