
This document demonstrates how to automatically instrument Java applications running on Google Kubernetes Engine (GKE) by using OpenTelemetry zero-code instrumentation. Zero-code instrumentation gives you comprehensive observability into your Java workloads with minimal manual effort.
This walkthrough provides detailed steps for deploying an example Java application to GKE, auto-instrumenting the application by using OpenTelemetry, and visualizing the generated telemetry signals by using Google Cloud Observability.
The walkthrough describes auto-instrumenting Java workloads running on GKE, but you can extend these instructions to other supported languages.
Why use zero-code instrumentation?
Zero-code instrumentation (also called auto-instrumentation) in OpenTelemetry is a powerful tool that lets application developers add configurable observability to their code without needing to write any additional code or modify any existing code. Zero-code instrumentation works by automatically adding instrumentation to actively deployed application libraries, giving reliable insights into application performance by emitting Golden Signals. This makes zero-code instrumentation an excellent starting point for an application's observability journey.
Zero-code instrumentation in Java emits metrics and trace spans by instrumenting popular libraries that are widely used in the language's ecosystem. For Java, the metrics include:
- JVM runtime metrics emitted by the Java Platform
- HttpClient metrics and HttpClient spans emitted from libraries like the Java Http Client library and the Google Http Client library.
- Database Client metrics and Database Client spans emitted from libraries like JDBC and Lettuce.
The set of metrics emitted depends on the application being instrumented and the libraries used by the application. For a full list of libraries and frameworks that can be instrumented by the Java zero-code instrumentation agent, see Supported Libraries and Frameworks.
With auto-instrumentation, you can do things like:
- Get Golden Signals monitoring without having to make any code changes.
- Correlate high p99.9 latency to individual user traces, which span every RPC call.
- Get consistent telemetry across metrics, logs, and traces from a wide variety of popular libraries and frameworks.
For more information about zero-code instrumentation, see OpenTelemetry Zero-code.
Overview
Adding observability to a Java workload running on GKE requires deploying the following components:
- OpenTelemetry zero-code instrumentation, which generates the telemetry from your application.
- The OpenTelemetry Collector, which collects the telemetry generated by your application, enriches it with critical metadata and context, and routes it to Google Cloud for consumption.
In this walkthrough, you deploy an instrumented Java application on GKE that emits metrics and traces to Google Cloud. You can then view these telemetry signals by using Google Cloud's observability offerings such as Metrics Explorer, Logs Explorer, and Trace Explorer. For information about how to view and use the generated telemetry, see View your telemetry.
This walkthrough uses the following chargeable services to write signals:
- Cloud Monitoring's Managed Service for Prometheus
- Cloud Logging
- Cloud Trace
- Google Kubernetes Engine
- Cloud Build
- Artifact Registry
To generate a cost estimate based on your projected usage, use the pricing calculator.
Before you begin
This section describes how to set up your environment for deploying and instrumenting the app and then running it.
Select or create a Google Cloud project
Choose a Google Cloud project for this walkthrough. If you don't already have a Google Cloud project, then create one:
- Sign in to your Google Cloud account. If you're new to Google Cloud, create an account to evaluate how our products perform in real-world scenarios. New customers also get $300 in free credits to run, test, and deploy workloads.
-
In the Google Cloud console, on the project selector page, select or create a Google Cloud project.
Roles required to select or create a project
- Select a project: Selecting a project doesn't require a specific IAM role—you can select any project that you've been granted a role on.
-
Create a project: To create a project, you need the Project Creator role
(
roles/resourcemanager.projectCreator), which contains theresourcemanager.projects.createpermission. Learn how to grant roles.
-
Verify that billing is enabled for your Google Cloud project.
-
In the Google Cloud console, on the project selector page, select or create a Google Cloud project.
Roles required to select or create a project
- Select a project: Selecting a project doesn't require a specific IAM role—you can select any project that you've been granted a role on.
-
Create a project: To create a project, you need the Project Creator role
(
roles/resourcemanager.projectCreator), which contains theresourcemanager.projects.createpermission. Learn how to grant roles.
-
Verify that billing is enabled for your Google Cloud project.
Install command-line tools
This document uses following command-line tools:
gcloudkubectl
The gcloud and kubectl tools are part of the
Google Cloud CLI. For information about installing them, see
Managing Google Cloud CLI components. To see the
gcloud CLI components you have installed, run the following
command:
gcloud components list
Set environment variables
To reduce the typing of frequent values, prevent typing errors, and make the commands in this document runnable, set the following environment variables:
export GOOGLE_CLOUD_PROJECT=PROJECT_ID
export CLUSTER_NAME=CLUSTER_NAME
export CLUSTER_REGION=us-east1
export ARTIFACT_REGISTRY=opentelemetry-autoinstrument-registry
export REGISTRY_LOCATION=us-east4
Before running the commands, replace the following variables or use the defaults:
- PROJECT_ID: The identifier of the project.
- CLUSTER_NAME: The name for your cluster. This can refer to a new or existing cluster.
- us-east1: The region for your cluster. If you're using an existing cluster, then use that cluster's region.
- opentelemetry-autoinstrument-registry: The name for your Artifact Registry repository. This can refer to a new or existing repository.
- us-east4: The region for your Artifact Registry repository. If you're using an existing repository, then use that repository's region.
If you encounter errors when running the commands in this document, check that these variables are set correctly in your terminal environment.
Enable APIs
To use the services in this document, you must have the following APIs enabled in your Google Cloud project:
- Artifact Registry API:
artifactregistry.googleapis.com - Cloud Build API:
cloudbuild.googleapis.com - Google Kubernetes Engine:
container.googleapis.com - Identity and Access Management API:
iam.googleapis.com - Cloud Logging API:
logging.googleapis.com - Cloud Monitoring API:
monitoring.googleapis.com - Telemetry API:
telemetry.googleapis.com
These APIs, with the probable exception of the Telemetry API, might already be enabled in your Google Cloud project. Run the following command to list the enabled APIs:
gcloud services list
Enable any of the APIs that are not already enabled.
Pay particular attention to the
Telemetry API, telemetry.googleapis.com; this document
might be the first time you've encountered this API.
To enable APIs that aren't already enabled, run the commands for the corresponding APIs:
gcloud services enable artifactregistry.googleapis.com
gcloud services enable cloudbuild.googleapis.com
gcloud services enable container.googleapis.com
gcloud services enable iam.googleapis.com
gcloud services enable logging.googleapis.com
gcloud services enable monitoring.googleapis.com
gcloud services enable telemetry.googleapis.com
Get permissions
-
To get the permissions that you need to run the application and to have it write log, metric, and trace data, ask your administrator to grant you the following IAM roles:
- Logs Writer (
roles/logging.logWriter) on your project - Monitoring Metric Writer (
roles/monitoring.metricWriter) on your project - Cloud Telemetry Traces Writer (
roles/telemetry.tracesWriter) on your project - Developer (
roles/container.developer) on your project - Cloud Build Editor (
roles/cloudbuild.builds.editor) on your project - Artifact Registry Writer (
roles/artifactregistry.writer) on your project - Service Account User (
roles/iam.serviceAccountUser) on your project - Service Usage Consumer (
roles/serviceusage.serviceUsageConsumer) on your quota project
These permissions are sufficient if you run the sample in the Cloud Shell, on Google Cloud resources, or on a local development environment. To learn how to configure a quota project, see Set the quota project.
- Logs Writer (
-
To get the permissions that you need to view log, metric, and trace data, ask your administrator to grant you the following IAM roles on your project:
- Logs Viewer (
roles/logging.viewer) - Monitoring Viewer (
roles/monitoring.viewer) - Cloud Trace User (
roles/cloudtrace.user)
- Logs Viewer (
Set up your cluster
Set up a GKE cluster for the sample application and collector:
Sign in to Google Cloud by running the following commands:
gcloud auth login
gcloud config set project PROJECT_ID
If you don't already have a GKE cluster, then create an Autopilot cluster by running the following command:
gcloud container clusters create-auto --region us-east1 CLUSTER_NAME --project PROJECT_IDTo interact with your cluster, connect your local
kubectlutility by running the following command:gcloud container clusters get-credentials CLUSTER_NAME --region us-east1 --project PROJECT_ID
Deploy the Java application
The steps in this section deploy an uninstrumented sample Java application, the OpenTelemetry Spring Boot instrumentation example, on your cluster. This section uses Cloud Build and Artifact Registry to create and store the application image.
If you don't already have an Artifact Registry repository, create a repository by running the following command:
gcloud artifacts repositories create opentelemetry-autoinstrument-registry --repository-format=docker --location=us-east4 --description="GKE Autoinstrumentation sample app"Clone the sample application by running the following command:
git clone https://github.com/GoogleCloudPlatform/opentelemetry-operations-java.gitSet the following environment variables:
export GOOGLE_CLOUD_PROJECT=PROJECT_ID
export ARTIFACT_REGISTRY=opentelemetry-autoinstrument-registry
export REGISTRY_LOCATION=us-east4
Build the application image and push it to your Artifact Registry repository by running the following commands:
pushd opentelemetry-operations-java/examples/instrumentation-quickstart && \ gcloud builds submit --config <(envsubst < cloudbuild-uninstrumented-app.yaml) . && \ popdCreate a Kubernetes deployment configuration file for the application. Copy the following configuration and save it to a file called
deployment.yaml:apiVersion: v1 kind: Service metadata: name: quickstart-app labels: app: quickstart-app app.kubernetes.io/part-of: gke-autoinstrument-guide spec: ports: - port: 8080 targetPort: 8080 name: quickstart-app selector: app: quickstart-app --- apiVersion: apps/v1 kind: Deployment metadata: name: quickstart-app labels: app: quickstart-app app.kubernetes.io/part-of: gke-autoinstrument-guide spec: replicas: 2 selector: matchLabels: app: quickstart-app template: metadata: labels: app: quickstart-app spec: containers: - name: quickstart-app image: us-east4-docker.pkg.dev/PROJECT_ID/opentelemetry-autoinstrument-registry/java-quickstart:latest ports: - containerPort: 8080 name: quickstart-appCreate a namespace for your application by running the following command:
kubectl create namespace APPLICATION_NAMESPACEApply the deployment configuration to your cluster by running the following command:
kubectl apply -f deployment.yaml -n APPLICATION_NAMESPACEAfter you create the deployment, it might take a while for the pods to be created and start running. To check the status of the pods, run the following command:
kubectl get po -n APPLICATION_NAMESPACE -wTo stop watching the pod status, enter Ctrl-C to stop the command.
Set up an OpenTelemetry Collector instance
In this section, you create another deployment that runs a Google-Built OpenTelemetry Collector instance in your GKE cluster. The collector is configured to export data by using the following exporters:
- Metrics by using the OTLP HTTP exporter
- Traces by using the OTLP HTTP exporter
- Logs by using the Google Cloud Exporter
Instead of following the manual steps in this document to deploy the OpenTelemetry Collector, you could follow Managed OpenTelemetry for GKE, which uses the Google-Built OpenTelemetry Collector in a managed environment.
Authorize the Kubernetes service account for the OpenTelemetry Collector's deployment by running the following commands:
export PROJECT_NUMBER=$(gcloud projects describe PROJECT_ID --format="value(projectNumber)")

gcloud projects add-iam-policy-binding projects/PROJECT_ID \
  --role=roles/logging.logWriter \
  --member=principal://iam.googleapis.com/projects/$PROJECT_NUMBER/locations/global/workloadIdentityPools/PROJECT_ID.svc.id.goog/subject/ns/opentelemetry/sa/opentelemetry-collector \
  --condition=None

gcloud projects add-iam-policy-binding projects/PROJECT_ID \
  --role=roles/monitoring.metricWriter \
  --member=principal://iam.googleapis.com/projects/$PROJECT_NUMBER/locations/global/workloadIdentityPools/PROJECT_ID.svc.id.goog/subject/ns/opentelemetry/sa/opentelemetry-collector \
  --condition=None

gcloud projects add-iam-policy-binding projects/PROJECT_ID \
  --role=roles/telemetry.tracesWriter \
  --member=principal://iam.googleapis.com/projects/$PROJECT_NUMBER/locations/global/workloadIdentityPools/PROJECT_ID.svc.id.goog/subject/ns/opentelemetry/sa/opentelemetry-collector \
  --condition=None
Deploy the Google-Built OpenTelemetry Collector instance on your GKE cluster with the recommended, default configuration by running the following command:
kubectl kustomize https://github.com/GoogleCloudPlatform/otlp-k8s-ingest//k8s/base?ref=otlpmetric | envsubst | kubectl apply -f -This configuration deploys the collector to the
opentelemetrynamespace.After you create the deployment, it might take a while for the pods to be created and start running. To check the status of the pods, run the following command:
kubectl get po -n opentelemetry -wTo stop watching the pod status, enter Ctrl-C to stop the command.
Configure OpenTelemetry zero-code instrumentation
To configure OpenTelemetry zero-code instrumentation for an application deployed on GKE, you install the OpenTelemetry Operator on your GKE cluster. The OpenTelemetry Operator provides access to a Kubernetes Custom Resource Definition (CRD), the Instrumentation Resource, that is used to inject auto-instrumentation into Kubernetes resources running within a cluster.
The Instrumentation Resource is "injected" or "applied" to specific workloads by using special annotations. The OpenTelemetry Operator observes these annotations on resources running within the cluster and injects the appropriate instrumentation in the applications managed by those resources.
If you don't already have the Helm CLI installed, then install Helm by running the following commands:
curl -fsSL -o get_helm.sh https://raw.githubusercontent.com/helm/helm/main/scripts/get-helm-3

chmod 700 get_helm.sh

./get_helm.sh
If you don't already have
cert-managerinstalled on the cluster, then install it by running the following commands:helm repo add jetstack https://charts.jetstack.io helm repo update helm install \ --create-namespace \ --namespace cert-manager \ --set installCRDs=true \ --set global.leaderElection.namespace=cert-manager \ --set extraArgs={--issuer-ambient-credentials=true} \ cert-manager jetstack/cert-managerInstall the OpenTelemetry Operator by running the following command and using version 0.140.0 or newer:
kubectl apply -f https://github.com/open-telemetry/opentelemetry-operator/releases/download/v0.140.0/opentelemetry-operator.yamlCreate a configuration file for the Instrumentation Custom Resource by creating a file named
instrumentation.yamlwith the following contents:apiVersion: opentelemetry.io/v1alpha1 kind: Instrumentation metadata: name: sample-java-auto-instrumentation spec: exporter: endpoint: http://opentelemetry-collector.opentelemetry.svc.cluster.local:4317 sampler: type: parentbased_traceidratio # Adjust the sampling rate to control cost argument: "0.01" java: env: - name: OTEL_EXPORTER_OTLP_PROTOCOL value: grpc - name: OTEL_LOGS_EXPORTER value: noneCreate a namespace for the Operator. You can use the same value you used for the application namespace, APPLICATION_NAMESPACE.
kubectl create namespace INSTRUMENTATION_NAMESPACECreate the Instrumentation Custom Resource in your cluster and apply your
instrumentation.yamlfile by running the following command:kubectl apply -f instrumentation.yaml -n INSTRUMENTATION_NAMESPACEApply the auto-instrumentation annotation to the example Java application deployed previously. Patch the the original deployment with the annotation by running the following command:
kubectl patch deployment.apps/quickstart-app -n APPLICATION_NAMESPACE -p '{"spec":{"template":{"metadata":{"annotations":{"instrumentation.opentelemetry.io/inject-java": "'"INSTRUMENTATION_NAMESPACE"'/sample-java-auto-instrumentation"}}}}}'After patching the deployment, which causes the application deployment to restart, you can check the status of the pods in the application by running the following command:
kubectl get po -n APPLICATION_NAMESPACE -wTo stop watching the pod status, enter Ctrl-C to stop the command.
The Java application deployed in your GKE cluster is now auto-instrumented.
Generate telemetry from the deployed application
To generate telemetry from the auto-instrumented application, you need to send requests to the application to simulate user activity. You can generate a steady stream of traffic by running a traffic simulator. This section describes how download the simulator, build it by using Cloud Build, store in image in Artifact Registry, and deploy the simulator:
Download the traffic simulator application by running the following commands:
mkdir traffic-simulator && pushd traffic-simulator && \
curl -O https://raw.githubusercontent.com/GoogleCloudPlatform/opentelemetry-operator-sample/refs/heads/main/recipes/self-managed-otlp-ingest/traffic/hey.Dockerfile  && \
curl -O https://raw.githubusercontent.com/GoogleCloudPlatform/opentelemetry-operator-sample/refs/heads/main/recipes/self-managed-otlp-ingest/traffic/cloudbuild-hey.yaml && \
popd
The previous commands do the following:
- Create a separate directory for building a traffic-simulator application.
- Download the Dockerfile for the application.
- Download the Cloud Build configuration to build the application image.
Create the application image with Cloud Build and push it to Artifact Registry by running the following commands:
pushd traffic-simulator && \
gcloud builds submit --config <(envsubst < cloudbuild-hey.yaml) . && \
popd
Create a deployment configuration file for the simulator by copying the following content into a file in the
traffic-simulatordirectory namedquickstart-traffic.yaml:apiVersion: apps/v1 kind: Deployment metadata: name: traffic-simulator labels: app.kubernetes.io/part-of: gke-autoinstrument-guide spec: replicas: 1 selector: matchLabels: app: traffic-simulator template: metadata: labels: app: traffic-simulator spec: containers: - name: traffic-simulator image: us-east4-docker.pkg.dev/PROJECT_ID/opentelemetry-autoinstrument-registry/hey:latest args: - -c=2 - -q=1 - -z=1h - http://quickstart-app:8080/multiDeploy the traffic simulator by running the following commands:
pushd traffic-simulator && \
kubectl apply -f quickstart-traffic.yaml -n APPLICATION_NAMESPACE && \
popd
After you create the deployment, it might take a while for the pods to be created and start running. To check the status of the pods, run the following command:
kubectl get po -n APPLICATION_NAMESPACE -wTo stop watching the pod status, enter Ctrl-C to stop the command.
View your telemetry
After the traffic simulator starts sending requests to the application, the deployed Java application generates telemetry. It might take a few minutes for the metrics and traces to start showing up in Google Cloud.
The instrumentation injected by the OpenTelemetry Operator relies on the OpenTelemetry Java Agent. The OpenTelemetry Java Agent contains built-in instrumentation for many popular Java libraries and frameworks that emit metrics.
The injected instrumentation also automatically captures traces for any calls made to any endpoint exposed by the sample application. The traffic simulator constantly sends requests to the
/multiendpoint exposed by the Java application at a fixed rate. The/multiendpoint in turn sends requests to/singleendpoint to generate the final response. These interactions end up as traces that can be viewed using the Trace Explorer.
View metrics
You can view your auto-instrumented metrics in Cloud Monitoring's Metrics Explorer. This section includes sample queries written in PromQL.
In the Google Cloud console, go to the leaderboard Metrics explorer page:
If you use the search bar to find this page, then select the result whose subheading is Monitoring.
Some of the metrics you can view for the sample application include the following:
JVM Runtime metrics: The OpenTelemetry Java Agent emits metrics about the underlying JVM. These metrics expose information about JVM memory, garbage collection, classes, threads, and other related concepts. For a full list of supported JVM metrics, see the JVM Runtime Metrics Semantic Conventions page.
JVM memory usage: paste the following PromQL query into Metrics Explorer:
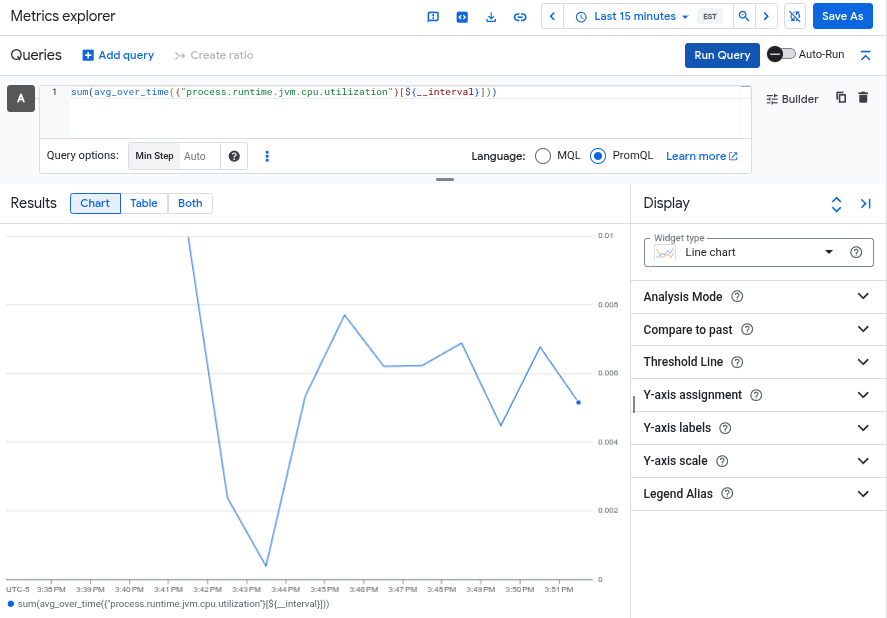
sum(avg_over_time({"process.runtime.jvm.memory.usage"}[${__interval}]))JVM CPU utilization: paste the following PromQL query into Metrics Explorer:
sum(avg_over_time({"process.runtime.jvm.cpu.utilization"}[${__interval}]))The following chart shows the JVM CPU utilization metric:
Spring Boot metrics: The sample application uses the Spring Boot framework, which is also supported by OpenTelemetry zero-code instrumentation for Java.
Mean HTTP client duration: paste the following PromQL query into Metrics Explorer:
sum(rate({"http.client.duration_sum"}[${__interval}])) by (cluster, job) / sum(rate({"http.client.duration_count"}[${__interval}])) by (cluster, job)Mean HTTP server duration: paste the following PromQL query into Metrics Explorer:
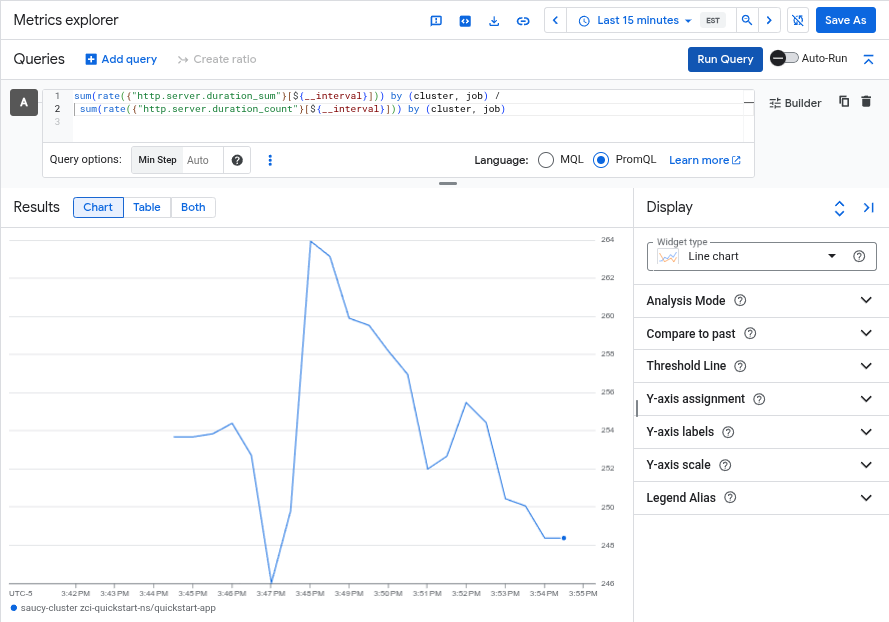
sum(rate({"http.server.duration_sum"}[${__interval}])) by (cluster, job) / sum(rate({"http.server.duration_count"}[${__interval}])) by (cluster, job)The following chart shows the Spring Boot mean HTTP server duration metric:
For more information about using Metrics Explorer, see Select metrics when using Metrics Explorer.
View traces
You can view your auto-instrumented traces in Cloud Trace's
Trace Explorer. You can filter these traces in Trace Explorer
by filtering on the "Service Name" and setting the service name to
quickstart-app.
In the Google Cloud console, go to the
![]() Trace explorer page:
Trace explorer page:
You can also find this page by using the search bar.
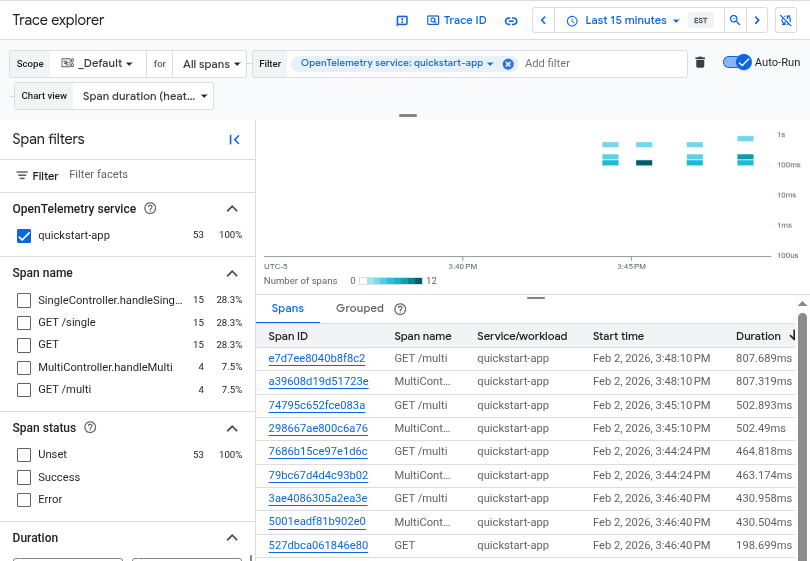
The following screenshot shows traces generated by the OpenTelemetry
quickstart-app deployment:
For more information about using Trace Explorer, see Find and explore traces.
Clean up
If you created a new Google Cloud project and you no longer need it, then you can delete it by running the following command:
gcloud projects delete PROJECT_ID
If you used an existing project, you can delete the resources you created as part of this walkthough to save costs:
Delete the GKE cluster by running the following command:
gcloud container clusters delete CLUSTER_NAME --location=us-east1Delete the Artifact Registry repository by running the following command:
gcloud artifacts repositories delete opentelemetry-autoinstrument-registry --location=us-east4