

You can use exemplars to correlate your metric and trace data. An exemplar is a representative sample request or span associated with a metric measurement. Your application can create and attach exemplars to metric data. Alternatively, Google Cloud Observability can generate them dynamically when charting query results. By linking an individual trace ID to an aggregated metric, exemplars help you quickly investigate the root cause of latency spikes or errors.
This document describes how to configure OpenTelemetry to create and attach trace exemplars to your metric data.
If you chart SQL query results on a dashboard, Google Cloud Observability can also generate exemplars automatically. For more information, see Generate and display trace exemplars.
About exemplars
Exemplars are a way to associate arbitrary data with metric data. You can use
them to attach non-metric data to measurements.
One use of exemplars is to associate trace data with metric data.
In Cloud Monitoring, exemplars can be
attached to metric data that has the Distribution
value type. Distribution-valued metrics collect many measurements and group
them into buckets.
Each "point" is a histogram, which is an array that lists bucket counts.
The actual measurements
aren't retained, only the bucket counts. For more information, see
About distribution-valued metrics.
When a metric data point is written, an array of Exemplar
objects can be attached to that data. Exemplars, when used,
attach useful information to the metric data. For example,
when OpenTelemetry writes an exemplar, it attaches a link to the current
span of a trace.
Histogram data is typically displayed by using a heatmap. When a "point" contains an exemplar, Cloud Monitoring annotates the heatmap with a dot:
- To view summary information about the metric point, activate the tooltip for the annotation.
- To access the trace, select the annotation.
For example, the
Go instrumentation sample uses OpenTelemetry to
write metric data, trace data, and exemplars.
The following screenshot shows the value of the
prometheus/http_server_duration_milliseconds/histogram metric after
several executions of the application:
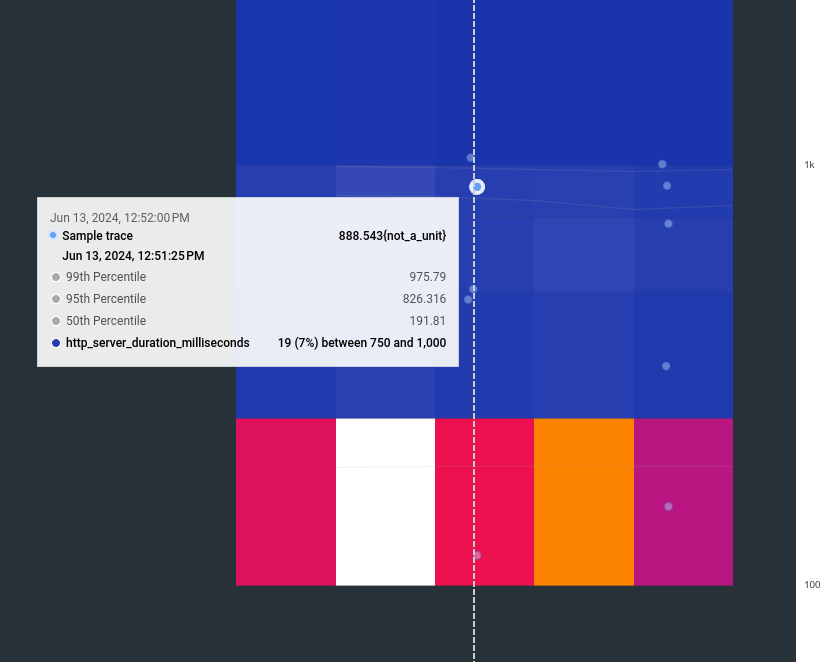
The previous screenshot shows multiple exemplars. The tooltip for one exemplar is expanded, and it shows the date, the trace name, percentiles, and a latency value.
When the annotation is selected, the trace linked in the exemplar is displayed:
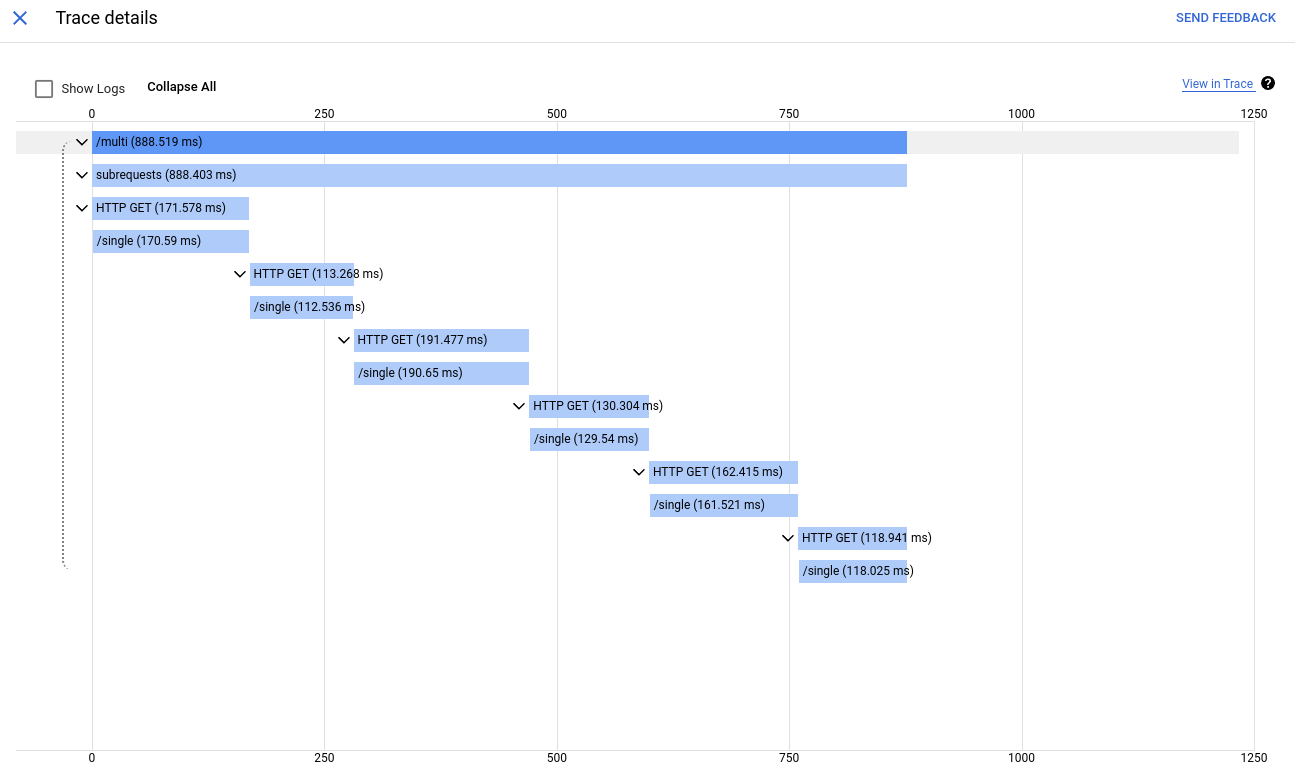
When the displayed information isn't sufficiently detailed, you can select View in Trace, which opens the Trace Explorer page. On that page, you can view trace attributes and access links to log entries.
How to enable OpenTelemetry exemplars
As the previous example illustrates, you can configure OpenTelemetry to write exemplars that link the current span of a trace to a metric measurement. However, for exemplars to be written, you must do the following:
- Configure both the OpenTelemetry metric and trace SDKs.
To include exemplars on your custom instrumentation, ensure that the metric is recorded within a span, and that you pass the context from the span with the metric measurement.
For example, the
computeSubrequestsfunction follows the previous guidance. The functionsubRequestsHistogram.Recordis invoked aftertracer.Startand beforespan.End, which is deferred. Also notice that the context,ctx, is passed fromtracer.Startto theRecordfunction:For more information about this sample, see Add custom traces and metrics to your app.