部署和使用收集器

本文档介绍了如何部署 OpenTelemetry 收集器、如何配置该收集器以使用 otlphttp 导出器和 Telemetry (OTLP) API,以及如何运行遥测生成器以将指标写入 Cloud Monitoring。然后,您可以在 Cloud Monitoring 中查看这些指标。

如果您使用的是 Google Kubernetes Engine,则可以按照适用于 GKE 的受管 OpenTelemetry 中的说明操作,而无需手动部署和配置使用 Telemetry API 的 OpenTelemetry 收集器。

如果您使用 SDK 将指标从应用直接发送到 Telemetry API,请参阅使用 SDK 从应用发送指标,了解更多信息和示例。

您还可以将 OpenTelemetry 收集器和 Telemetry API 与 OpenTelemetry 零代码插桩结合使用。如需了解详情,请参阅使用 OpenTelemetry 零代码插桩功能检测 Java 应用

准备工作

本部分介绍了如何设置环境以部署和使用收集器。

选择或创建 Google Cloud 项目

为此演练选择一个 Google Cloud 项目。如果您还没有 Google Cloud 项目,请进行创建:

  1. 登录您的 Google Cloud 账号。如果您是 Google Cloud新手,请 创建一个账号来评估我们的产品在实际场景中的表现。新客户还可获享 $300 赠金,用于运行、测试和部署工作负载。
  2. In the Google Cloud console, on the project selector page, select or create a Google Cloud project.

    Roles required to select or create a project

    • Select a project: Selecting a project doesn't require a specific IAM role—you can select any project that you've been granted a role on.
    • Create a project: To create a project, you need the Project Creator role (roles/resourcemanager.projectCreator), which contains the resourcemanager.projects.create permission. Learn how to grant roles.

    Go to project selector

  3. Verify that billing is enabled for your Google Cloud project.

  4. In the Google Cloud console, on the project selector page, select or create a Google Cloud project.

    Roles required to select or create a project

    • Select a project: Selecting a project doesn't require a specific IAM role—you can select any project that you've been granted a role on.
    • Create a project: To create a project, you need the Project Creator role (roles/resourcemanager.projectCreator), which contains the resourcemanager.projects.create permission. Learn how to grant roles.

    Go to project selector

  5. Verify that billing is enabled for your Google Cloud project.

安装命令行工具

本文档使用以下命令行工具:

  • gcloud
  • kubectl

gcloudkubectl 工具是 Google Cloud CLI 的一部分。如需了解如何安装这些工具,请参阅管理 Google Cloud CLI 组件。如需查看已安装的 gcloud CLI 组件,请运行以下命令:

gcloud components list

如需配置 gcloud CLI 以供使用,请运行以下命令:

gcloud auth login
gcloud config set project PROJECT_ID

启用 API

在Google Cloud 项目中启用 Cloud Monitoring API 和 Telemetry API。请特别注意 Telemetry API (telemetry.googleapis.com);您可能还是第一次遇到此 API。

运行以下命令以启用 API:

gcloud services enable monitoring.googleapis.com
gcloud services enable telemetry.googleapis.com

创建集群

创建 GKE 集群。

  1. 运行以下命令,创建名为 otlp-test 的 Google Kubernetes Engine 集群:

    gcloud container clusters create-auto --location CLUSTER_LOCATION otlp-test --project PROJECT_ID
    
  2. 创建集群后,运行以下命令以连接到该集群:

    gcloud container clusters get-credentials otlp-test --region CLUSTER_LOCATION --project PROJECT_ID
    

授权 Kubernetes 服务账号

以下命令会向 Kubernetes 服务账号授予必要的 Identity and Access Management (IAM) 角色。这些命令假设您使用的是适用于 GKE 的 Workload Identity Federation

export PROJECT_NUMBER=$(gcloud projects describe PROJECT_ID --format="value(projectNumber)")

gcloud projects add-iam-policy-binding projects/PROJECT_ID \
  --role=roles/logging.logWriter \
  --member=principal://iam.googleapis.com/projects/$PROJECT_NUMBER/locations/global/workloadIdentityPools/PROJECT_ID.svc.id.goog/subject/ns/opentelemetry/sa/opentelemetry-collector \
  --condition=None

gcloud projects add-iam-policy-binding projects/PROJECT_ID \
  --role=roles/monitoring.metricWriter \
  --member=principal://iam.googleapis.com/projects/$PROJECT_NUMBER/locations/global/workloadIdentityPools/PROJECT_ID.svc.id.goog/subject/ns/opentelemetry/sa/opentelemetry-collector \
  --condition=None

gcloud projects add-iam-policy-binding projects/PROJECT_ID \
  --role=roles/telemetry.tracesWriter \
  --member=principal://iam.googleapis.com/projects/$PROJECT_NUMBER/locations/global/workloadIdentityPools/PROJECT_ID.svc.id.goog/subject/ns/opentelemetry/sa/opentelemetry-collector \
  --condition=None

如果您的服务账号采用其他格式,则可以使用 Google Cloud Managed Service for Prometheus 文档中的命令来授权服务账号,但需进行以下更改:

  • 将服务账号名称 gmp-test-sa 替换为您的服务账号。
  • 授予上一组命令中显示的角色,而不仅仅是 roles/monitoring.metricWriter 角色。

部署 OpenTelemetry 收集器

创建收集器配置:复制以下 YAML 文件并将其放在名为 collector.yaml 的文件中。您还可以在 GitHub 的 otlp-k8s-ingest 代码库中找到以下配置。

在您的副本中,请务必将 ${GOOGLE_CLOUD_PROJECT} 替换为您的项目 ID PROJECT_ID

只有在使用 OpenTelemetry 收集器版本 0.140.0 或更高版本时,OTLP for Prometheus 指标才能正常运行。

# Copyright 2024 Google LLC
#
# Licensed under the Apache License, Version 2.0 (the "License");
# you may not use this file except in compliance with the License.
# You may obtain a copy of the License at
#
#     http://www.apache.org/licenses/LICENSE-2.0
#
# Unless required by applicable law or agreed to in writing, software
# distributed under the License is distributed on an "AS IS" BASIS,
# WITHOUT WARRANTIES OR CONDITIONS OF ANY KIND, either express or implied.
# See the License for the specific language governing permissions and
# limitations under the License.

exporters:
  # The googlecloud exporter is used for logs
  googlecloud:
    log:
      default_log_name: opentelemetry-collector
    user_agent: Google-Cloud-OTLP manifests:0.4.0 OpenTelemetry Collector Built By Google/0.128.0 (linux/amd64)
  googlemanagedprometheus:
    user_agent: Google-Cloud-OTLP manifests:0.4.0 OpenTelemetry Collector Built By Google/0.128.0 (linux/amd64)
  # The otlphttp exporter is used to send traces to Google Cloud Trace and
  # metrics to Google Managed Prometheus using OTLP http/proto.
  # The otlp exporter could also be used to send them using OTLP grpc
  otlphttp:
    encoding: proto
    endpoint: https://telemetry.googleapis.com
    # Use the googleclientauth extension to authenticate with Google credentials
    auth:
      authenticator: googleclientauth


extensions:
  # Standard for the collector. Used for probes.
  health_check:
    endpoint: ${env:MY_POD_IP}:13133
  # This is an auth extension that adds Google Application Default Credentials to http and gRPC requests.
  googleclientauth:


processors:
  # This filter is a standard part of handling the collector's self-observability metrics. Not related to OTLP ingestion.
  filter/self-metrics:
    metrics:
      include:
        match_type: strict
        metric_names:
        - otelcol_process_uptime
        - otelcol_process_memory_rss
        - otelcol_grpc_io_client_completed_rpcs
        - otelcol_googlecloudmonitoring_point_count

  # The recommended batch size for the OTLP endpoint is 200 metric data points.
  batch:
    send_batch_max_size: 200
    send_batch_size: 200
    timeout: 5s

  # The k8sattributes processor adds k8s resource attributes to metrics based on the source IP that sent the metrics to the collector.
  # k8s attributes are important for avoiding errors from timeseries "collisions".
  # These attributes help distinguish workloads from each other, and provide useful metadata (e.g. namespace) when querying.
  k8sattributes:
    extract:
      metadata:
      - k8s.namespace.name
      - k8s.deployment.name
      - k8s.statefulset.name
      - k8s.daemonset.name
      - k8s.cronjob.name
      - k8s.job.name
      - k8s.replicaset.name
      - k8s.node.name
      - k8s.pod.name
      - k8s.pod.uid
      - k8s.pod.start_time
    passthrough: false
    pod_association:
    - sources:
      - from: resource_attribute
        name: k8s.pod.ip
    - sources:
      - from: resource_attribute
        name: k8s.pod.uid
    - sources:
      - from: connection

  # Standard processor for gracefully degrading when overloaded to prevent OOM.
  memory_limiter:
    check_interval: 1s
    limit_percentage: 65
    spike_limit_percentage: 20

  # Standard processor for enriching self-observability metrics. Unrelated to OTLP ingestion.
  metricstransform/self-metrics:
    transforms:
    - action: update
      include: otelcol_process_uptime
      operations:
      - action: add_label
        new_label: version
        new_value: Google-Cloud-OTLP manifests:0.4.0 OpenTelemetry Collector Built By Google/0.128.0 (linux/amd64)

  # The resourcedetection processor, similar to the k8sattributes processor, enriches metrics with important metadata.
  # The gcp detector provides the cluster name and cluster location.
  resourcedetection:
    detectors: [gcp]
    timeout: 10s

  # This transform processor avoids ingestion errors if metrics contain attributes with names that are reserved for the prometheus_target resource.
  transform/collision:
    metric_statements:
    - context: datapoint
      statements:
      - set(attributes["exported_location"], attributes["location"])
      - delete_key(attributes, "location")
      - set(attributes["exported_cluster"], attributes["cluster"])
      - delete_key(attributes, "cluster")
      - set(attributes["exported_namespace"], attributes["namespace"])
      - delete_key(attributes, "namespace")
      - set(attributes["exported_job"], attributes["job"])
      - delete_key(attributes, "job")
      - set(attributes["exported_instance"], attributes["instance"])
      - delete_key(attributes, "instance")
      - set(attributes["exported_project_id"], attributes["project_id"])
      - delete_key(attributes, "project_id")

  # The relative ordering of statements between ReplicaSet & Deployment and Job & CronJob are important.
  # The ordering of these controllers is decided based on the k8s controller documentation available at
  # https://kubernetes.io/docs/concepts/workloads/controllers.
  # The relative ordering of the other controllers in this list is inconsequential since they directly
  # create pods.
  transform/aco-gke:
    metric_statements:
    - context: datapoint
      statements:
      - set(attributes["top_level_controller_type"], "ReplicaSet") where resource.attributes["k8s.replicaset.name"] != nil
      - set(attributes["top_level_controller_name"], resource.attributes["k8s.replicaset.name"]) where resource.attributes["k8s.replicaset.name"] != nil
      - set(attributes["top_level_controller_type"], "Deployment") where resource.attributes["k8s.deployment.name"] != nil
      - set(attributes["top_level_controller_name"], resource.attributes["k8s.deployment.name"]) where resource.attributes["k8s.deployment.name"] != nil
      - set(attributes["top_level_controller_type"], "DaemonSet") where resource.attributes["k8s.daemonset.name"] != nil
      - set(attributes["top_level_controller_name"], resource.attributes["k8s.daemonset.name"]) where resource.attributes["k8s.daemonset.name"] != nil
      - set(attributes["top_level_controller_type"], "StatefulSet") where resource.attributes["k8s.statefulset.name"] != nil
      - set(attributes["top_level_controller_name"], resource.attributes["k8s.statefulset.name"]) where resource.attributes["k8s.statefulset.name"] != nil
      - set(attributes["top_level_controller_type"], "Job") where resource.attributes["k8s.job.name"] != nil
      - set(attributes["top_level_controller_name"], resource.attributes["k8s.job.name"]) where resource.attributes["k8s.job.name"] != nil
      - set(attributes["top_level_controller_type"], "CronJob") where resource.attributes["k8s.cronjob.name"] != nil
      - set(attributes["top_level_controller_name"], resource.attributes["k8s.cronjob.name"]) where resource.attributes["k8s.cronjob.name"] != nil
  # For each Prometheus unknown-typed metric, which is a gauge, create a counter that is an exact copy of this metric.
  # The GCP OTLP endpoint will add appropriate the appropriate suffixes for the counter and gauge.
  transform/unknown-counter:
    metric_statements:
    - context: metric
      statements:
      # Copy the unknown metric, but add a suffix so we can distinguish the copy from the original.
      - copy_metric(Concat([metric.name, "unknowncounter"], ":")) where metric.metadata["prometheus.type"] == "unknown" and not HasSuffix(metric.name, ":unknowncounter")
      # Change the copy to a monotonic, cumulative sum.
      - convert_gauge_to_sum("cumulative", true) where HasSuffix(metric.name, ":unknowncounter")
      # Delete the extra suffix once we are done.
      - set(metric.name, Substring(metric.name, 0, Len(metric.name)-Len(":unknowncounter"))) where HasSuffix(metric.name, ":unknowncounter")

  # When sending telemetry to the GCP OTLP endpoint, the gcp.project_id resource attribute is required to be set to your project ID.
  resource/gcp_project_id:
    attributes:
    - key: gcp.project_id
      # MAKE SURE YOU REPLACE THIS WITH YOUR PROJECT ID
      value: ${GOOGLE_CLOUD_PROJECT}
      action: insert
  # The metricstarttime processor is important to include if you are using the prometheus receiver to ensure the start time is set properly.
  # It is a no-op otherwise.
  metricstarttime:
    strategy: subtract_initial_point

receivers:
  # This collector is configured to accept OTLP metrics, logs, and traces, and is designed to receive OTLP from workloads running in the cluster.
  otlp:
    protocols:
      grpc:
        endpoint: ${env:MY_POD_IP}:4317
      http:
        cors:
          allowed_origins:
          - http://*
          - https://*
        endpoint: ${env:MY_POD_IP}:4318

  # Push the collector's own self-observability metrics to the otlp receiver.
  otlp/self-metrics:
    protocols:
      grpc:
        endpoint: ${env:MY_POD_IP}:14317

service:
  extensions:
  - health_check
  - googleclientauth
  pipelines:
    # Recieve OTLP logs, and export logs using the googlecloud exporter.
    logs:
      exporters:
      - googlecloud
      processors:
      - k8sattributes
      - resourcedetection
      - memory_limiter
      - batch
      receivers:
      - otlp
    # Recieve OTLP metrics, and export metrics to GMP using the otlphttp exporter.
    metrics/otlp:
      exporters:
      - otlphttp
      processors:
      - k8sattributes
      - memory_limiter
      - resource/gcp_project_id
      - resourcedetection
      - transform/collision
      - transform/aco-gke
      - transform/unknown-counter
      - metricstarttime
      - batch
      receivers:
      - otlp
    # Scrape self-observability Prometheus metrics, and export metrics to GMP using the otlphttp exporter.
    metrics/self-metrics:
      exporters:
      - otlphttp
      processors:
      - filter/self-metrics
      - metricstransform/self-metrics
      - k8sattributes
      - memory_limiter
      - resource/gcp_project_id
      - resourcedetection
      - batch
      receivers:
      - otlp/self-metrics
    # Recieve OTLP traces, and export traces using the otlphttp exporter.
    traces:
      exporters:
      - otlphttp
      processors:
      - k8sattributes
      - memory_limiter
      - resource/gcp_project_id
      - resourcedetection
      - batch
      receivers:
      - otlp
  telemetry:
    logs:
      encoding: json
    metrics:
      readers:
      - periodic:
          exporter:
            otlp:
              protocol: grpc
              endpoint: ${env:MY_POD_IP}:14317

配置已部署的 OpenTelemetry 收集器

通过创建 Kubernetes 资源来配置收集器部署。

  1. 运行以下命令,创建 opentelemetry 命名空间并在该命名空间中创建收集器配置:

    kubectl create namespace opentelemetry
    
    kubectl create configmap collector-config -n opentelemetry --from-file=collector.yaml
    
  2. 运行以下命令,使用 Kubernetes 资源配置收集器:

    kubectl apply -f https://raw.githubusercontent.com/GoogleCloudPlatform/otlp-k8s-ingest/refs/heads/otlpmetric/k8s/base/2_rbac.yaml
    
    kubectl apply -f https://raw.githubusercontent.com/GoogleCloudPlatform/otlp-k8s-ingest/refs/heads/otlpmetric/k8s/base/3_service.yaml
    
    kubectl apply -f https://raw.githubusercontent.com/GoogleCloudPlatform/otlp-k8s-ingest/refs/heads/otlpmetric/k8s/base/4_deployment.yaml
    
    kubectl apply -f https://raw.githubusercontent.com/GoogleCloudPlatform/otlp-k8s-ingest/refs/heads/otlpmetric/k8s/base/5_hpa.yaml
    
  3. 等待收集器 pod 达到“正在运行”状态,并有 1/1 个容器准备就绪。如果这是首次部署工作负载,则在 Autopilot 上大约需要三分钟。如需检查 pod,请使用以下命令:

    kubectl get po -n opentelemetry -w
    

    如需停止监控 pod 状态,请输入 Ctrl-C 以停止该命令。

  4. 您还可以检查收集器日志,确保没有明显的错误:

    kubectl logs -n opentelemetry deployment/opentelemetry-collector
    

部署遥测生成器

您可以使用开源 telemetrygen 工具来测试配置。此应用会生成遥测数据并将其发送到收集器。

  1. 如需在 opentelemetry-demo 命名空间中部署 telemetrygen 应用,请运行以下命令:

    kubectl apply -f https://raw.githubusercontent.com/GoogleCloudPlatform/otlp-k8s-ingest/refs/heads/main/sample/app.yaml
    
  2. 创建部署后,可能需要一段时间才能创建 pod 并开始运行。如需检查 pod 的状态,请运行以下命令:

    kubectl get po -n opentelemetry-demo -w
    

    如需停止监控 pod 状态,请输入 Ctrl-C 以停止该命令。

使用 Metrics Explorer 查询指标

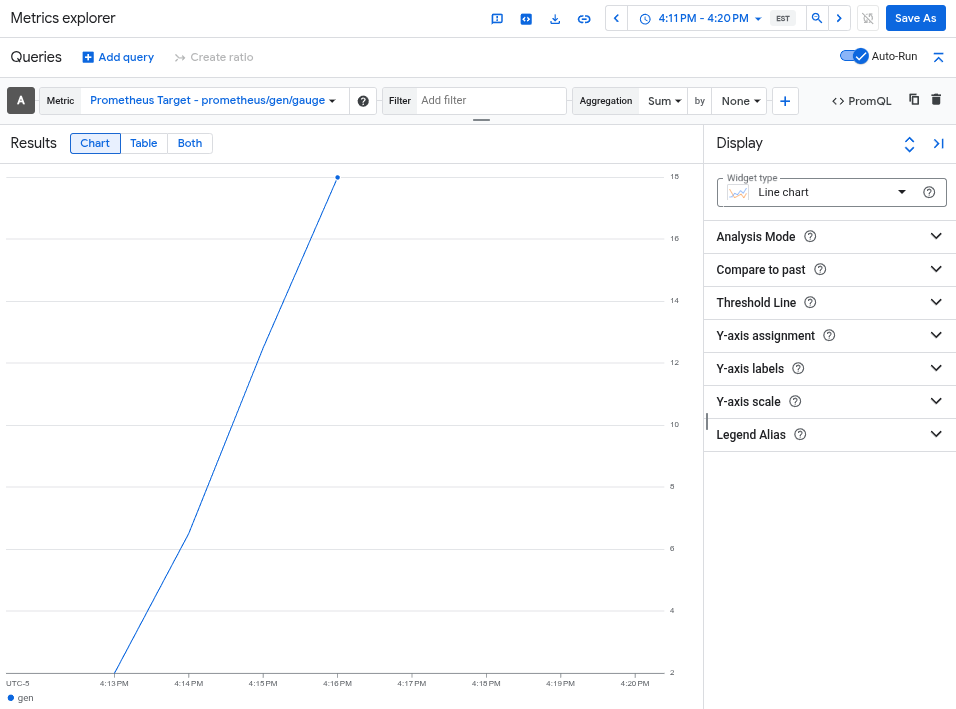
telemetrygen 工具会写入名为 gen 的指标。您可以在 Metrics Explorer 中通过查询构建器界面和 PromQL 查询编辑器查询此指标。

在 Google Cloud 控制台中,前往 Metrics Explorer 页面:

进入 Metrics Explorer

如果您使用搜索栏查找此页面,请选择子标题为监控的结果。

  • 如果您使用 Metrics Explorer 查询构建器界面,则指标的全称为 prometheus.googleapis.com/gen/gauge
  • 如果您使用 PromQL 查询编辑器,则可以使用名称 gen 查询该指标。

下图显示了 Metrics Explorer 中的 gen 指标图表:

图表显示了由 otlphttp 导出器捕获的 gen 指标。

删除集群

通过查询指标验证部署后,您可以删除集群。如需删除集群,请运行以下命令:

gcloud container clusters delete --location CLUSTER_LOCATION otlp-test --project PROJECT_ID

后续步骤