
En este documento, se describe cómo implementar el recopilador de OpenTelemetry, configurarlo para que use el exportador de otlphttp y la API de Telemetry (OTLP), y ejecutar un generador de telemetría para escribir métricas en Cloud Monitoring. Luego, puedes ver estas métricas en Cloud Monitoring.
Si usas Google Kubernetes Engine, puedes seguir OpenTelemetry administrado para GKE en lugar de implementar y configurar manualmente un recopilador de OpenTelemetry que use la API de Telemetry.
Si usas un SDK para enviar métricas de una aplicación directamente a la API de Telemetry, consulta Usa SDKs para enviar métricas de aplicaciones para obtener más información y ejemplos.
También puedes usar un recopilador de OpenTelemetry y la API de Telemetry junto con la instrumentación sin código de OpenTelemetry. Para obtener más información, consulta Cómo usar la instrumentación sin código de OpenTelemetry para Java.
Antes de comenzar
En esta sección, se describe cómo configurar tu entorno para implementar y usar el recopilador.
Selecciona o crea un proyecto de Google Cloud
Elige un Google Cloud proyecto para este recorrido. Si aún no tienes un proyecto Google Cloud , crea uno:
- Accede a tu cuenta de Google Cloud . Si eres nuevo en Google Cloud, crea una cuenta para evaluar el rendimiento de nuestros productos en situaciones reales. Los clientes nuevos también obtienen $300 en créditos gratuitos para ejecutar, probar y, además, implementar cargas de trabajo.
-
In the Google Cloud console, on the project selector page, select or create a Google Cloud project.
Roles required to select or create a project
- Select a project: Selecting a project doesn't require a specific IAM role—you can select any project that you've been granted a role on.
-
Create a project: To create a project, you need the Project Creator role
(
roles/resourcemanager.projectCreator), which contains theresourcemanager.projects.createpermission. Learn how to grant roles.
-
Verify that billing is enabled for your Google Cloud project.
-
In the Google Cloud console, on the project selector page, select or create a Google Cloud project.
Roles required to select or create a project
- Select a project: Selecting a project doesn't require a specific IAM role—you can select any project that you've been granted a role on.
-
Create a project: To create a project, you need the Project Creator role
(
roles/resourcemanager.projectCreator), which contains theresourcemanager.projects.createpermission. Learn how to grant roles.
-
Verify that billing is enabled for your Google Cloud project.
Instala herramientas de línea de comandos
En este documento, se usan las siguientes herramientas de línea de comandos:
gcloudkubectl
Las herramientas gcloud y kubectl forman parte de la CLI de Google Cloud. Para obtener información sobre cómo instalarlos, consulta Administra los componentes de Google Cloud CLI. Para ver los componentes de gcloud CLI que instalaste, ejecuta el siguiente comando:
gcloud components list
Para configurar gcloud CLI para su uso, ejecuta los siguientes comandos:
gcloud auth login
gcloud config set project PROJECT_ID
Habilita las APIs
Habilita la API de Cloud Monitoring y la API de Telemetry en tuGoogle Cloud proyecto. Presta especial atención a la API de Telemetry, telemetry.googleapis.com, ya que es posible que esta sea la primera vez que te encuentras con ella.
Para habilitar las APIs, ejecuta los siguientes comandos:
gcloud services enable monitoring.googleapis.com
gcloud services enable telemetry.googleapis.com
Crea un clúster
Crear un clúster de GKE
Ejecuta el siguiente comando para crear un clúster de Google Kubernetes Engine llamado
otlp-test:gcloud container clusters create-auto --location CLUSTER_LOCATION otlp-test --project PROJECT_IDDespués de crear el clúster, conéctate a él ejecutando el siguiente comando:
gcloud container clusters get-credentials otlp-test --region CLUSTER_LOCATION --project PROJECT_ID
Autoriza la cuenta de servicio de Kubernetes
Los siguientes comandos otorgan los roles de Identity and Access Management (IAM) necesarios a la cuenta de servicio de Kubernetes. En estos comandos, se supone que usas la federación de identidades para cargas de trabajo para GKE:
export PROJECT_NUMBER=$(gcloud projects describe PROJECT_ID --format="value(projectNumber)")

gcloud projects add-iam-policy-binding projects/PROJECT_ID \
  --role=roles/logging.logWriter \
  --member=principal://iam.googleapis.com/projects/$PROJECT_NUMBER/locations/global/workloadIdentityPools/PROJECT_ID.svc.id.goog/subject/ns/opentelemetry/sa/opentelemetry-collector \
  --condition=None

gcloud projects add-iam-policy-binding projects/PROJECT_ID \
  --role=roles/monitoring.metricWriter \
  --member=principal://iam.googleapis.com/projects/$PROJECT_NUMBER/locations/global/workloadIdentityPools/PROJECT_ID.svc.id.goog/subject/ns/opentelemetry/sa/opentelemetry-collector \
  --condition=None

gcloud projects add-iam-policy-binding projects/PROJECT_ID \
  --role=roles/telemetry.tracesWriter \
  --member=principal://iam.googleapis.com/projects/$PROJECT_NUMBER/locations/global/workloadIdentityPools/PROJECT_ID.svc.id.goog/subject/ns/opentelemetry/sa/opentelemetry-collector \
  --condition=None
Si tu cuenta de servicio tiene un formato diferente, puedes usar el comando de la documentación de Google Cloud Managed Service para Prometheus para autorizar la cuenta de servicio con los siguientes cambios:
- Reemplaza el nombre de la cuenta de servicio
gmp-test-sapor tu cuenta de servicio. - Otorga los roles que se muestran en el conjunto anterior de comandos, no solo el rol
roles/monitoring.metricWriter.
Implementa el recopilador de OpenTelemetry
Para crear la configuración del recopilador, haz una copia del siguiente archivo YAML y colócalo en un archivo llamado collector.yaml. También puedes encontrar la siguiente configuración en GitHub en el repositorio otlp-k8s-ingest.
En tu copia, asegúrate de reemplazar la ocurrencia de ${GOOGLE_CLOUD_PROJECT} por el ID de tu proyecto, PROJECT_ID.
OTLP para las métricas de Prometheus solo funciona cuando se usa la versión 0.140.0 o posterior del recopilador de OpenTelemetry.
Configura el recopilador de OpenTelemetry implementado
Configura la implementación del recopilador creando recursos de Kubernetes.
Ejecuta los siguientes comandos para crear el espacio de nombres
opentelemetryy la configuración del recopilador en el espacio de nombres:kubectl create namespace opentelemetry kubectl create configmap collector-config -n opentelemetry --from-file=collector.yamlConfigura el recopilador con recursos de Kubernetes ejecutando los siguientes comandos:
kubectl apply -f https://raw.githubusercontent.com/GoogleCloudPlatform/otlp-k8s-ingest/refs/heads/otlpmetric/k8s/base/2_rbac.yaml

kubectl apply -f https://raw.githubusercontent.com/GoogleCloudPlatform/otlp-k8s-ingest/refs/heads/otlpmetric/k8s/base/3_service.yaml

kubectl apply -f https://raw.githubusercontent.com/GoogleCloudPlatform/otlp-k8s-ingest/refs/heads/otlpmetric/k8s/base/4_deployment.yaml

kubectl apply -f https://raw.githubusercontent.com/GoogleCloudPlatform/otlp-k8s-ingest/refs/heads/otlpmetric/k8s/base/5_hpa.yaml
Espera a que los Pods del recopilador alcancen el estado "Running" y tengan 1/1 contenedores listos. Esto tarda alrededor de tres minutos en Autopilot, si es la primera carga de trabajo implementada. Para verificar los pods, usa el siguiente comando:
kubectl get po -n opentelemetry -wPara dejar de observar el estado del pod, presiona Ctrl+C para detener el comando.
También puedes consultar los registros del recopilador para asegurarte de que no haya errores evidentes:
kubectl logs -n opentelemetry deployment/opentelemetry-collector
Implementa el generador de telemetría
Puedes probar tu configuración con la herramienta telemetrygen de código abierto. Esta app genera datos de telemetría y los envía al recopilador.
Para implementar la app de
telemetrygenen el espacio de nombresopentelemetry-demo, ejecuta el siguiente comando:kubectl apply -f https://raw.githubusercontent.com/GoogleCloudPlatform/otlp-k8s-ingest/refs/heads/main/sample/app.yamlDespués de crear la implementación, es posible que los pods tarden un tiempo en crearse y comenzar a ejecutarse. Para verificar el estado de los pods, ejecuta el siguiente comando:
kubectl get po -n opentelemetry-demo -wPara dejar de observar el estado del pod, presiona Ctrl+C para detener el comando.
Consulta una métrica con el Explorador de métricas
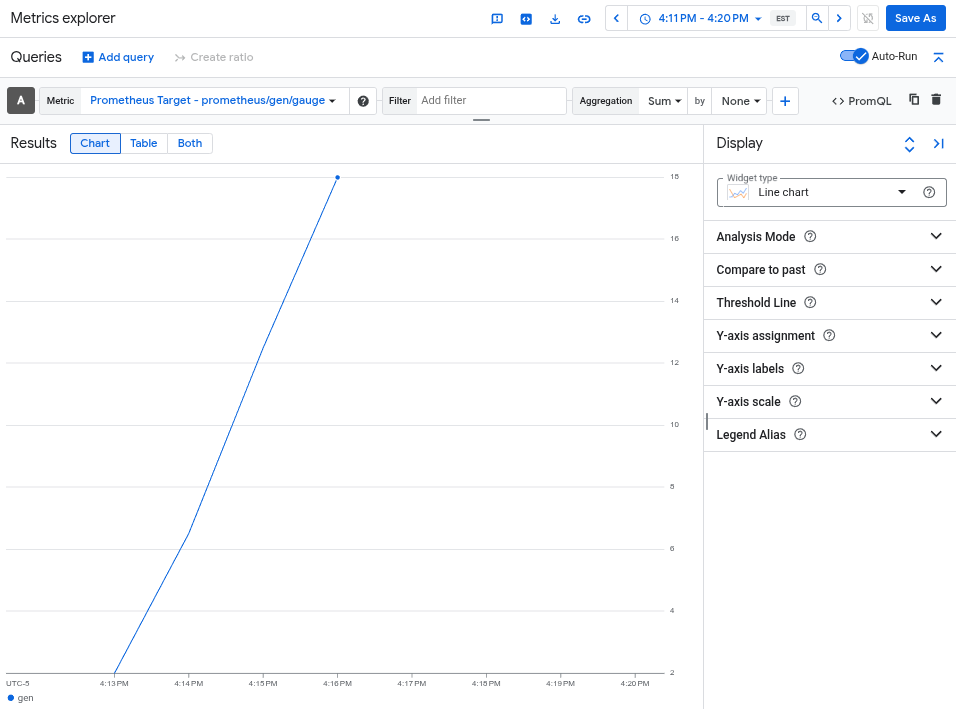
La herramienta telemetrygen escribe en una métrica llamada gen. Puedes consultar esta métrica desde la interfaz del compilador de consultas y el editor de consultas de PromQL en el Explorador de métricas.
En la consola de Google Cloud , accede a la página leaderboard Explorador de métricas:
Acceder al Explorador de métricas
Si usas la barra de búsqueda para encontrar esta página, selecciona el resultado cuyo subtítulo es Monitoring.
- Si usas la interfaz del compilador de consultas del Explorador de métricas, el nombre completo de la métrica es
prometheus.googleapis.com/gen/gauge. - Si usas el editor de consultas de PromQL, puedes consultar la métrica con el nombre
gen.
En la siguiente imagen, se muestra un gráfico de la métrica gen en el Explorador de métricas:
Borra el clúster
Después de verificar la implementación consultando la métrica, puedes borrar el clúster. Para borrar el clúster, ejecuta el siguiente comando:
gcloud container clusters delete --location CLUSTER_LOCATION otlp-test --project PROJECT_ID
Usa otros recopiladores basados en OpenTelemetry
Es posible que puedas usar otros recopiladores basados en OpenTelemetry para enviar métricas de OTLP a la API de Telemetry, aunque Google Cloud no brinda asistencia al cliente para los recopiladores no estándar basados en OpenTelemetry.
Por ejemplo, puedes enviar métricas con la versión 1.16.0 o posterior de Grafana Alloy autenticándote con el componente otelcol.auth.google y configurándolo de manera similar a un recopilador estándar de OpenTelemetry siguiendo las instrucciones de este documento.
¿Qué sigue?
- Si deseas obtener información para usar un recopilador de OpenTelemetry y la API de Telemetry con la instrumentación sin código de OpenTelemetry, consulta Usa la instrumentación sin código de OpenTelemetry para Java.
- Para obtener información sobre cómo enviar métricas desde aplicaciones que usan SDKs, consulta Usa SDKs para enviar métricas desde aplicaciones.
- Para obtener información sobre cómo migrar al exportador de
otlphttpdesde otro exportador, consulta Migra al exportador de OTLP. - Para obtener más información sobre la API de Telemetry, consulta la descripción general de la API de Telemetry (OTLP).