
In diesem Dokument wird beschrieben, wie Sie den OpenTelemetry Collector bereitstellen,
den Collector für die Verwendung des otlphttp Exporters und der
Telemetry API (OTLP) konfigurieren und einen Telemetriegenerator
ausführen, um Messwerte in Cloud Monitoring zu schreiben. Sie können diese Messwerte dann in Cloud Monitoring aufrufen.
Wenn Sie Google Kubernetes Engine verwenden, können Sie Managed OpenTelemetry for GKEverwenden, anstatt einen OpenTelemetry Collector, der die Telemetry API verwendet, manuell bereitzustellen und zu konfigurieren.
Wenn Sie ein SDK verwenden, um Messwerte direkt aus einer Anwendung an die Telemetry API zu senden, finden Sie weitere Informationen und Beispiele unter SDKs zum Senden von Messwerten aus Anwendungen verwenden für zusätzliche Informationen und Beispiele.
Sie können einen OpenTelemetry Collector und die Telemetry API auch in Verbindung mit der OpenTelemetry-Instrumentierung ohne Code verwenden. Weitere Informationen finden Sie unter OpenTelemetry-Instrumentierung ohne Code für Java verwenden.
Hinweis
In diesem Abschnitt wird beschrieben, wie Sie Ihre Umgebung für die Bereitstellung und Verwendung des Collectors einrichten.
Projekt auswählen oder erstellen Google Cloud
Wählen Sie ein Google Cloud Projekt für diese Anleitung aus. Wenn Sie noch kein Projekt haben, erstellen Sie eines: Google Cloud
- Melden Sie sich in Ihrem Google Cloud Konto an. Wenn Sie noch kein Konto haben Google Cloud, erstellen Sie ein Konto, um zu testen, wie sich unsere Produkte in realen Szenarien schlagen. Neukunden erhalten außerdem ein Guthaben von 300 $, um Arbeitslasten auszuführen, zu testen und bereitzustellen.
-
In the Google Cloud console, on the project selector page, select or create a Google Cloud project.
Roles required to select or create a project
- Select a project: Selecting a project doesn't require a specific IAM role—you can select any project that you've been granted a role on.
-
Create a project: To create a project, you need the Project Creator role
(
roles/resourcemanager.projectCreator), which contains theresourcemanager.projects.createpermission. Learn how to grant roles.
-
Verify that billing is enabled for your Google Cloud project.
-
In the Google Cloud console, on the project selector page, select or create a Google Cloud project.
Roles required to select or create a project
- Select a project: Selecting a project doesn't require a specific IAM role—you can select any project that you've been granted a role on.
-
Create a project: To create a project, you need the Project Creator role
(
roles/resourcemanager.projectCreator), which contains theresourcemanager.projects.createpermission. Learn how to grant roles.
-
Verify that billing is enabled for your Google Cloud project.
Befehlszeilentools installieren
In diesem Dokument werden die folgenden Befehlszeilentools verwendet:
gcloudkubectl
Die Tools gcloud und kubectl sind Teil der Google Cloud CLI. Informationen zur Installation finden Sie unter
Komponenten der Google Cloud CLI verwalten. Führen Sie den folgenden Befehl aus, um die installierten gcloud CLI-Komponenten aufzurufen:
gcloud components list
Führen Sie die folgenden Befehle aus, um die gcloud CLI zu konfigurieren:
gcloud auth login
gcloud config set project PROJECT_ID
APIs aktivieren
Aktivieren Sie die Cloud Monitoring API und die Telemetry API in Ihrem
Google Cloud Projekt. Achten Sie besonders auf die
Telemetry API, telemetry.googleapis.com. Möglicherweise verwenden Sie diese API zum ersten Mal.
Aktivieren Sie die APIs mit den folgenden Befehlen:
gcloud services enable monitoring.googleapis.com
gcloud services enable telemetry.googleapis.com
Cluster erstellen
GKE-Cluster erstellen
Erstellen Sie mit dem folgenden Befehl einen Google Kubernetes Engine-Cluster mit dem Namen
otlp-test:gcloud container clusters create-auto --location CLUSTER_LOCATION otlp-test --project PROJECT_IDNachdem der Cluster erstellt wurde, stellen Sie mit dem folgenden Befehl eine Verbindung zu ihm her:
gcloud container clusters get-credentials otlp-test --region CLUSTER_LOCATION --project PROJECT_ID
Kubernetes-Dienstkonto autorisieren
Mit den folgenden Befehlen werden dem Kubernetes-Dienstkonto die erforderlichen IAM-Rollen (Identity and Access Management) zugewiesen. Bei diesen Befehlen wird davon ausgegangen, dass Sie Workload Identity Federation for GKE verwenden:
export PROJECT_NUMBER=$(gcloud projects describe PROJECT_ID --format="value(projectNumber)")

gcloud projects add-iam-policy-binding projects/PROJECT_ID \
  --role=roles/logging.logWriter \
  --member=principal://iam.googleapis.com/projects/$PROJECT_NUMBER/locations/global/workloadIdentityPools/PROJECT_ID.svc.id.goog/subject/ns/opentelemetry/sa/opentelemetry-collector \
  --condition=None

gcloud projects add-iam-policy-binding projects/PROJECT_ID \
  --role=roles/monitoring.metricWriter \
  --member=principal://iam.googleapis.com/projects/$PROJECT_NUMBER/locations/global/workloadIdentityPools/PROJECT_ID.svc.id.goog/subject/ns/opentelemetry/sa/opentelemetry-collector \
  --condition=None

gcloud projects add-iam-policy-binding projects/PROJECT_ID \
  --role=roles/telemetry.tracesWriter \
  --member=principal://iam.googleapis.com/projects/$PROJECT_NUMBER/locations/global/workloadIdentityPools/PROJECT_ID.svc.id.goog/subject/ns/opentelemetry/sa/opentelemetry-collector \
  --condition=None
Wenn Ihr Dienstkonto ein anderes Format hat, können Sie den Befehl in der Dokumentation zu Google Cloud Managed Service for Prometheus verwenden, um das Dienstkonto zu autorisieren. Nehmen Sie dazu die folgenden Änderungen vor:
- Ersetzen Sie den Dienstkontonamen
gmp-test-sadurch Ihr Dienstkonto. - Weisen Sie die in den vorherigen Befehlen gezeigten Rollen zu, nicht nur die Rolle
roles/monitoring.metricWriter.
OpenTelemetry Collector bereitstellen
Erstellen Sie die Collector-Konfiguration, indem Sie eine Kopie der folgenden YAML-Datei erstellen und sie in einer Datei mit dem Namen collector.yaml platzieren. Sie finden die folgende Konfiguration auch auf GitHub im otlp-k8s-ingest
Repository.
Ersetzen Sie in Ihrer Kopie unbedingt ${GOOGLE_CLOUD_PROJECT}
durch Ihre Projekt-ID, PROJECT_ID.
OTLP für Prometheus-Messwerte funktioniert nur mit OpenTelemetry Collector Version 0.140.0 oder höher.
Bereitgestellten OpenTelemetry Collector konfigurieren
Konfigurieren Sie die Collector-Bereitstellung, indem Sie Kubernetes-Ressourcen erstellen.
Erstellen Sie den Namespace
opentelemetryund erstellen Sie die Collector-Konfiguration im Namespace, indem Sie die folgenden Befehle ausführen:kubectl create namespace opentelemetry kubectl create configmap collector-config -n opentelemetry --from-file=collector.yamlKonfigurieren Sie den Collector mit Kubernetes-Ressourcen, indem Sie die folgenden Befehle ausführen:
kubectl apply -f https://raw.githubusercontent.com/GoogleCloudPlatform/otlp-k8s-ingest/refs/heads/otlpmetric/k8s/base/2_rbac.yaml

kubectl apply -f https://raw.githubusercontent.com/GoogleCloudPlatform/otlp-k8s-ingest/refs/heads/otlpmetric/k8s/base/3_service.yaml

kubectl apply -f https://raw.githubusercontent.com/GoogleCloudPlatform/otlp-k8s-ingest/refs/heads/otlpmetric/k8s/base/4_deployment.yaml

kubectl apply -f https://raw.githubusercontent.com/GoogleCloudPlatform/otlp-k8s-ingest/refs/heads/otlpmetric/k8s/base/5_hpa.yaml
Warten Sie, bis die Collector-Pods den Status „Running“ erreicht haben und 1/1 Container bereit sind. Das dauert bei Autopilot etwa drei Minuten, wenn dies die erste bereitgestellte Arbeitslast ist. Verwenden Sie den folgenden Befehl, um die Pods zu prüfen:
kubectl get po -n opentelemetry -wGeben Sie Strg + C ein, um den Befehl zu beenden und den Pod-Status nicht mehr zu beobachten.
Sie können auch die Collector-Logs prüfen, um sicherzugehen, dass keine offensichtlichen Fehler vorliegen:
kubectl logs -n opentelemetry deployment/opentelemetry-collector
Telemetriegenerator bereitstellen
Sie können Ihre Konfiguration mit dem Open-Source
telemetrygen Tool testen. Diese App generiert Telemetriedaten und sendet sie an den Collector.
Führen Sie den folgenden Befehl aus, um die App
telemetrygenim Namespaceopentelemetry-demobereitzustellen:kubectl apply -f https://raw.githubusercontent.com/GoogleCloudPlatform/otlp-k8s-ingest/refs/heads/main/sample/app.yamlNachdem Sie die Bereitstellung erstellt haben, kann es einige Zeit dauern, bis die Pods erstellt und ausgeführt werden. Führen Sie den folgenden Befehl aus, um den Status der Pods zu prüfen:
kubectl get po -n opentelemetry-demo -wGeben Sie Strg + C ein, um den Befehl zu beenden und den Pod-Status nicht mehr zu beobachten.
Messwert mit dem Metrics Explorer abfragen
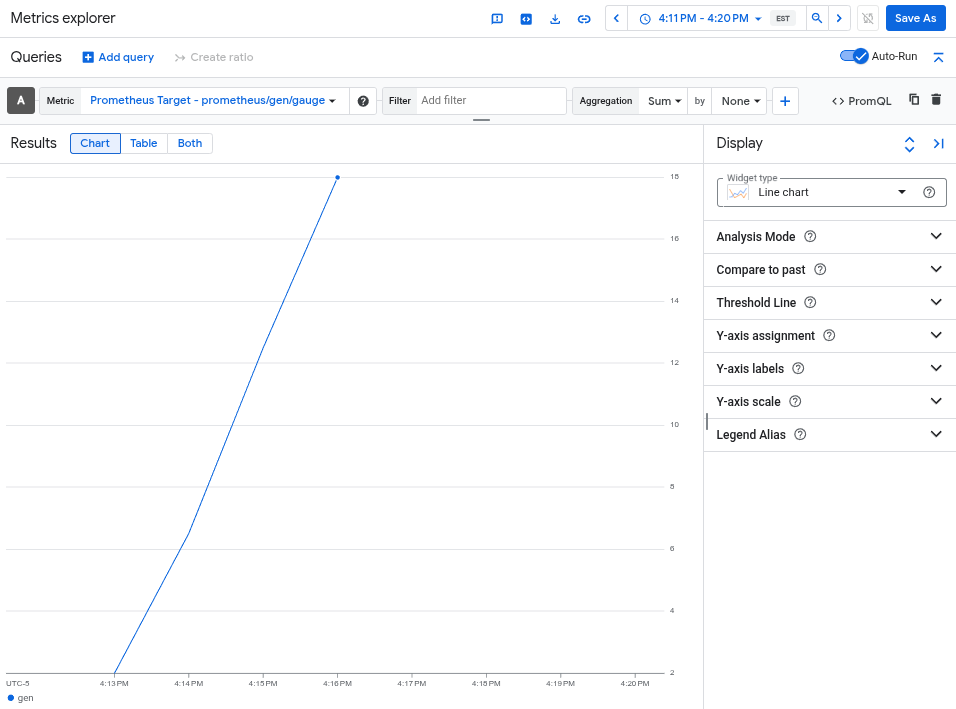
Das telemetrygen Tool schreibt in einen Messwert mit dem Namen gen. Sie können diesen Messwert sowohl über die Abfrageerstellungsoberfläche als auch über den PromQL-Abfrageeditor im Metrics Explorer abfragen.
Rufen Sie in der Google Cloud Console das leaderboard Metrics Explorer auf:
Wenn Sie diese Seite über die Suchleiste suchen, wählen Sie das Ergebnis aus, dessen Zwischenüberschrift Monitoring ist.
- Wenn Sie die Abfrageerstellungsoberfläche des Metrics Explorer verwenden, lautet der vollständige Name des Messwerts
prometheus.googleapis.com/gen/gauge. - Wenn Sie den PromQL-Abfrageeditor verwenden, können Sie den Messwert mit dem Namen
genabfragen.
Die folgende Abbildung zeigt ein Diagramm des Messwerts gen im Metrics Explorer:
Cluster löschen
Nachdem Sie Ihre Bereitstellung durch Abfragen des Messwerts überprüft haben, können Sie den Cluster löschen. Führen Sie den folgenden Befehl aus, um den Cluster zu löschen:
gcloud container clusters delete --location CLUSTER_LOCATION otlp-test --project PROJECT_ID
Andere OpenTelemetry-basierte Collectors verwenden
Möglicherweise können Sie andere OpenTelemetry-basierte Collectors verwenden, um OTLP Messwerte an die Telemetry API zu senden. bietet jedoch keinen Kundensupport für nicht standardmäßige OpenTelemetry-basierte Collectors. Google Cloud
Sie können beispielsweise Messwerte mit
Grafana Alloy Version 1.16.0 oder
höher senden, indem Sie sich mit der otelcol.auth.google
Komponente
authentifizieren und sie ähnlich wie einen Standard-OpenTelemetry Collector
konfigurieren. Folgen Sie dazu der Anleitung in diesem Dokument.
Nächste Schritte
- Informationen zur Verwendung eines OpenTelemetry Collectors und der Telemetry API mit der OpenTelemetry-Instrumentierung ohne Code finden Sie unter OpenTelemetry-Instrumentierung ohne Code für Java verwenden.
- Informationen zum Senden von Messwerten aus Anwendungen, die SDKs verwenden, finden Sie unter SDKs zum Senden von Messwerten aus Anwendungen verwenden.
- Informationen zur Migration zu
otlphttp-Exporter von einem anderen Exporter finden Sie unter Zum OTLP-Exporter migrieren. - Weitere Informationen zur Telemetry API finden Sie unter Übersicht über die Telemetry API (OTLP).