

If you write applications, then you can instrument your code to generate telemetry and gain deep observability into your application's internal runtime behavior. This page introduces in-process instrumentation concepts, explains the benefits of vendor-neutral frameworks like OpenTelemetry, and directs you to language-specific guides and code samples for Google Cloud Observability.
What are instrumentation and observability?
Instrumentation refers to the specific code that generates or collects data about your application's runtime behavior. Inside your application, instrumentation, such as that provided by OpenTelemetry, can collect domain-specific information about the language runtime, framework, or application logic, and then send that data to a Google Cloud project or to some other destination. This data, which is also known as telemetry, includes logs, metrics, and traces.
System-level metrics such as CPU usage, memory usage, and disk usage are valuable for detecting problems with your application, but they don't provide much insight into application-level concerns. Instrumentation can help your application generate the data that you need to diagnose the root cause of a problem, because the resulting telemetry shows you what is happening inside your application. For example, logs often include context about your program such as a specific error message or stacktrace, and the location in your source code. Similarly, distributed traces help you understand how multiple services interact when processing requests. Metrics let you determine when your application isn't behaving correctly.
Instrumenting your application involves generating telemetry and sending it to a system where data can be stored and queried. For example, your instrumentation might send telemetry to a Google Cloud project. Services in Google Cloud Observability help you collect, analyze, and correlate telemetry data. They also provide built-in defaults to help you get started faster, such as default dashboards and alerting policies. For more information about Google Cloud Observability, see Observability in Google Cloud.
The following figure illustrates how an application uses instrumentation to generate and send telemetry to a storage system:
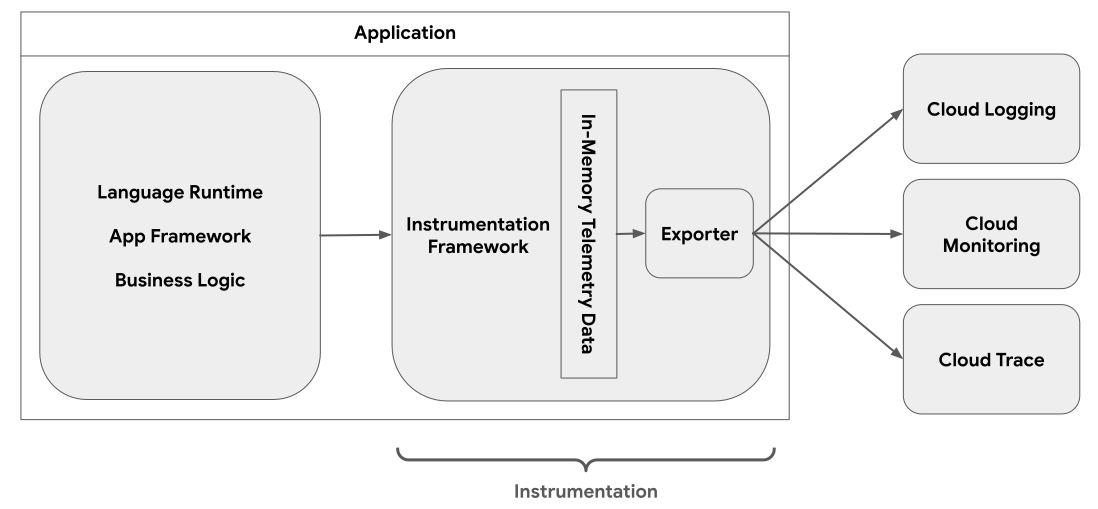
As illustrated in the previous figure, the instrumentation code exists within your application's process and interacts with the application to generate telemetry data. The instrumentation framework then exports your telemetry to a configured storage system. In the figure, the storage system is your Google Cloud project.
Why you should use vendor-neutral instrumentation frameworks
Even if you plan to send telemetry only to Google Cloud, we recommend that you use a vendor-neutral open source instrumentation framework to instrument your applications. These types of frameworks have some key benefits:
- No vendor lock-in
- Vendor-neutral frameworks aren't tied to any particular vendor and they provide their own data model for the generated telemetry. Therefore, you can send data to multiple vendors, and you usually can change which vendor you use without modifying your code.
- Standardized procedures for collecting telemetry
- Well-designed frameworks, such as OpenTelemetry, provide a standardized approach to collecting telemetry from applications. You can use the same framework for applications written in supported languages. And because the framework is standardized, you can collect and compare the telemetry from all your services.
- Interoperable libraries
- Instrumentation frameworks include a rich ecosystem of libraries that gather telemetry signals, and these libraries are interoperable. For example, OpenTelemetry provides libraries to collect trace data and to collect metric data. You can use either library, or both libraries.
Determine your instrumentation strategy
- Choose an instrumentation approach provides instrumentation recommendations based on your Google Cloud compute platform and telemetry requirements.
- What is OpenTelemetry? describes the mission and goals of OpenTelemetry.
- Observability in Google Cloud provides general information.
Samples and implementation guides
Sample overview describes the architecture and required Identity and Access Management roles for the following collector-based code samples:
Migrate from the Trace exporter to the OTLP endpoint describes how to update an application that uses direct export to send OTLP-formatted trace data.
Use OpenTelemetry zero-code instrumentation for Java workloads on GKE describes how to collect telemetry without modifying your Java application.