

This document describes how to access and view traces and spans generated by your Gemini Enterprise app. Traces and spans provide detailed insights into the performance and execution flow of requests within your application, such as when using the assistant or agents.
You can view trace data using either the Trace Explorer or directly within individual agents using the agent's Traces tab.
Key concepts
This section introduces key concepts related to observability in Gemini Enterprise.
| Concept | Description |
|---|---|
| Trace |
A trace is a collection of spans that represents a single request or
transaction as it flows through different services and components.
For example, a trace represents the entire lifecycle of a request. This includes a user asking a question from the Gemini Enterprise assistant, the Gemini Enterprise assistant responding, and any subsequent actions triggered by the answer, such as sending an email. |
| Span | A span is a single, timed unit of work within a trace. It represents a specific operation, such as a function call, an API request, or a database query. Each span includes details like its start and end times, a unique ID, and its relationship to other spans. These relationships together form a trace. |
| Span logs | Span logs are timestamped, free-form messages or events associated with a specific span. They provide detailed, contextual information about a span's execution, helping users debug issues and understand the flow of a request. |
Before you begin
Make sure you have the following:
The Gemini Enterprise Admin role or Google Cloud console Gemini Enterprise User role.
An existing Gemini Enterprise web app. For information about creating a new app, see Create an app.
To access traces, you must have the Cloud Trace User role (
roles/cloudtrace.user).Enable the Enable instrumentation of OpenTelemetry traces and logs observability setting. Depending on the agent type, you enable this in the app-level configurations (for the Core Assistant agent) or inside the agent's Configuration tab (for Workflow Builder employee-made agents and Deep Research agents). For more information, see Manage observability settings.
Data retention
Traces and spans generated by your Gemini Enterprise app are stored in Cloud Trace in your Google Cloud project, and their retention is governed by Cloud Trace. By default, Cloud Trace retains span data for 30 days; data older than the retention period is automatically deleted. For the authoritative and most current retention values, see Cloud Trace retention periods in the Cloud Trace quotas and limits documentation.
Access traces in Trace Explorer
To access traces and spans using the Trace Explorer, follow these steps:
In the Google Cloud console, go to the Trace Explorer page.
Select the Google Cloud project where your Gemini Enterprise app was created. You see all the spans for your project.
In the table, click a Span ID to view the trace details, including the span's duration and other attributes.
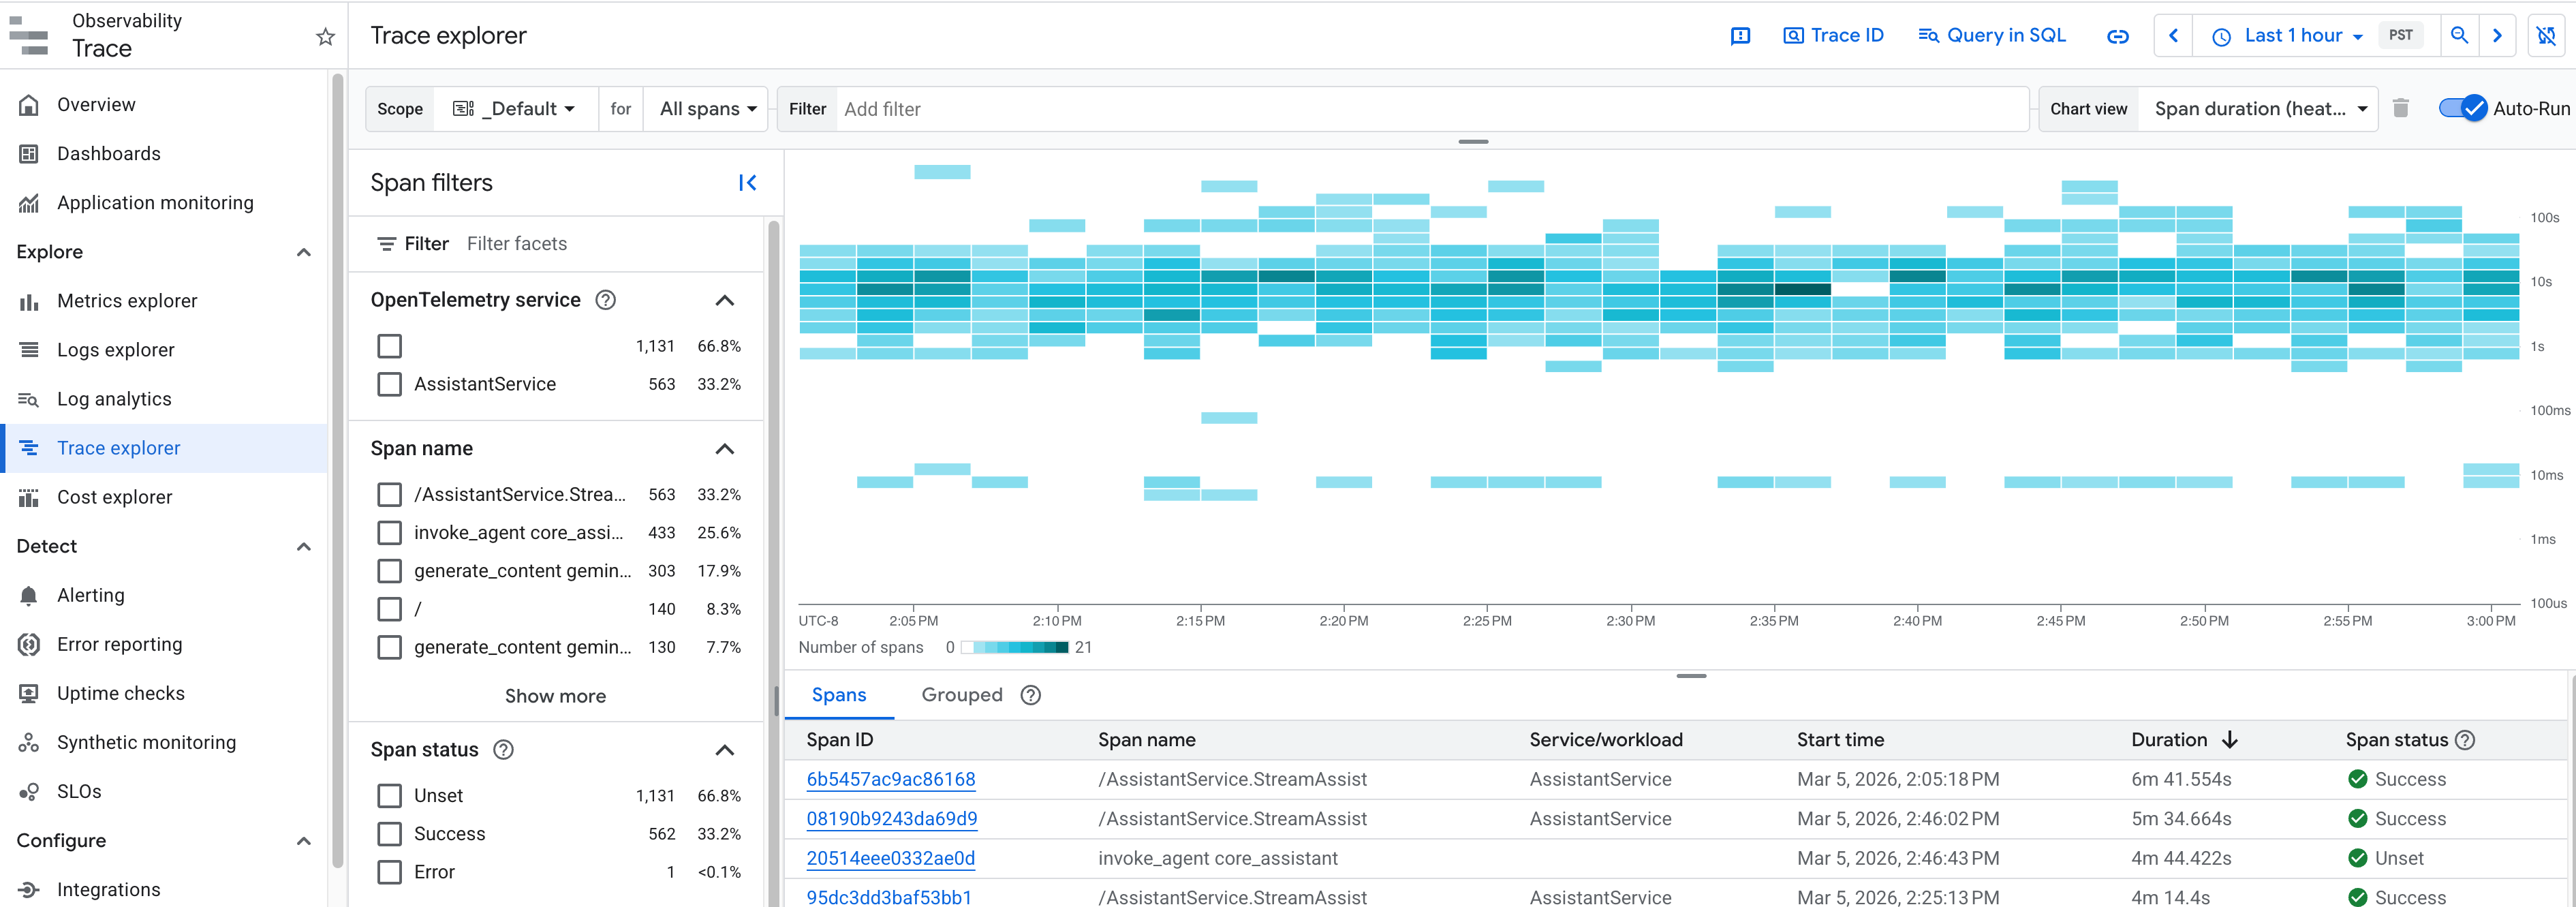
Filter and search traces
Within the Trace Explorer for your project, you can isolate and analyze Gemini Enterprise agent and data connector executions using these filters, query parameters, and attributes:
- Faceted filters:
- Service: Filter by
AssistantServiceorconnectorsexecutionto isolate the platform agent and data connector request paths. - Span: Filter by
/AssistantService.StreamAssistto locate the root user-turn spans, or search for child spans likeexecute_tool <tool_name>andinvoke_connector <connector>.
- Service: Filter by
- Direct Trace ID Lookup: Find traces directly using the standard
32-character W3C trace ID, which can be extracted from the
x-cloud-trace-contextresponse headers fromStreamAssist. - Custom attributes: Query by the
gemini_enterprise.assist_tokenattribute onexecute_toolorinvoke_connectorspans to map turn-level legacy assist tokens to the W3C trace waterfall. - Resource attributes: Every exported span carries
cloud.region, the - Resource attributes: Every exported span carries the
cloud.regionattribute. This attribute represents the Gemini Enterprise serving location that handled the request, such asglobal,us, oreu. You can filter by this attribute to compare performance across regions. This comparison is useful when a data connector succeeds in one location but fails in another. This value represents the location serving your app, not the region hosting the third-party data source. To apply this filter, see Apply span filters.
Access traces for agents
You can also view trace spans directly for individual agents on the agent's Traces tab, which displays a detailed chronological summary of span trace records and parent-child execution structures.
To access traces for an agent:
- In the Google Cloud console, navigate to your app, and then click Agents.
- Select the agent you want to inspect, and then click the Traces tab.
Trace summary table
The main table in the Traces tab shows the following information for each trace span:
- Status: The current status of the trace (currently displays Unset).
- Trace span ID: The unique identifier for the trace span. Click the span ID link to drill down into its details.
- Span Name: A brief description of the work the span is doing. Examples of spans for Gemini Enterprise data connectors include:
execute_tool <tool_name>: Emitted during the tool-dispatch layer in the agent runtime (for example,execute_tool federated_search).invoke_connector <connector>: Generated by the connectors execution layer to represent the request logic to the specific connector (for example,invoke_connector jiraorinvoke_connector servicenow), which replaces the default service-side RPC spans.
- Span Type: The type of span. Options include:
Agent to Tool: An invocation from the agent to an external tool (reused forexecute_toolandinvoke_connectoroperations).Invoke Agent: An invocation of an agent.Agent to Model: A request from the agent to a large language model.
- Duration: The time taken to complete the trace span (in minutes).
- Input: The input data or message sent to the span, if any.
- Output: The output result returned by the span, if any.
- Start Time: The exact timestamp when the span began execution.
Detailed trace view
Clicking a Trace span ID opens a detailed page featuring:
- Summary: View the baseline metadata including Start time, Duration, and total Spans count. You can click to View in Cloud Trace or switch between Graph and Timeline view buttons.
- Visualizations: Toggle between a graphical hierarchy or a timeline view showing parent-child relationships of all trace spans.
- Selected span details: Select a single span to display detailed sections, which can include:
- Summary: Displays the name of the span, target service, count of total spans with this action, and total duration (in seconds).
- Logs: View relevant event details if configured. Click View logs to navigate directly to standard logs.
- Evaluation: Shows any evaluation results, if configured.
- Input & Output: Complete request and response payloads.
- Logs & Events: List of events that occurred during this span execution.
- Stacktraces: Error details if a span execution fails.
- Metadata & Links: Links referencing related cloud explorer entities.
- Attributes: Resource tags and additional key-value observability parameters.
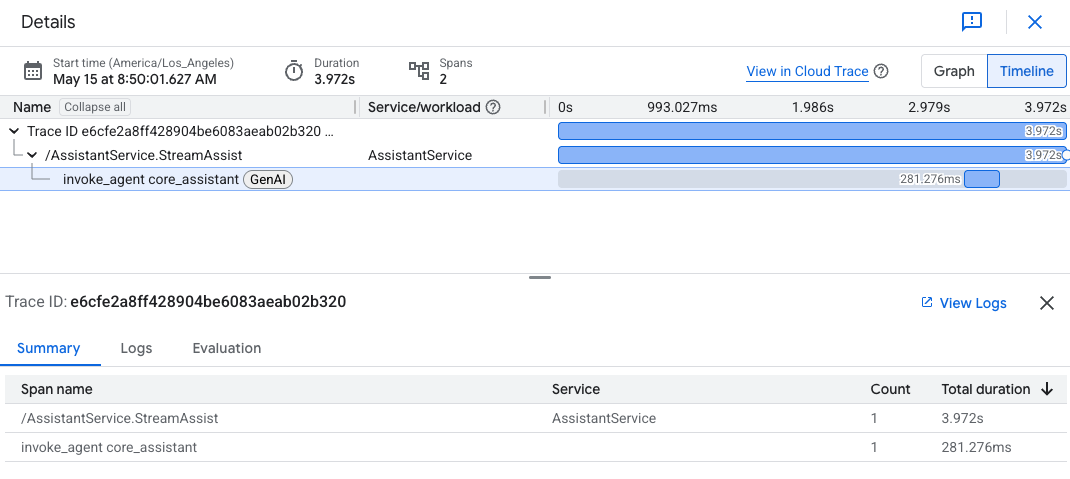
Parent-child span hierarchy
For data connectors execution, parent-child span nesting within a single W3C trace helps pinpoint exactly where latency or errors occur:
/AssistantService.StreamAssist: Root C++ platform span initiating the request.invoke_agent core_assistant: The agent execution span.execute_tool <tool_name>: The active tool execution span (for example,execute_tool federated_search).invoke_connector <connector_name>(for example,invoke_connector jiraorinvoke_connector servicenow): The connectors execution span, representing the request lifecycle to the third-party endpoint.
Experimental generative AI semantic convention telemetry
In addition to the stable telemetry, Gemini Enterprise trace spans include richer
metadata based on the
OpenTelemetry generative AI semantic conventions.
OpenTelemetry classifies these conventions as
Development status.
That status applies to early-stage specifications that can change or be removed
and shouldn't be relied on in production. Because these conventions aren't yet
stable, this Gemini Enterprise telemetry is experimental. These spans include
gen_ai.* attributes that describe agent, model, and tool activity, such as
agent and tool execution and prompt-and-response steps.
Prompt and response content in trace spans (such as prompt text and generated answers) appears only when your observability settings allow logging of prompt inputs and response outputs. Otherwise, the content is redacted or omitted. To change these settings, see Manage observability settings.