

BigQuery is Google's fully managed, petabyte-scale, low-cost analytics data warehouse. The Data Studio BigQuery connector lets you access and visualize data from your BigQuery tables, views, graphs, and custom SQL queries directly within Data Studio.
Before you begin
To access BigQuery data in Data Studio, you must provide a Google Cloud project that has an associated Google Cloud Billing account.
BigQuery is a paid analytics platform. You might incur query processing or storage costs when you access BigQuery data through Data Studio reports. For details on query and capacity pricing, see BigQuery pricing.
Required roles
To query BigQuery data in Data Studio, you need permission to read data and run query jobs. Grant the following IAM roles on your Google Cloud project or dataset:
- BigQuery Data Viewer (
roles/bigquery.dataViewer): Lets you read data and metadata from tables, views, or graphs. - BigQuery Job User (
roles/bigquery.jobUser): Lets you run query jobs in the billing project.
The roles that are required depend on the data credentials mode that you select for your data source:
- Owner's credentials (default): Only the data source owner needs these roles. Report viewers can view charts without needing their own access to BigQuery.
- Viewer's credentials: Every report viewer must have these roles to view data in the report.
- Service account credentials: Only the service account needs these roles. To configure a service account, see Set up a Google Cloud service account for Data Studio.
How to connect to BigQuery
Follow these steps to connect your BigQuery data to a Data Studio report:
Steps to connect
- Sign in to Data Studio.
- Click
 Create and then select Report.
 - The report editor opens along with the Add data to report panel.
- To create a new embedded data source, select the BigQuery connector.
- Alternative: To use an existing reusable data source, click the My data sources tab and select a data source of any type that you previously created or that has been shared with you.
- Configure access to your database by using one of the connection options.
- Click Add.
In a moment, a table that is connected to the data source appears on the report canvas.
Connection options
A BigQuery data source can fetch data from a table, view, or graph, or from a custom SQL query.
Connect to a BigQuery table, view, or graph
A BigQuery table stores data in rows and columns (fields). A BigQuery view is a virtual table defined by a SQL query that runs dynamically inside the BigQuery console or by using the BigQuery API. A BigQuery graph lets you model relationships in your data by defining nodes and edges based on existing tables.
To connect to a table, view, or graph, specify the following connection parameters:
- A BigQuery project
- A dataset
- A specific table, view, or graph. Data Studio also supports connecting to date-partitioned and multi-day tables.
Select a project
Projects organize your Google Cloud resources and determine where query costs are billed when your reports exceed BigQuery's free limits. You can query data in one project while billing costs to a different project. Learn more about Google Cloud projects.
Choose one of the following options in the connector configuration panel:
- RECENT PROJECTS: Shows projects that you opened recently in the Google Cloud console. You can also enter the project ID manually. The selected project is used for both billing and data access.
- MY PROJECTS: Shows all projects that you have access to. If a project is missing from the list, type the exact project ID into the entry field.
- SHARED PROJECTS: Shows projects shared across departments or organizations. You can designate different projects for data selection and billing execution.
Select a dataset
Datasets organize and control access for groups of tables, views, and graphs. Select a dataset from the list or search by dataset ID.
BigQuery public datasets are free sample datasets shared globally across Google. To query public data, you must choose a billing project to pay for query processing costs.
Select a table, view, or graph
You can connect a Data Studio data source to a single table, view, or graph. In the Table or Table / Graph list, select a resource or search for one by name. When a dataset contains graphs, tables and graphs display distinct icons so that you can differentiate between them.
If you select a graph, you can also select a start node in the Start Node list. The start node determines the starting point for graph traversal and affects the schema of the flattened table. Depending on the graph definition, selecting a start node might be required.
Try a public graph dataset
You can try out the BigQuery Graph connector by using the publicly available Look Ecommerce graph. To connect to this graph, follow these steps:
- Select SHARED PROJECTS.
- Select your billing project.
- Enter
bigquery-public-dataas the shared project name. - Select
thelook_ecommerceas the dataset. - Select
graphin the Table / Graph list. - Optional: Select a start node in the Start Node list.
Work with BigQuery Graph measures
When you connect to a BigQuery Graph, any measures that are defined in the graph are imported as metrics in your data source. You can use these measures in charts, calculated fields, query result variables, and controls across data sources.
Note the following when working with graph measures:
- Fixed aggregation: You can't change the aggregation type of a graph measure in Data Studio. The aggregation is determined by the graph definition in BigQuery.
- Editable properties: You can edit the data type and description of a graph measure in your Data Studio data source.
Connect to date-partitioned tables
Data Studio supports BigQuery date-partitioned tables (DATE, DATETIME, or TIMESTAMP). When you select a table partitioned by DATE, DATETIME, or TIMESTAMP, you can set the partition column as the main date filter for your charts. Using partitioned tables helps your charts render more quickly while minimizing query costs.
Learn more about connecting to BigQuery date partitioned tables.
Connect to multi-day tables (YYYYMMDD prefix)
BigQuery supports querying across multiple sharded tables where each table stores data for a single day and ends with YYYYMMDD (for example, [prefix]_YYYYMMDD).
When Data Studio encounters tables formatted with the YYYYMMDD suffix during table selection, it groups the daily tables under clean prefix names ([prefix]_YYYYMMDD). When you create a chart from a multi-day table, Data Studio automatically queries only the last 28 days of data. You can change this date window anytime by editing the Date Range properties in the chart Setup tab.
Connect to BigQuery by using a custom SQL query
The CUSTOM QUERY option lets you connect to your data by writing SQL, including queries over a BigQuery Graph. Custom query syntax follows the Standard SQL dialect. To use the legacy SQL syntax, select Use Legacy SQL.
We recommend composing and testing your query directly inside the BigQuery console first, then copying and pasting the verified SQL script into the Data Studio custom query editor box.
Override the billing project
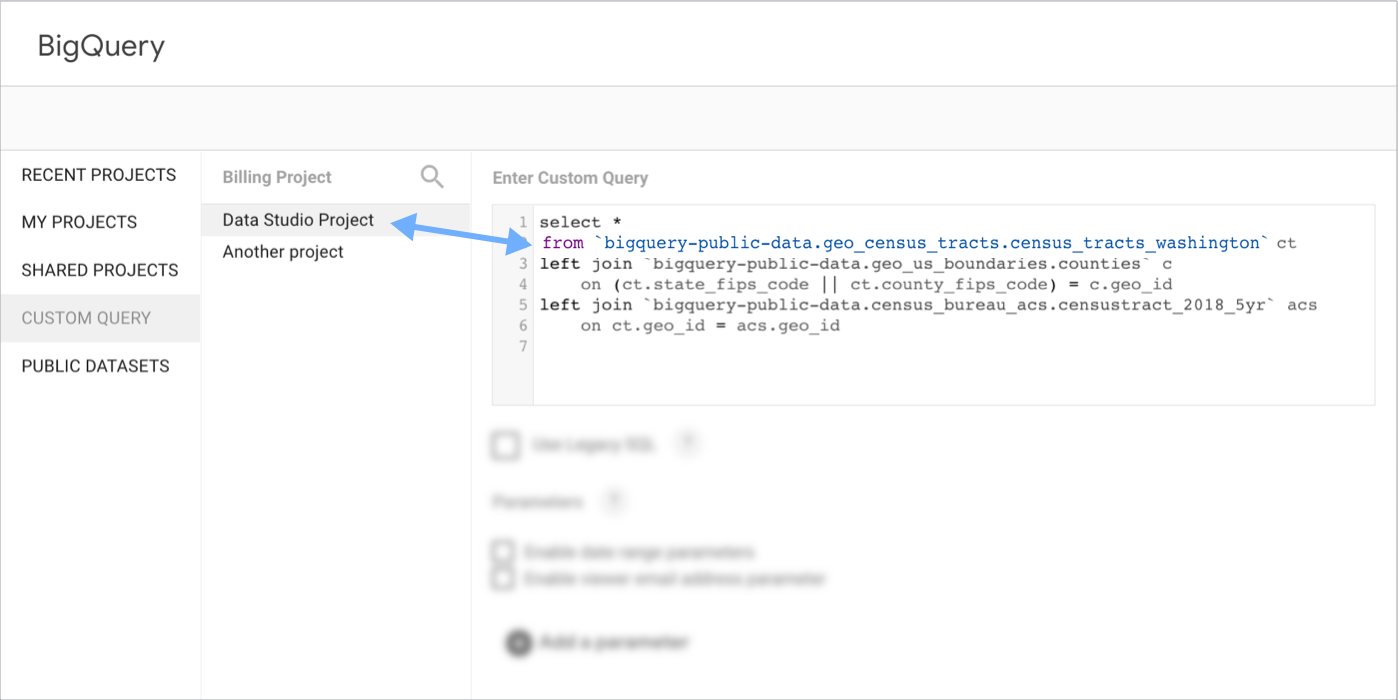
The Billing Project setting lets you specify which Google Cloud project pays for custom query execution costs. If your organization operates across many projects, you can manually enter the billing project ID in the field.
To query data inside one project while billing another, specify the billing project in this field and explicitly reference the data project inside the FROM clause of your query (FROM project_id.dataset_id.table_id).
Use query parameters
Parameters let you build more responsive, customizable reports. You can pass parameters in a BigQuery data source back to the underlying query. To use a parameter in your custom query, follow the syntax guidelines for running parameterized queries in BigQuery.
For complete setup instructions, parameter syntax rules, and row-level security configuration by using parameters (@DS_START_DATE, @DS_END_DATE, @DS_USER_EMAIL), see Use parameters in a custom query.
Notes and tips
Following are some notes and tips to help you get the most from your BigQuery data sources.
New to Data Studio?
To learn more about core reporting capabilities in Data Studio, try the following resources:
BigQuery integrations
Some Google products and external tools export data directly into BigQuery tables. When you connect Data Studio to BigQuery, Data Studio automatically calculates standard metrics and formats field names:
- Explore BigQuery data in Data Studio: Data analysts can explore BigQuery data by using Data Studio directly from within the BigQuery console. Run your query or select a table, and then select Explore in Data Studio to visualize the data in an interactive report. For more information, see Analyze data with Data Studio.
- Google Analytics BigQuery export: When Data Studio encounters a table that is generated by Google Analytics BigQuery Export, the table displays a Google Analytics icon next to it. When you connect a table, Data Studio automatically creates many of the standard metrics that are found in Google Analytics as calculated fields.
Record Count metric
Every BigQuery data source automatically includes a Record Count metric in your field list. Use Record Count inside charts to count records or verify the total rows returned by your query.
Visualize BigQuery GEOGRAPHY polygons
You can display geospatial boundaries (GEOGRAPHY polygon spatial data) from BigQuery by using Google Maps in your report. For a step-by-step tutorial using public census tract data, see Visualize BigQuery GEOGRAPHY polygons with Data Studio.
Troubleshoot errors and review limitations
If your charts fail to load or return configuration warnings, consult the Troubleshoot BigQuery connector errors and limitations guide.
Related resources
- Create a data source in Data Studio
- Identity and Access Management roles and permissions
- Google BigQuery documentation home