
This document describes how to deploy the OpenTelemetry Collector, configure
the collector to use the otlphttp exporter and the
Telemetry (OTLP) API, and run a telemetry
generator to write metrics to Cloud Monitoring. You can then view these
metrics in Cloud Monitoring.
If you are using Google Kubernetes Engine, you can follow Managed OpenTelemetry for GKE, instead of manually deploying and configuring an OpenTelemetry Collector that uses the Telemetry API.
If you are using an SDK to send metrics from an application directly to the Telemetry API, then see Use SDKs to send metrics from applications for additional information and examples.
You can also use an OpenTelemetry Collector and the Telemetry API in conjunction with OpenTelemetry zero-code instrumentation. For more information, see Use OpenTelemetry zero-code instrumentation for Java.
Before you begin
This section describes how to set up your environment for deploying and using the collector.
Select or create a Google Cloud project
Choose a Google Cloud project for this walkthrough. If you don't already have a Google Cloud project, then create one:
- Sign in to your Google Cloud account. If you're new to Google Cloud, create an account to evaluate how our products perform in real-world scenarios. New customers also get $300 in free credits to run, test, and deploy workloads.
-
In the Google Cloud console, on the project selector page, select or create a Google Cloud project.
Roles required to select or create a project
- Select a project: Selecting a project doesn't require a specific IAM role—you can select any project that you've been granted a role on.
-
Create a project: To create a project, you need the Project Creator role
(
roles/resourcemanager.projectCreator), which contains theresourcemanager.projects.createpermission. Learn how to grant roles.
-
Verify that billing is enabled for your Google Cloud project.
-
In the Google Cloud console, on the project selector page, select or create a Google Cloud project.
Roles required to select or create a project
- Select a project: Selecting a project doesn't require a specific IAM role—you can select any project that you've been granted a role on.
-
Create a project: To create a project, you need the Project Creator role
(
roles/resourcemanager.projectCreator), which contains theresourcemanager.projects.createpermission. Learn how to grant roles.
-
Verify that billing is enabled for your Google Cloud project.
Install command-line tools
This document uses following command-line tools:
gcloudkubectl
The gcloud and kubectl tools are part of the
Google Cloud CLI. For information about installing them, see
Managing Google Cloud CLI components. To see the
gcloud CLI components you have installed, run the following
command:
gcloud components list
To configure the gcloud CLI for use, run the following commands:
gcloud auth login
gcloud config set project PROJECT_ID
Enable APIs
Enable the Cloud Monitoring API and the Telemetry API in your
Google Cloud project. Pay particular attention to the
Telemetry API, telemetry.googleapis.com; this document
might be the first time you've encountered this API.
Enable the APIs by running the following commands:
gcloud services enable monitoring.googleapis.com
gcloud services enable telemetry.googleapis.com
Create a cluster
Create a GKE cluster.
Creates a Google Kubernetes Engine cluster named
otlp-testby running the following command:gcloud container clusters create-auto --location CLUSTER_LOCATION otlp-test --project PROJECT_IDAfter the cluster is created, connect to it by running the following command:
gcloud container clusters get-credentials otlp-test --region CLUSTER_LOCATION --project PROJECT_ID
Authorize the Kubernetes service account
The following commands grant the necessary Identity and Access Management (IAM) roles to the Kubernetes service account. These commands assume you are using Workload Identity Federation for GKE:
export PROJECT_NUMBER=$(gcloud projects describe PROJECT_ID --format="value(projectNumber)")

gcloud projects add-iam-policy-binding projects/PROJECT_ID \
  --role=roles/logging.logWriter \
  --member=principal://iam.googleapis.com/projects/$PROJECT_NUMBER/locations/global/workloadIdentityPools/PROJECT_ID.svc.id.goog/subject/ns/opentelemetry/sa/opentelemetry-collector \
  --condition=None

gcloud projects add-iam-policy-binding projects/PROJECT_ID \
  --role=roles/monitoring.metricWriter \
  --member=principal://iam.googleapis.com/projects/$PROJECT_NUMBER/locations/global/workloadIdentityPools/PROJECT_ID.svc.id.goog/subject/ns/opentelemetry/sa/opentelemetry-collector \
  --condition=None

gcloud projects add-iam-policy-binding projects/PROJECT_ID \
  --role=roles/telemetry.tracesWriter \
  --member=principal://iam.googleapis.com/projects/$PROJECT_NUMBER/locations/global/workloadIdentityPools/PROJECT_ID.svc.id.goog/subject/ns/opentelemetry/sa/opentelemetry-collector \
  --condition=None
If your service account has a different format, then you can use the command in the Google Cloud Managed Service for Prometheus documentation to authorize the service account, with the following changes:
- Replace the service-account name
gmp-test-sawith your service account. - Grant the roles shown in the previous set of commands, not just
the
roles/monitoring.metricWriterrole.
Deploy the OpenTelemetry Collector
Create the collector configuration by making a copy of the following
YAML file and placing it in a file named collector.yaml. You can also find
the following configuration on GitHub in the otlp-k8s-ingest
repository.
In your copy, be sure to replace the occurrence of ${GOOGLE_CLOUD_PROJECT}
with your project ID, PROJECT_ID.
OTLP for Prometheus metrics only works when using the OpenTelemetry Collector version 0.140.0 or newer.
Configure the deployed OpenTelemetry Collector
Configure the collector deployment by creating Kubernetes resources.
Create the
opentelemetrynamespace and create the collector configuration in the namespace by running the following commands:kubectl create namespace opentelemetry kubectl create configmap collector-config -n opentelemetry --from-file=collector.yamlConfigure the collector with Kubernetes resources by running the following commands:
kubectl apply -f https://raw.githubusercontent.com/GoogleCloudPlatform/otlp-k8s-ingest/refs/heads/otlpmetric/k8s/base/2_rbac.yaml

kubectl apply -f https://raw.githubusercontent.com/GoogleCloudPlatform/otlp-k8s-ingest/refs/heads/otlpmetric/k8s/base/3_service.yaml

kubectl apply -f https://raw.githubusercontent.com/GoogleCloudPlatform/otlp-k8s-ingest/refs/heads/otlpmetric/k8s/base/4_deployment.yaml

kubectl apply -f https://raw.githubusercontent.com/GoogleCloudPlatform/otlp-k8s-ingest/refs/heads/otlpmetric/k8s/base/5_hpa.yaml
Wait for the collector pods to reach "Running" and have 1/1 containers ready. This takes about three minutes on Autopilot, if this is the first workload deployed. To check the pods, use the following command:
kubectl get po -n opentelemetry -wTo stop watching the pod status, enter Ctrl-C to stop the command.
You can also check the collector logs to make sure there aren't any obvious errors:
kubectl logs -n opentelemetry deployment/opentelemetry-collector
Deploy the telemetry generator
You can test your configuration by using the open-source
telemetrygen tool. This app
generates telemetry and sends it to the collector.
To deploy the
telemetrygenapp in theopentelemetry-demonamespace, run the following command:kubectl apply -f https://raw.githubusercontent.com/GoogleCloudPlatform/otlp-k8s-ingest/refs/heads/main/sample/app.yamlAfter you create the deployment, it might take a while for the pods to be created and start running. To check the status of the pods, run the following command:
kubectl get po -n opentelemetry-demo -wTo stop watching the pod status, enter Ctrl-C to stop the command.
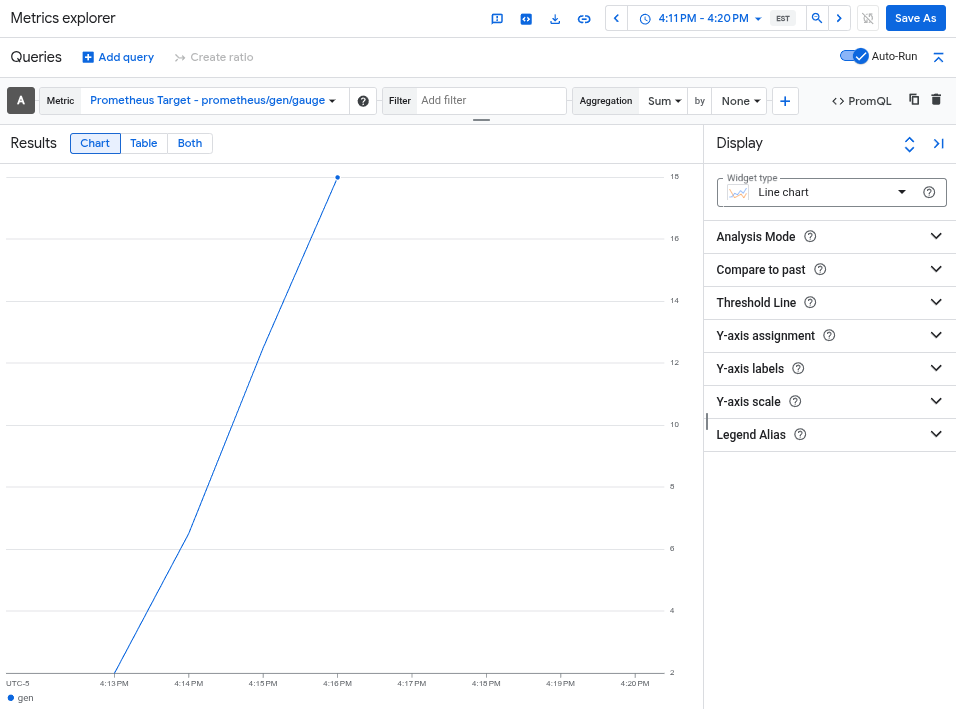
Query a metric by using Metrics Explorer
The telemetrygen tool writes to a metric called gen. You can query
this metric from both the query-builder interface and the PromQL
query editor in Metrics Explorer.
In the Google Cloud console, go to the leaderboard Metrics explorer page:
If you use the search bar to find this page, then select the result whose subheading is Monitoring.
- If you use the Metrics Explorer query-builder interface, then the
full name of the metric is
prometheus.googleapis.com/gen/gauge. - If you use the PromQL query editor, you can query the metric
by using the name
gen.
The following image shows a chart of the gen metric in Metrics Explorer:
Delete the cluster
After verifying your deployment by querying the metric, you can delete the cluster. To delete the cluster, run the following command:
gcloud container clusters delete --location CLUSTER_LOCATION otlp-test --project PROJECT_ID
Using other OpenTelemetry-based collectors
You might be able to use other OpenTelemetry-based collectors to send OTLP metrics to the Telemetry API, although Google Cloud does not provide customer support for non-standard OpenTelemetry-based collectors.
For example, you can send metrics using
Grafana Alloy version 1.16.0 or
newer by authenticating with the otelcol.auth.google
component
and configuring it similarly to a standard OpenTelemetry Collector
using the instructions in this document.
What's next
- For information about using an OpenTelemetry Collector and the Telemetry API with OpenTelemetry zero-code instrumentation, see Use OpenTelemetry zero-code instrumentation for Java.
- For information about sending metrics from applications that use SDKs, see Use SDKs to send metrics from applications.
- For information about migrating to the
otlphttpexporter from another exporter, see Migrate to the OTLP exporter. - To learn more about the Telemetry API, see Telemetry (OTLP) API overview.