

This document describes how to access the metrics generated by your Gemini Enterprise app. These metrics provide insights into the performance and health of your application.
You can view metric telemetry using either the Metrics Explorer or directly within individual agents using the agent's Observability tab.
Key concepts
This section introduces key concepts related to observability in Gemini Enterprise.
| Concept | Description |
|---|---|
| Metrics | Metrics are numerical measurements that systems collect over time. These measurements represent the performance, resource utilization, or behavior of a system. Engineers use metrics to monitor system health, identify trends, and trigger alerts. |
| Agent-scoped metrics | Metrics that measure the activity of an individual agent, such as its sessions, conversational turns, and tool invocations. They are listed under the Gemini Enterprise Agent resource type, and they are collected only when the Enable instrumentation of OpenTelemetry traces and logs observability setting is turned on for that agent. |
| App-scoped metrics | Metrics that measure all traffic to an app rather than to a single agent, such as its request count and end-to-end latency. They are listed under the Gemini Enterprise Engine resource type, where Engine is the API name for a Gemini Enterprise app, and they are collected regardless of the observability settings. |
Before you begin
Make sure you have the following:
The Gemini Enterprise Admin role or Google Cloud console Gemini Enterprise User role.
An existing Gemini Enterprise web app. For information about creating a new app, see Create an app.
To access the Metrics Explorer, you must have the Monitoring Viewer role (
roles/monitoring.viewer).Enable the Enable instrumentation of OpenTelemetry traces and logs observability setting. Depending on the agent type, enable this in the app-level configurations (for the Core Assistant agent) or inside the agent's Configuration tab (for Agent Designer employee-made agents and Deep Research agents). For more information, see Manage observability settings. This setting is required for the agent-scoped metrics. The app-scoped metrics, which are listed under the Gemini Enterprise Engine resource type, are collected without it.
Data retention
Metrics generated by your Gemini Enterprise app are stored in
Cloud Monitoring in your Google Cloud project, and their retention is governed
by Cloud Monitoring. Gemini Enterprise metrics are published under the
discoveryengine.googleapis.com/ prefix, which falls under the "all other
Google Cloud metrics" tier and is retained for 6 weeks by default. Data
older than the retention period is automatically deleted. For the authoritative
and most current retention values, see
Data retention in the
Cloud Monitoring quotas and limits documentation.
Access metrics in Metrics Explorer
To access the metrics, follow these steps:
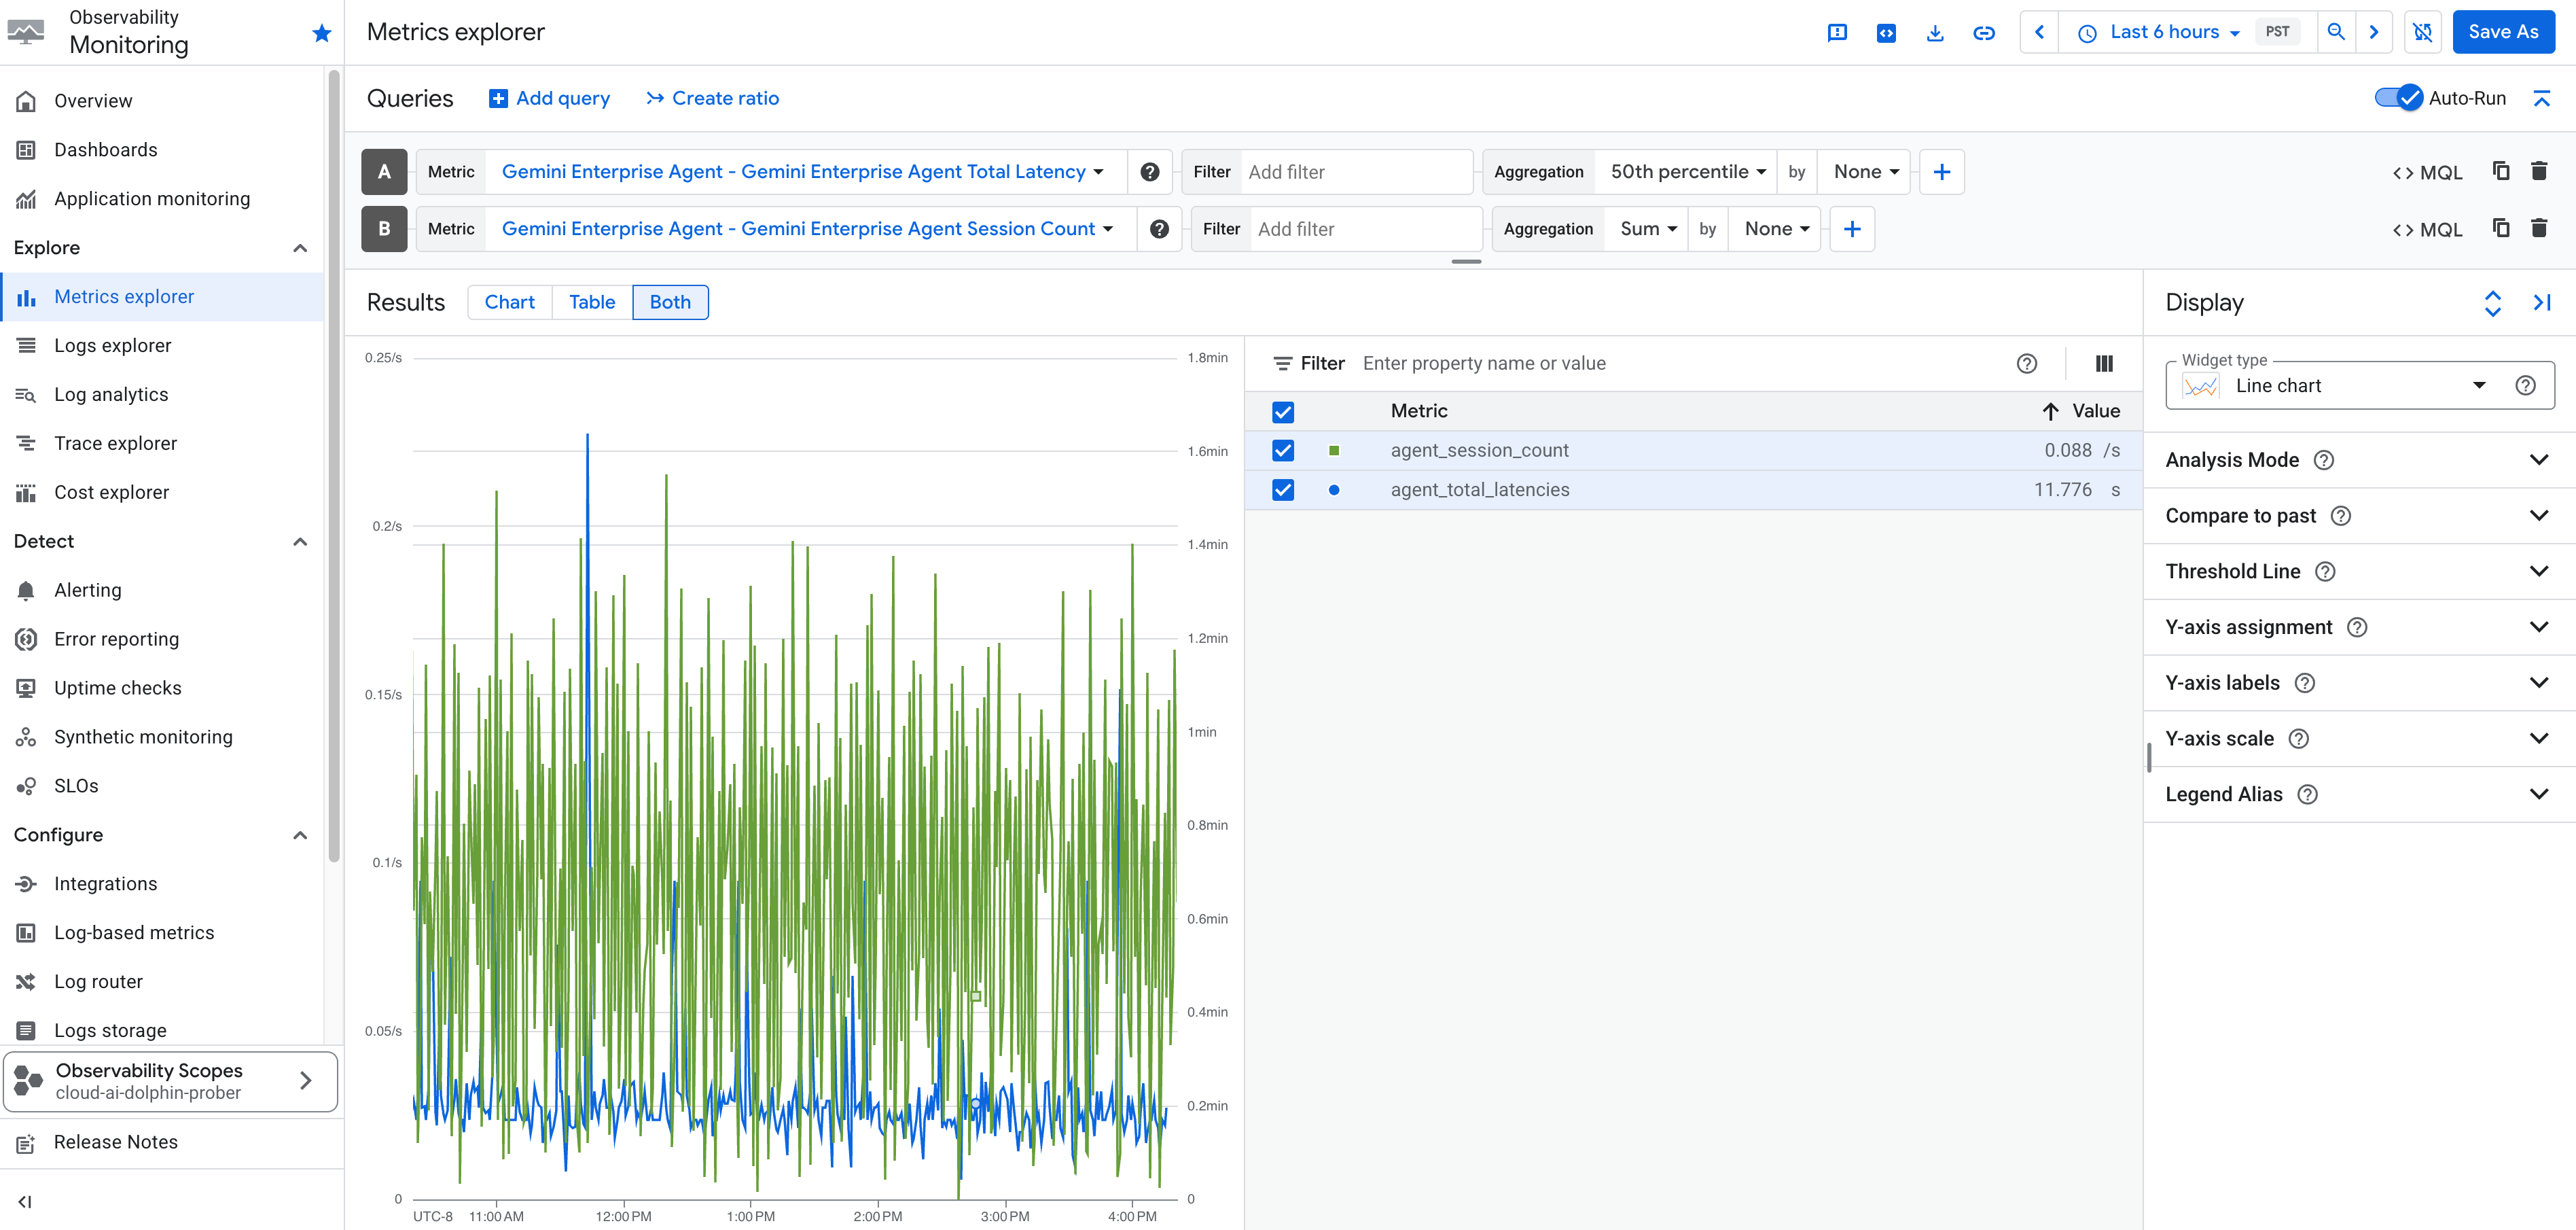
In the Google Cloud console, go to the Metrics Explorer page.
Select the Google Cloud project where your Gemini Enterprise app was created.
Click Select a metric to open a search bar.
In the search bar, look for the following metrics:
Metric Name Description Gemini Enterprise Agent - Gemini Enterprise Agent Session Count The number of sessions handled by the Gemini Enterprise Agent. Gemini Enterprise Agent - Gemini Enterprise Agent Tool Count The number of times tools were invoked by the Gemini Enterprise Agent. Gemini Enterprise Agent - Gemini Enterprise Agent Turn Count The number of conversational turns within Gemini Enterprise Agent sessions. Gemini Enterprise Agent - Gemini Enterprise Agent Total Latency The total latency of responses from the Gemini Enterprise Agent. Gemini Enterprise Agent - Gemini Enterprise Agent Tool Total Latency The total latency incurred by tool executions within the Gemini Enterprise Agent. Gemini Enterprise DataConnector - Gemini Enterprise DataConnector Request Count The total count of requests made to the Gemini Enterprise data connectors (also referred to as data stores in the Google Cloud console). Gemini Enterprise Engine - Gemini Enterprise Engine Request Count The total number of requests received by your Gemini Enterprise app, across all traffic to the app rather than a single agent. Broken down by API method, canonical gRPC response code, response code class, query type, and model. Gemini Enterprise Engine - Gemini Enterprise Engine Request Total Latency The distribution of end-to-end request latency for your Gemini Enterprise app. Recorded for every request, including requests that return an error. Gemini Enterprise Engine - Gemini Enterprise Engine Time to First Answer Latency The distribution of latency between receiving a request and streaming the first answer token. Recorded only for requests that produce at least one answer token. Gemini Enterprise Engine - Gemini Enterprise Engine Time to First Token Latency The distribution of latency between receiving a request and streaming the first token, whether that token is part of the model's thinking process or a final answer. Recorded only for requests that produce at least one streamed token. Select the metric you want to explore and click Apply.
Optionally, set additional label filters, aggregation elements, and adjust the time range.
Access metrics for agents
You can also view operational, tool-specific, and session metric dashboards directly for individual agents on the agent's Observability tab in the Google Cloud console.
To access metrics for an agent:
- In the Google Cloud console, navigate to your app, and then click Agents.
- Select the agent you want to inspect, and then click the Observability tab.
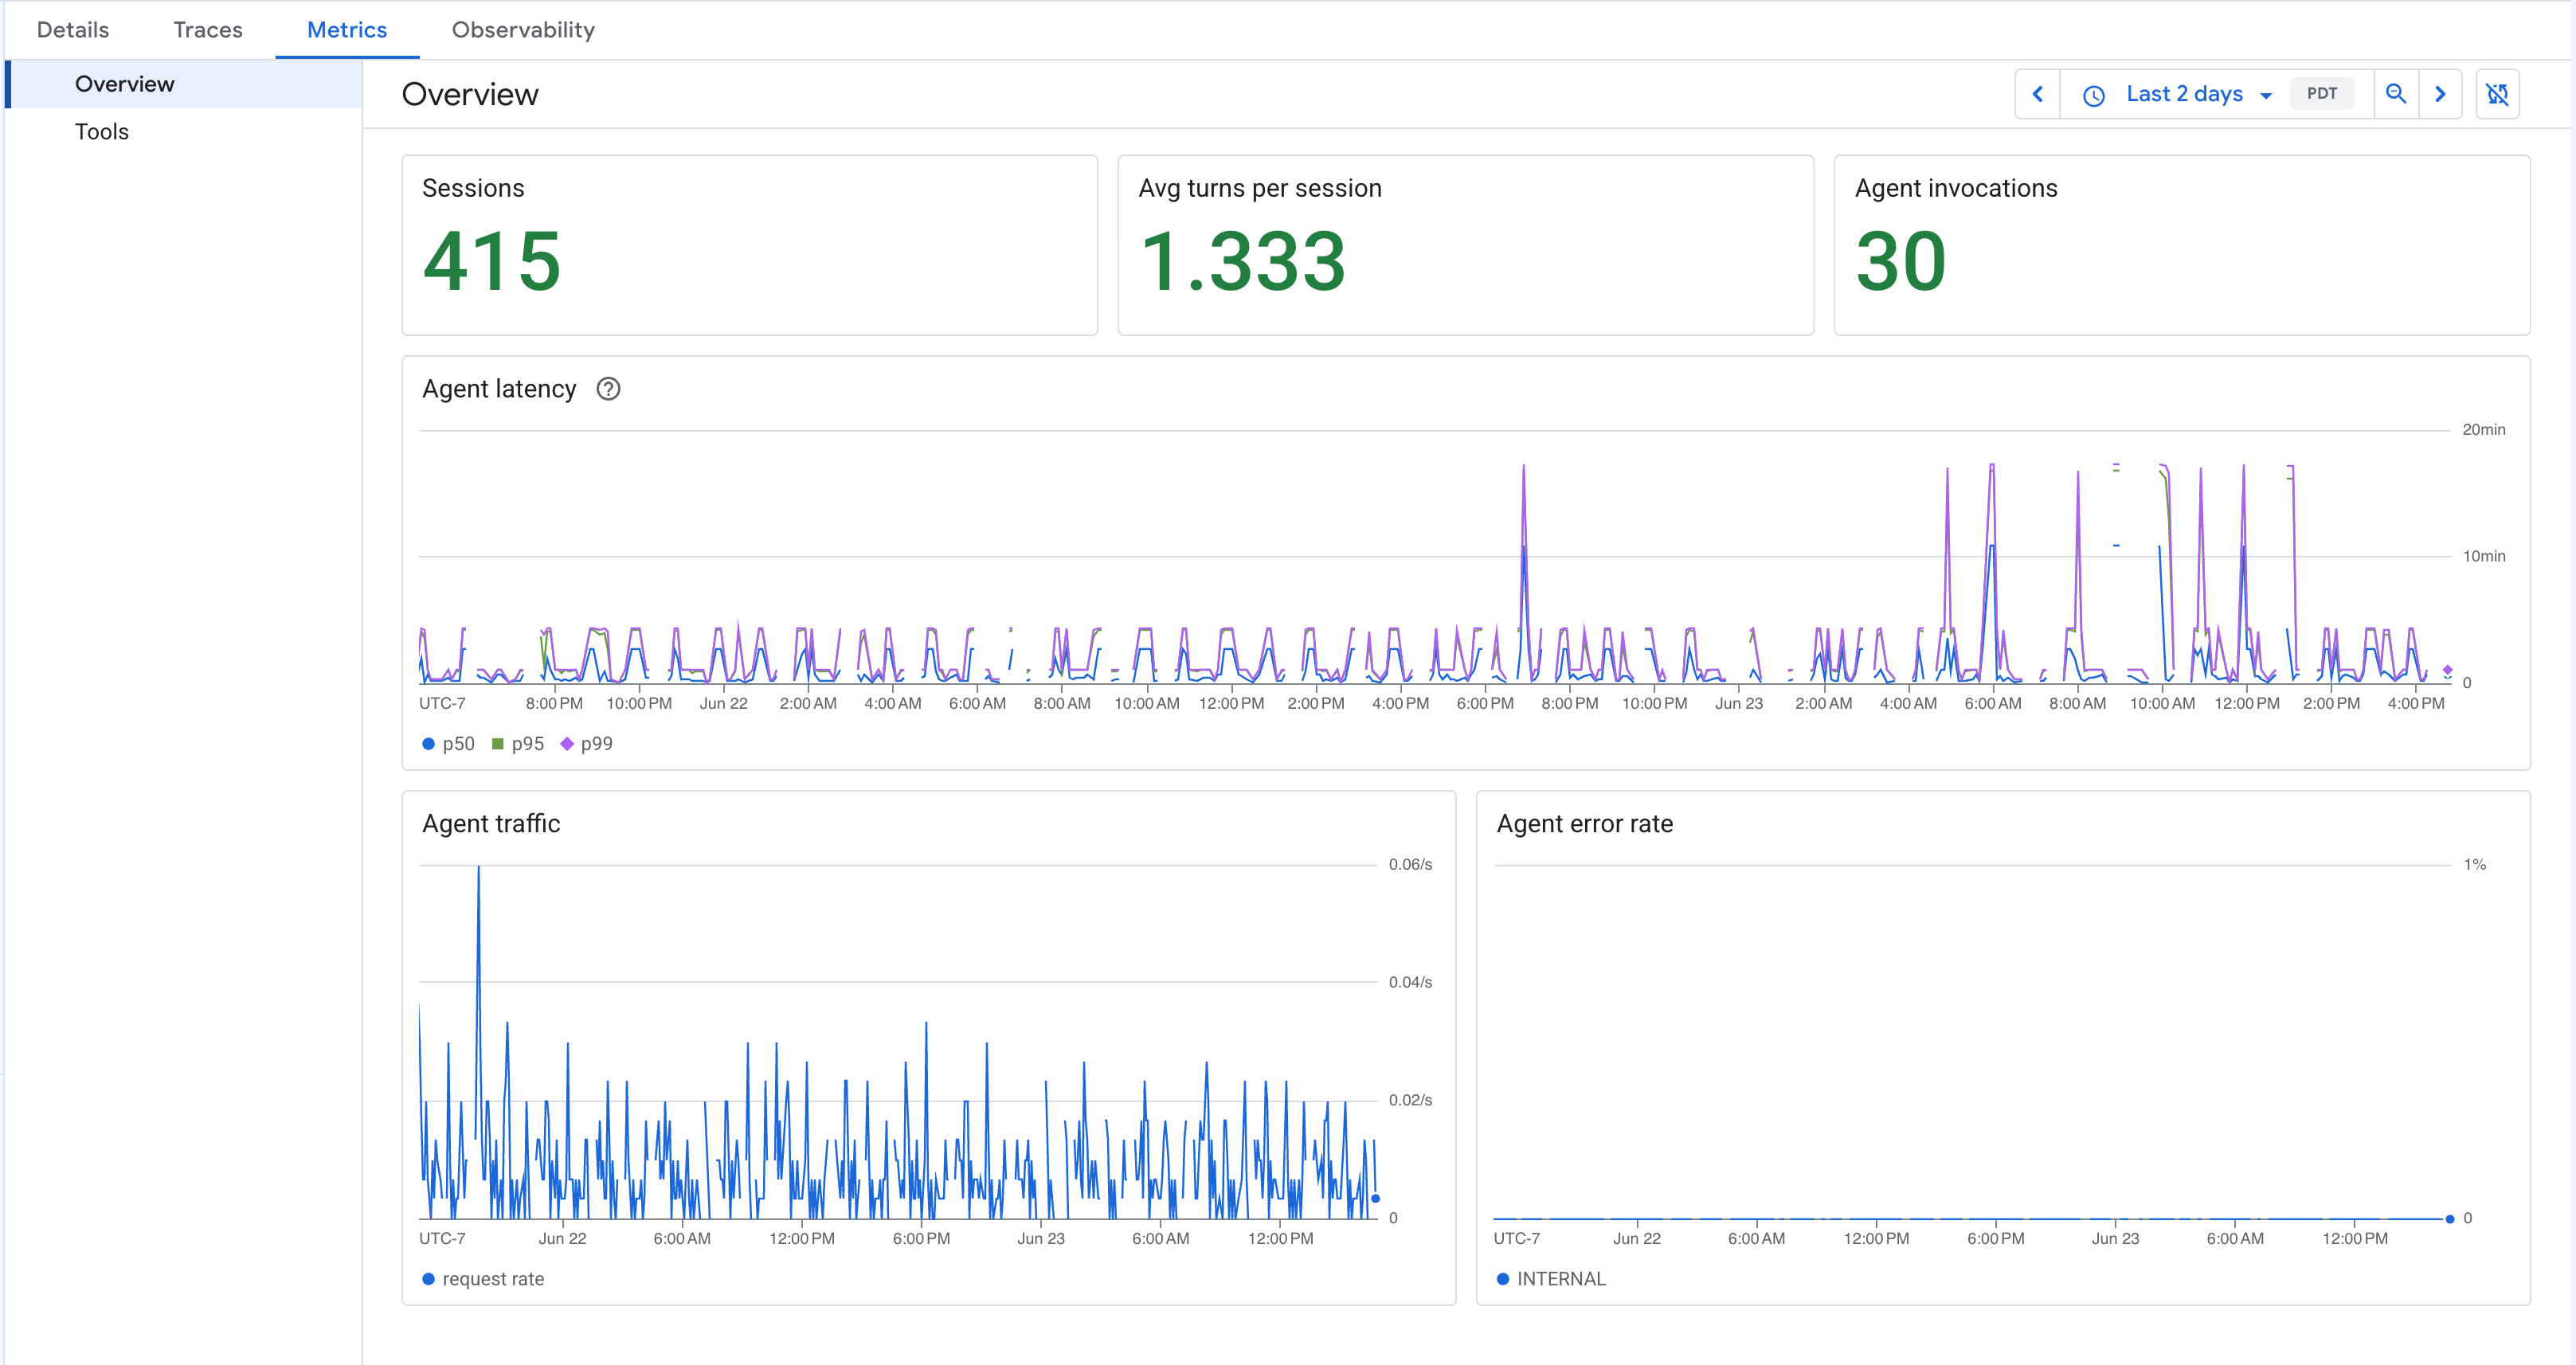
The Observability tab provides key operational telemetry divided into two views: Overview and Tools.
Overview metrics
This view provides a dashboard summarizing standard session and agent health data, which includes:
- Sessions: Total user session count.
- Avg. time per session: Average time elapsed during a session.
- Agent invocations: Total times that the agent was called.
- Agent latency: Latency across time and specific metrics.
- Agent traffic: Inbound request volume.
- Agent error rate: Percentage of failed agent invocations.
Tools metrics
This view focuses specifically on the usage and latency of tools connected to your agent, which includes:
- Total calls: Number of tool execution requests.
- P95 duration by tool: The 95th percentile latency of executions, categorized by tool.
- Count of calls by tool: Total call count divided among different tools.
- Error rate by tool: The failure rate of executions by tool.
- "No tool called" rate: The rate at which interactions did not trigger any tool execution.
What's next
- Create dashboards with the Gemini Enterprise metrics. For more information, see Create and manage custom dashboards.
- Create alerts when metrics cross a threshold. For more information, see Create metric-threshold alerting policies
- To turn off Metrics Explorer tracking, see Turn off observability settings.