
本頁面將引導您前往 Looker Studio 中的對話式數據分析,並開始與資料對話。如要瞭解如何連結至資料來源,請參閱「在 Looker Studio 中設定對話式 Analytics」說明文件頁面。
瞭解 Gemini for Google Cloud 如何使用您的資料。
前往對話內容分析
您可以透過下列方式從 Looker Studio 存取對話式數據分析:
 。
。發起對話
您對資料集提出的問題會依對話整理。將工作分成多個對話,有助於整理詢問內容。如要建立新對話,請按照下列步驟操作:
- 在對話內容分析中,按一下「+ 建立對話」。
選取要調查的資料來源,或要用於對話的資料代理:
資料來源:如要根據現有資料來源開始對話,請選取「資料來源」面板,然後選取資料來源。如要建立新的資料來源,請選取「連結至資料」。
資料代理:如要與現有資料代理開始對話,請選取「代理」,然後選取資料代理。如要建立新的資料代理程式,請選取「+ 建立代理程式」。
如要開始對話,請輸入問題,然後按下 Return 鍵 (Mac) 或 Enter 鍵 (電腦)。
你可以從「近期」部分返回對話。
歡迎隨時提問
您可以提問來取得資料洞察資訊,建議問題可做為探索資料的起點,協助您熟悉對話式數據分析。
詢問資料來源相關問題
建立對話後,即可在對話中的「提出問題」欄位中,詢問資料相關問題。
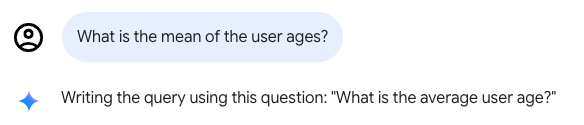
問題不必採用特定格式或語法,不過,這些欄位必須與所選資料來源相關。撰寫查詢後,對話式分析可能會重新措辭您的問題,並在對話視窗中顯示重新措辭的問題,緊接在原始問題之後。舉例來說,對話式數據分析可能會將「使用者年齡的平均值是多少?」這個問題改寫為「使用者平均年齡是多少?」
在後續對話中,對話式數據分析會將先前的問題和答案納入考量。您可以根據先前的答案,進一步修正結果或變更視覺化類型。
如需建立問題的更多指引,請參閱「問題限制」。
與 Looker 資料來源對話
建立連結至 Looker 探索的新對話後,即可提出有關 Looker 資料的問題。
與資料對話時,可收合的「資料」面板會顯示對話使用的 Looker 探索名稱。「資料」面板也提供下列選項:
- 「查看欄位」:按一下「查看欄位」,即可在新瀏覽器視窗中查看 Looker 的探索。
- 「新對話」:與目前對話使用的 Looker 探索展開新對話。
在 Looker 探索中開啟
如要將查詢結果做為已連結 Looker 執行個體中的探索開啟,請按一下查詢結果中的「在探索中開啟」。
與 BigQuery 資料對話
連結 BigQuery 資料來源後,您就可以提出有關 BigQuery 資料的問題。
與資料對話時,可收合的「資料」面板會顯示對話使用的 BigQuery 資料表名稱。「資料」面板也提供下列選項:
- 「查看欄位」:在新瀏覽器分頁中查看 BigQuery 中的資料表。
- 新對話:使用目前對話使用的 BigQuery 資料,開始新的對話。
管理對話中的查詢
與資料對話時,您可以停止執行中的查詢回應,或刪除最近的問題和回應,藉此管理對話。
停止查詢回覆
如要在傳送訊息後停止執行查詢,請按一下「停止回覆」。對話式數據分析會停止執行查詢,並顯示以下訊息:The query was cancelled.
刪除最近的問題
如要刪除最近的問題和回覆,請按照下列步驟操作:
- 將游標懸停在最近的問題上,然後按一下 「刪除訊息」。
- 在「要永久刪除這則訊息嗎?」對話方塊中,按一下「刪除」,即可永久刪除問題和回覆。
瞭解查詢結果和計算
在對話式數據分析中詢問資料相關問題時,系統可能會根據特定查詢和連結的資料,在回覆中提供視覺化圖表、資料表或其他詳細資料。
除了這項查詢的回覆內容,對話式數據分析還提供下列選項,協助您瞭解查詢結果和計算方式:
- 答案的計算方式詳細資料
- 如果適用,查看回應的其他深入分析資料
判斷答案的計算方式
如要查看對話式 Analytics 如何得出答案或建立視覺化效果,請按一下查詢結果中的「這是如何計算出來的?」。
按一下「計算方式」,對話式數據分析會顯示下列分頁:
程式碼:顯示執行後產生結果的 SQL 查詢。如果將對話式數據分析連結至 BigQuery 資料表,「程式碼」分頁會顯示產生的 BigQuery SQL。
文字:以純文字說明對話式數據分析得出指定答案的步驟。這份說明會列出使用的原始欄位名稱、執行的計算、套用的篩選器、排序順序和其他詳細資料。
取得其他洞察資料
如果對話式數據分析可提供有關回覆的其他資料洞察,就會顯示「洞察」keyboard_arrow_down 按鈕。按一下「洞察」keyboard_arrow_down,即可查看查詢的其他資訊。「洞察」只會分析提示傳回的資料,不會執行額外查詢來擷取其他資料。洞察資料可做為發想後續問題的實用來源,讓對話得以延續。
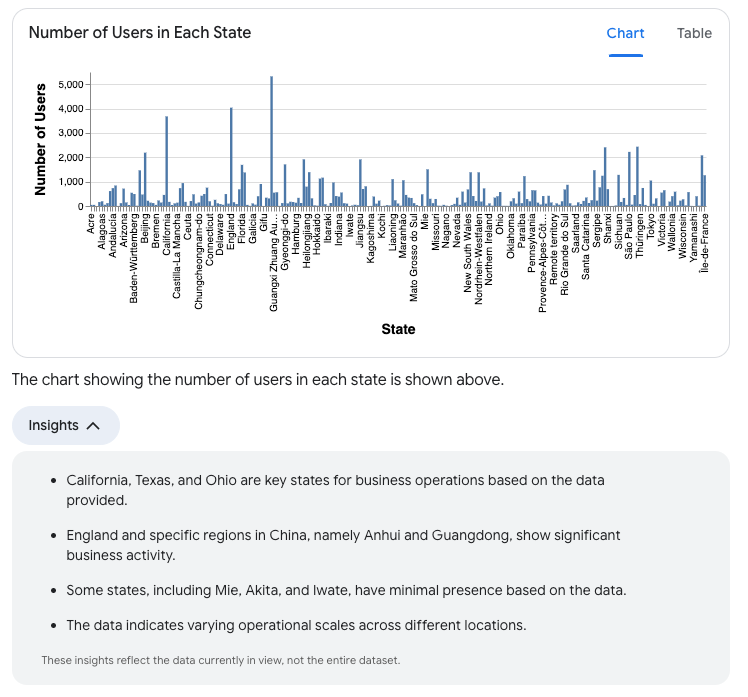
以下是「每個州的使用者人數?」提示可能傳回的部分洞察資料範例:
- 資料量高和資料量低區域的一般摘要。例如:
- 「根據提供的資料,加州、德州和俄亥俄州是業務營運的重點州別。」
- 「英格蘭和中國特定地區 (安徽和廣東) 的商業活動顯著。」
- 「根據資料,三重縣、秋田縣和岩手縣等部分都道府縣的業務量極少。」
- 資料集變異性的評估結果。例如:「資料顯示不同地點的營運規模各異。」
管理會話群組
你可以變更對話名稱、刪除對話,或從垃圾桶資料夾還原對話。
為對話命名
對話式數據分析會根據您的第一個問題和回覆,自動生成對話標題。如要變更生成的名稱,請按照下列步驟操作:
- 按一下對話頁面頂端的標題。
- 輸入新的對話名稱。
- 如要儲存變更,請點選頁面上的其他位置,或按下 Return 鍵 (Mac) 或 Enter 鍵 (PC)。
刪除對話
如要將對話移至垃圾桶,請開啟對話,然後按一下 「移至垃圾桶」。
還原或永久刪除對話
如要從垃圾桶還原或永久刪除對話,請按照下列步驟操作:
- 在「對話數據分析」中,選取左側導覽面板中的「垃圾桶」,即可查看已移至垃圾桶的對話清單。
- 在「垃圾桶」部分,按一下要還原或永久刪除的對話名稱。
- 在「確定要繼續嗎?」對話方塊中,選取下列其中一個選項:
- 取消:取消動作。
- 還原:還原對話。您可以在對話內容分析的左側導覽選單中,前往「近期對話」部分存取對話。
- 永久刪除:永久刪除對話。
搜尋對話
如要依標題搜尋特定對話,請按照下列步驟操作:
- 在「搜尋對話式數據分析」搜尋列中輸入搜尋查詢。輸入文字時,系統會顯示符合搜尋查詢的對話清單。
- 從搜尋結果中選取對話,即可開啟該對話。
已知限制
對話式數據分析有下列已知限制:
圖表限制
對話式數據分析會運用 Vega-lite 生成對話圖表。系統完全支援下列 Vega 圖表類型:
- 折線圖 (一或多個數列)
- 面積圖
- 長條圖 (橫向、直向、堆疊)
- 散布圖 (一或多個群組)
- 圓餅圖
系統支援下列 Vega 圖表類型,但算繪時可能會發生非預期的行為:
- 地圖
- 熱視圖
- 含有工具提示的圖表
系統不支援 Vega 目錄以外的圖表類型。如果圖表未在本節中指定,則視為不支援。
資料來源限制
- 使用 Looker 資料來源時,請注意下列限制:
- 對話式數據分析無法設定使用 LookML
parameter參數定義的篩選器限定欄位值。 - 對話式數據分析每個查詢最多可傳回 5,000 個資料列。
- 對話式數據分析無法設定使用 LookML
- BigQuery 資料來源有下列限制:
- 一次只能與一個 BigQuery 資料表對話。如要與其他 BigQuery 資料表對話,或是與使用其他 BigQuery 資料表的資料代理對話,請開始新的對話。
- 對話式數據分析不支援 BigQuery 的彈性資料欄名稱功能。
- 如果資料來源已停用報表中的欄位編輯功能,對話式數據分析就無法正常運作,因為這項設定會導致對話式數據分析無法建立計算欄位。
問題限制
對話式數據分析支援可透過單一視覺化圖表回答的問題,例如:
- 指標趨勢
- 指標的各維度細目或分布
- 一或多個維度的不重複值
- 單一指標值
- 按照指標呈現前幾名的維度值
對話式數據分析目前不支援只能透過下列複雜的視覺化圖表回答的問題:
- 預測
- 進階統計分析,包括相關性和異常偵測
啟用程式碼解譯器後,即可解答進階問題,例如預測。
對話範例
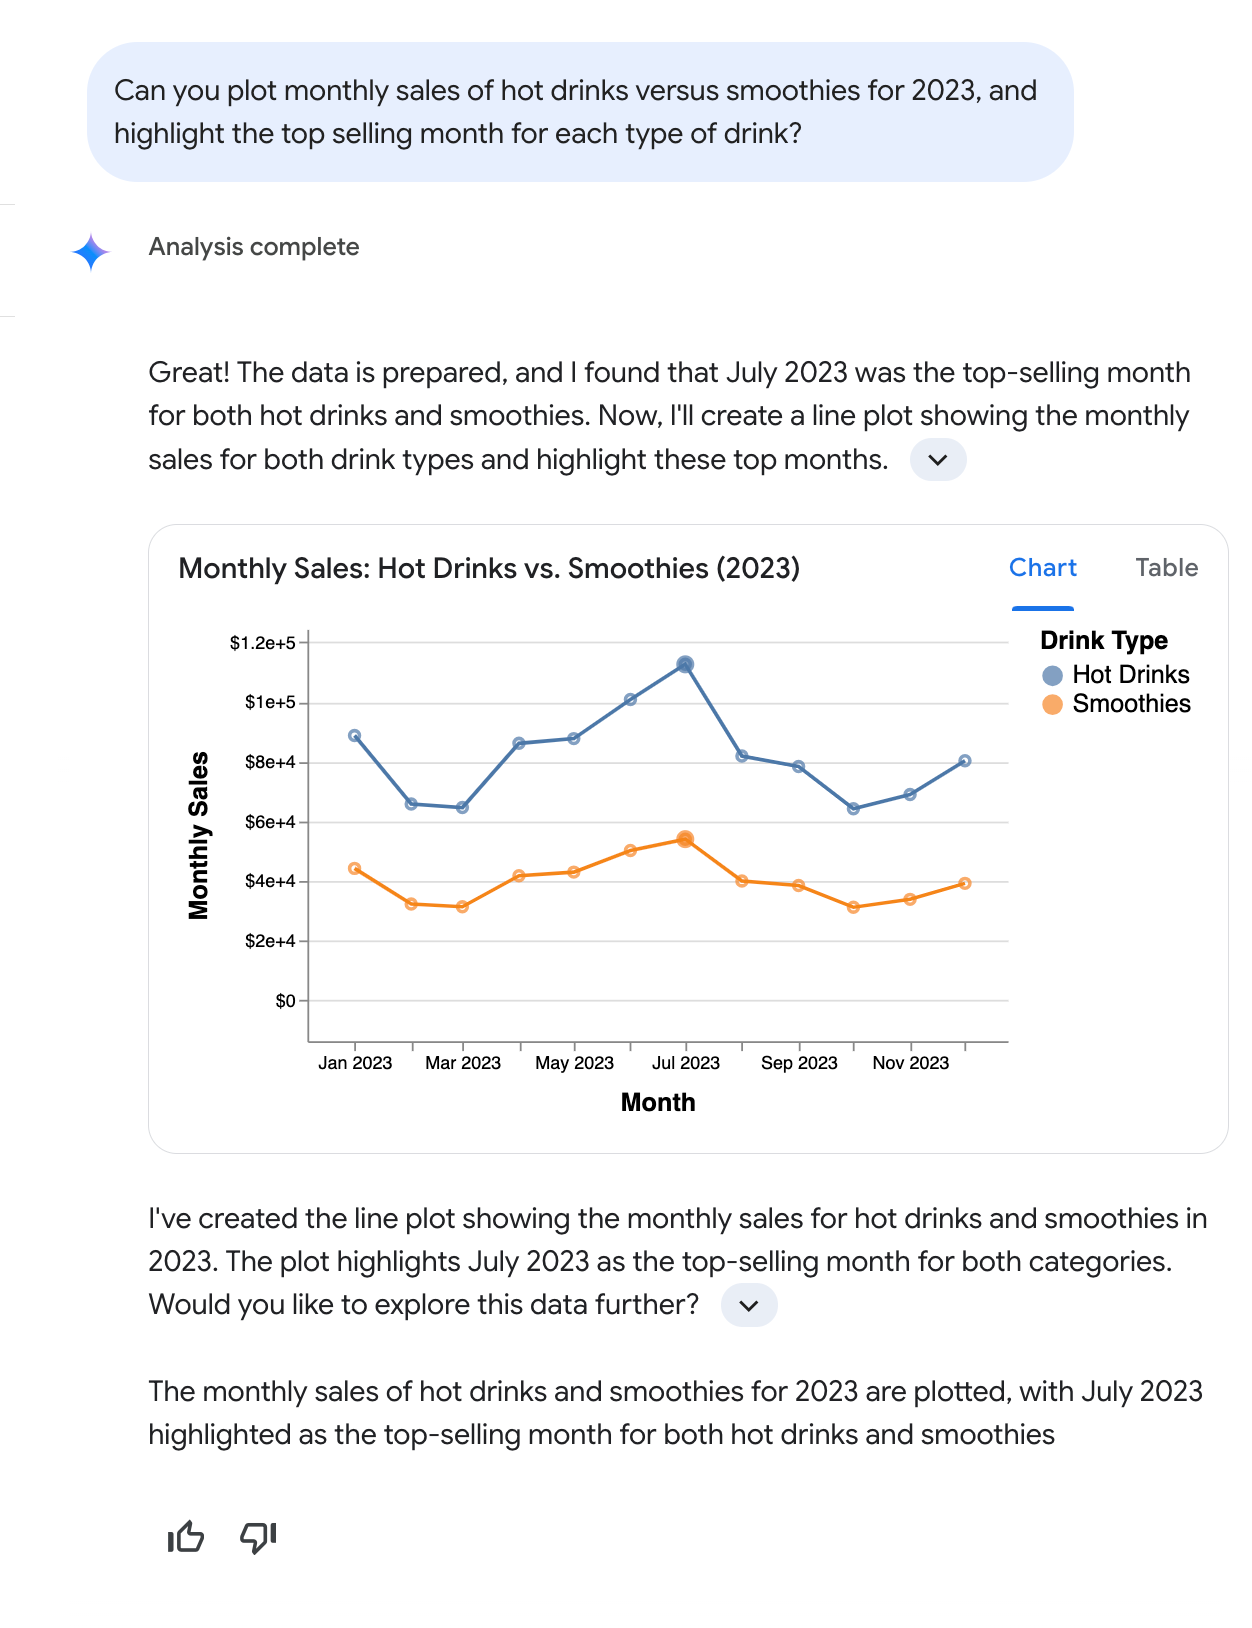
以下對話範例顯示使用者如何以自然來回的方式與對話式數據分析互動。在本例中,使用者提出以下問題:「請繪製 2023 年熱飲和冰沙的每月銷售量,並標示出每種飲品的銷售量最高月份。」對話式數據分析會產生折線圖,顯示 2023 年熱飲和冰沙的每月銷售量,並醒目顯示 7 月是這兩個類別的銷售量最高月份。
 s
s
如本範例對話所示,對話式數據分析功能會解讀自然語言要求,包括使用「銷售量」和「熱飲」等常見字詞的多部分問題,使用者不必指定確切的資料庫欄位名稱 (例如 Total monthly drink sales) 或定義篩選條件 (例如 type of beverage = hot)。對話式數據分析功能會說明主要發現、解釋推理過程,並提供包含文字和圖表的答案 (視情況而定)。為鼓勵深入分析,對話式數據分析功能也可能會建議後續問題。
相關資源
對話式 Analytics 總覽:對話式 Analytics 的到達網頁包含設定規定、已知限制、支援的問題類型等資訊。
建立資料代理並與之對話:您可以提供資料專屬的背景資訊和指示,自訂 AI 輔助的資料查詢代理,協助對話式數據分析功能生成更準確且符合情境的回覆。
使用程式碼解譯器啟用進階分析:對話式數據分析中的程式碼解譯器會將自然語言問題轉換為 Python 程式碼,並執行該程式碼。相較於以標準 SQL 為基礎的查詢,程式碼解譯器使用 Python 進行的分析和視覺化作業更為複雜。