

This document describes how to access the metrics generated by your Gemini Enterprise app in the Metrics Explorer. These metrics provide insights into the performance and health of your application.
Key concepts
This section introduces key concepts related to observability in Gemini Enterprise.
| Concept | Description |
|---|---|
| Metrics | Metrics are numerical measurements that systems collect over time. These measurements represent the performance, resource utilization, or behavior of a system. Engineers use metrics to monitor system health, identify trends, and trigger alerts. |
Before you begin
Make sure you have the following:
The Gemini Enterprise Admin role.
An existing Gemini Enterprise web app. For information about creating a new app, see Create an app.
To access the Metrics Explorer, you must have the Monitoring Viewer role (
roles/monitoring.viewer).In the Gemini Enterprise app configurations, enable the Enable instrumentation of OpenTelemetry traces and logs setting. For more information, see Manage observability settings.
Access metrics
To access the metrics, follow these steps:
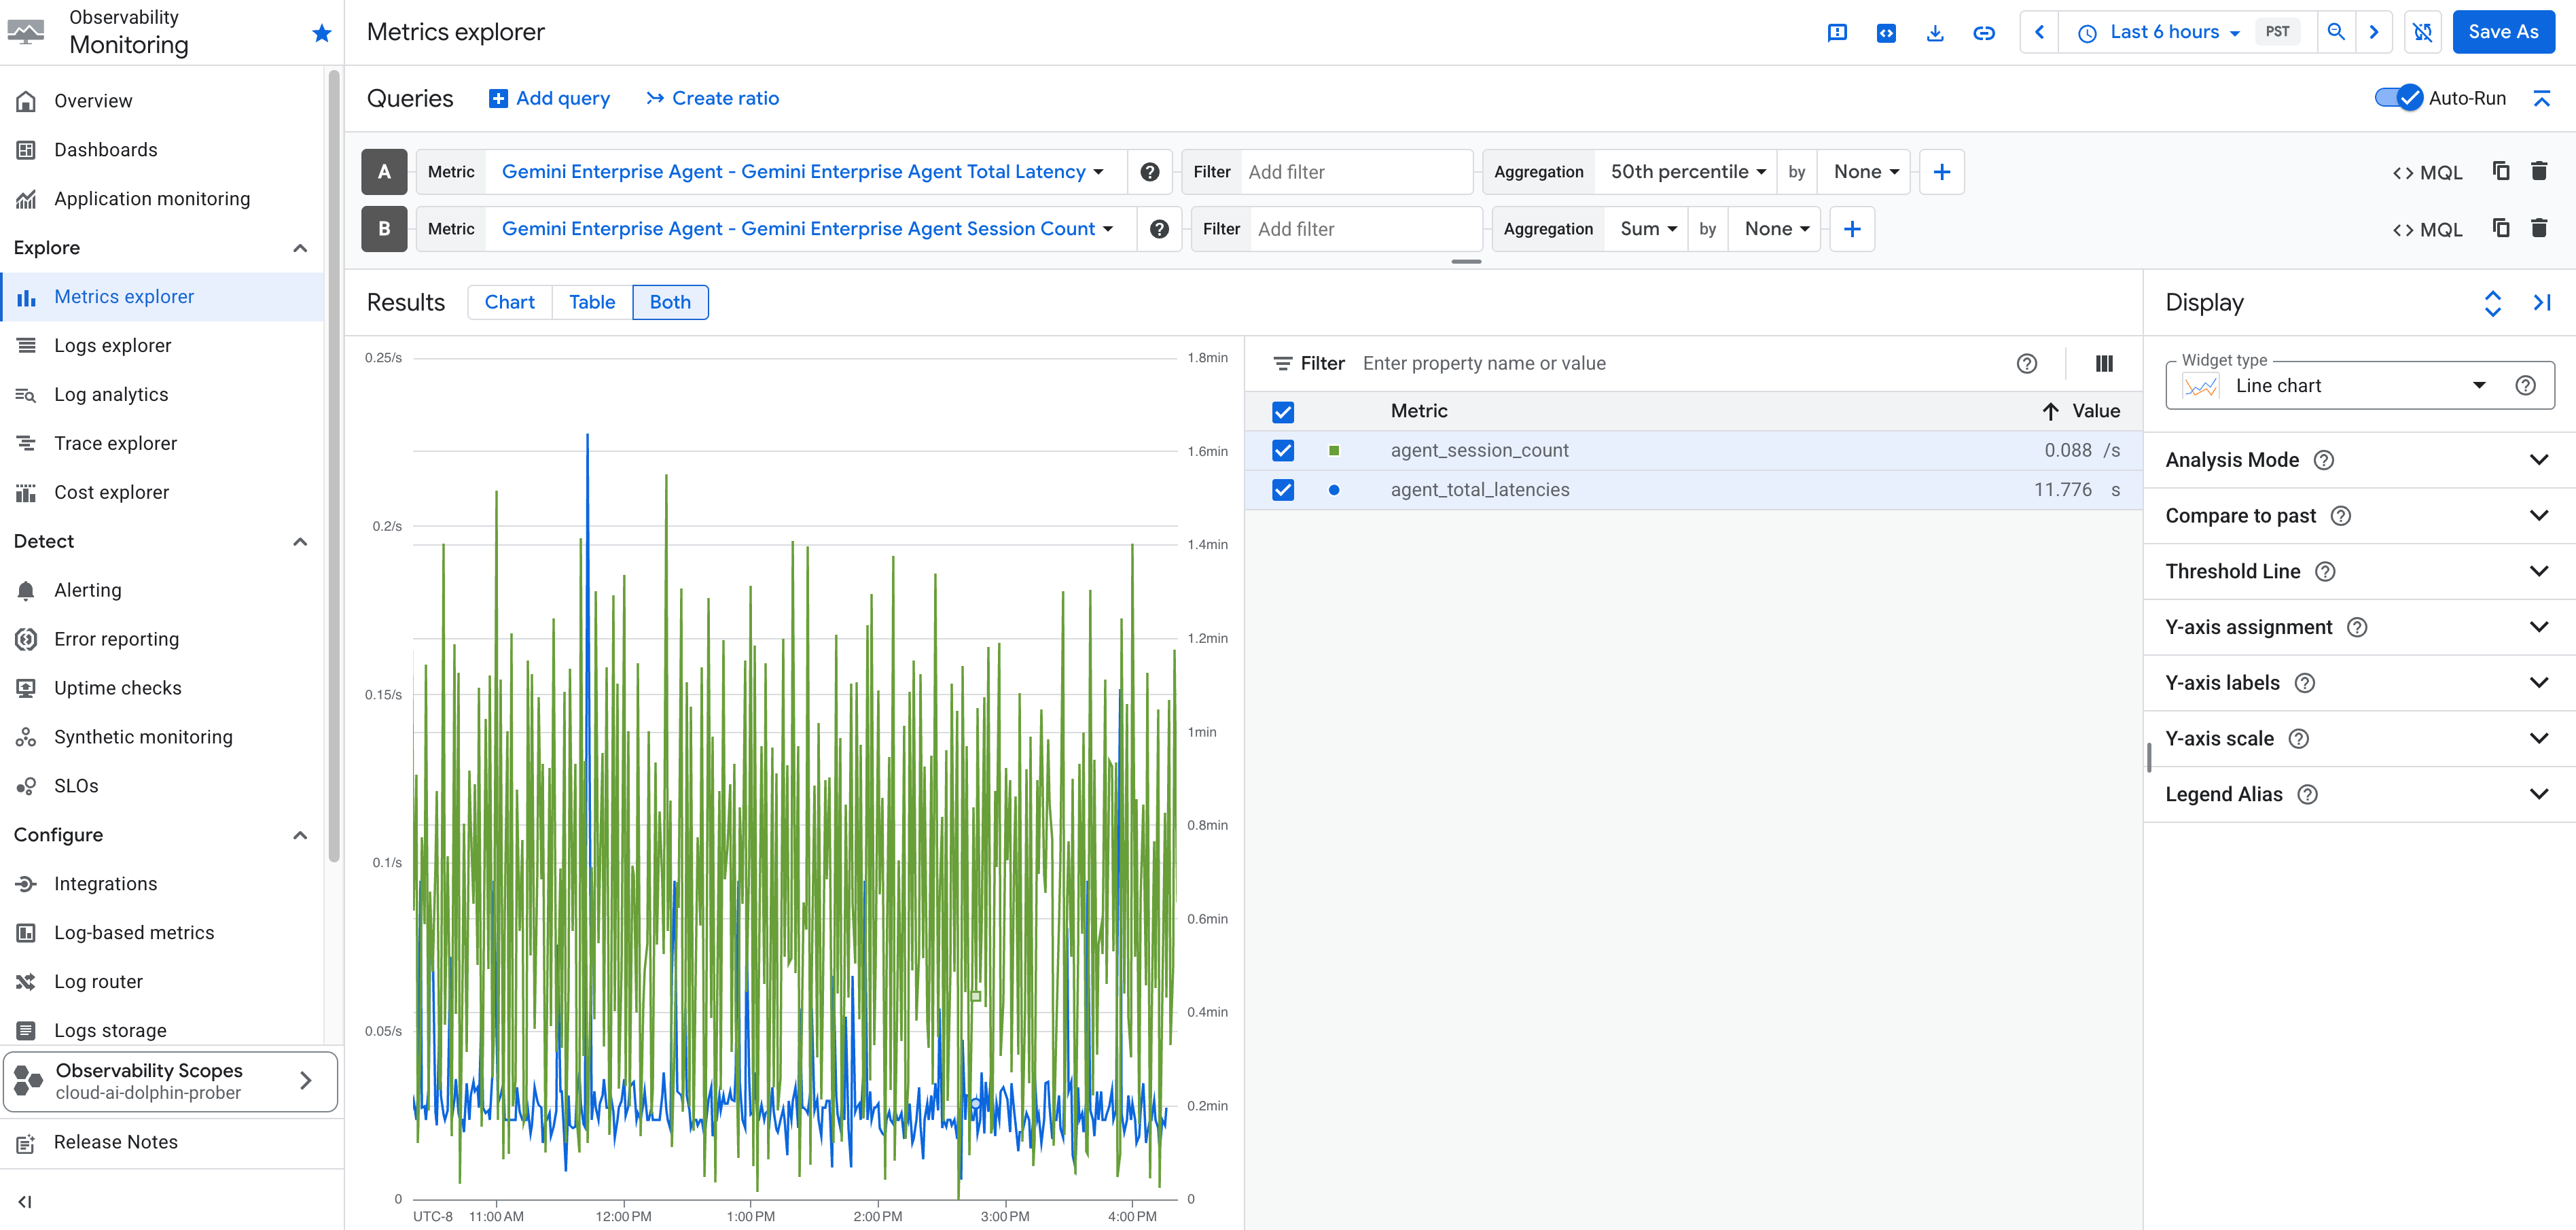
In the Google Cloud console, go to the Metrics Explorer page.
Select the Google Cloud project where your Gemini Enterprise app was created.
Click Select a metric to open a search bar.
In the search bar, look for the following metrics:
Metric Name Description Gemini Enterprise Agent - Gemini Enterprise Agent Session Count The number of sessions handled by the Gemini Enterprise Agent. Gemini Enterprise Agent - Gemini Enterprise Agent Tool Count The number of times tools were invoked by the Gemini Enterprise Agent. Gemini Enterprise Agent - Gemini Enterprise Agent Turn Count The number of conversational turns within Gemini Enterprise Agent sessions. Gemini Enterprise Agent - Gemini Enterprise Agent Total Latency The total latency of responses from the Gemini Enterprise Agent. Gemini Enterprise Agent - Gemini Enterprise Agent Tool Total Latency The total latency incurred by tool executions within the Gemini Enterprise Agent. Gemini Enterprise DataConnector - Gemini Enterprise DataConnector Request Count The total count of requests made to the Gemini Enterprise data connectors (also referred to as data stores in the Google Cloud console). Select the metric you want to explore and click Apply.
Optionally, set additional label filters, aggregation elements, and adjust the time range.
What's next
- Create dashboards with the Gemini Enterprise metrics. For more information, see Create and manage custom dashboards.
- Create alerts when metrics cross a threshold. For more information, see Create metric-threshold alerting policies
- To turn off metrics tracking, see Turn off observability settings.