
在 Bigtable 中使用地理空間資料
本頁面說明如何使用 GoogleSQL 地理函式,在 Bigtable 中儲存及查詢地理空間資料。地理空間資料包括地表的幾何表示法,以點、線和多邊形的形式呈現。您可以將這些實體分組為集合,追蹤地點、路線或其他感興趣的區域。
基本操作
專屬的 GoogleSQL 地理位置函式可讓 Bigtable 針對地理空間計算和查詢時間,將資料庫效能最佳化。在基本用法範例中,我們使用 tourist_points_of_interest 資料表,其中包含名為 poi_data 的單一資料欄系列。
| poi_data | |||
|---|---|---|---|
| 資料列索引鍵 | 名稱 | 位置 | |
| p1 | 艾菲爾鐵塔 | POINT(2.2945 48.8584) |
寫入地理位置資料
如要將地理空間資料寫入 Bigtable 欄,您必須以 GeoJSON 或 Well-Known Text (WKT) 格式提供地理實體的字串表示法。Bigtable 會將基礎資料儲存為原始位元組,因此您可以在單一資料欄中提供任何實體組合 (例如 Points、LineStrings、Polygons、MultiPoints、MultiLineStrings 或 MultiPolygons)。您在查詢時提供的地理空間實體類型非常重要,因為您需要使用適當的地理位置函式來解讀資料。
舉例來說,如要將一些景點新增至 tourist_points_of_interest 資料表,可以使用 cbt CLI 工具,如下所示:
- 使用 WKT:
cbt set tourist_points_of_interest p2 poi_data:name='Louvre Museum'
cbt set tourist_points_of_interest p2 poi_data:location='POINT(2.3376 48.8611)'

cbt set tourist_points_of_interest p3 poi_data:name='Place Charles de Gaulle'
cbt set tourist_points_of_interest p3 poi_data:location='POLYGON(2.2941 48.8733, 2.2941 48.8742, 2.2957 48.8742, 2.2958 48.8732, 2.2941 48.8733)'
- 使用 GeoJSON:
cbt set tourist_points_of_interest p2 poi_data:name='Louvre Museum'
cbt set tourist_points_of_interest p2 poi_data:location='{"type": "Point", "coordinates": [2.3376, 48.8611]}'

cbt set tourist_points_of_interest p3 poi_data:name='Place Charles de Gaulle'
cbt set tourist_points_of_interest p3 poi_data:location='{"type": "Polygon", "coordinates": [[ [2.2941, 48.8733], [2.2941, 48.8742], [2.2957, 48.8742], [2.2958, 48.8732], [2.2941, 48.8733] ]] }'
查詢地理位置資料
您可以在 Bigtable Studio 中使用 GoogleSQL 查詢 tourist_points_of_interest 資料表,並使用地理位置函式篩選結果。舉例來說,如要尋找距離特羅卡德羅 1500 公尺內的所有觀光景點,可以使用 ST_DWITHIN 函式:
SELECT _key, poi_data['name'], poi_data['location']
FROM points_of_interest
WHERE ST_DWITHIN(CAST(poi_data['location'] AS STRING), ST_GEOGPOINT(2.2874, 48.86322), 1500);
結果類似於以下內容:
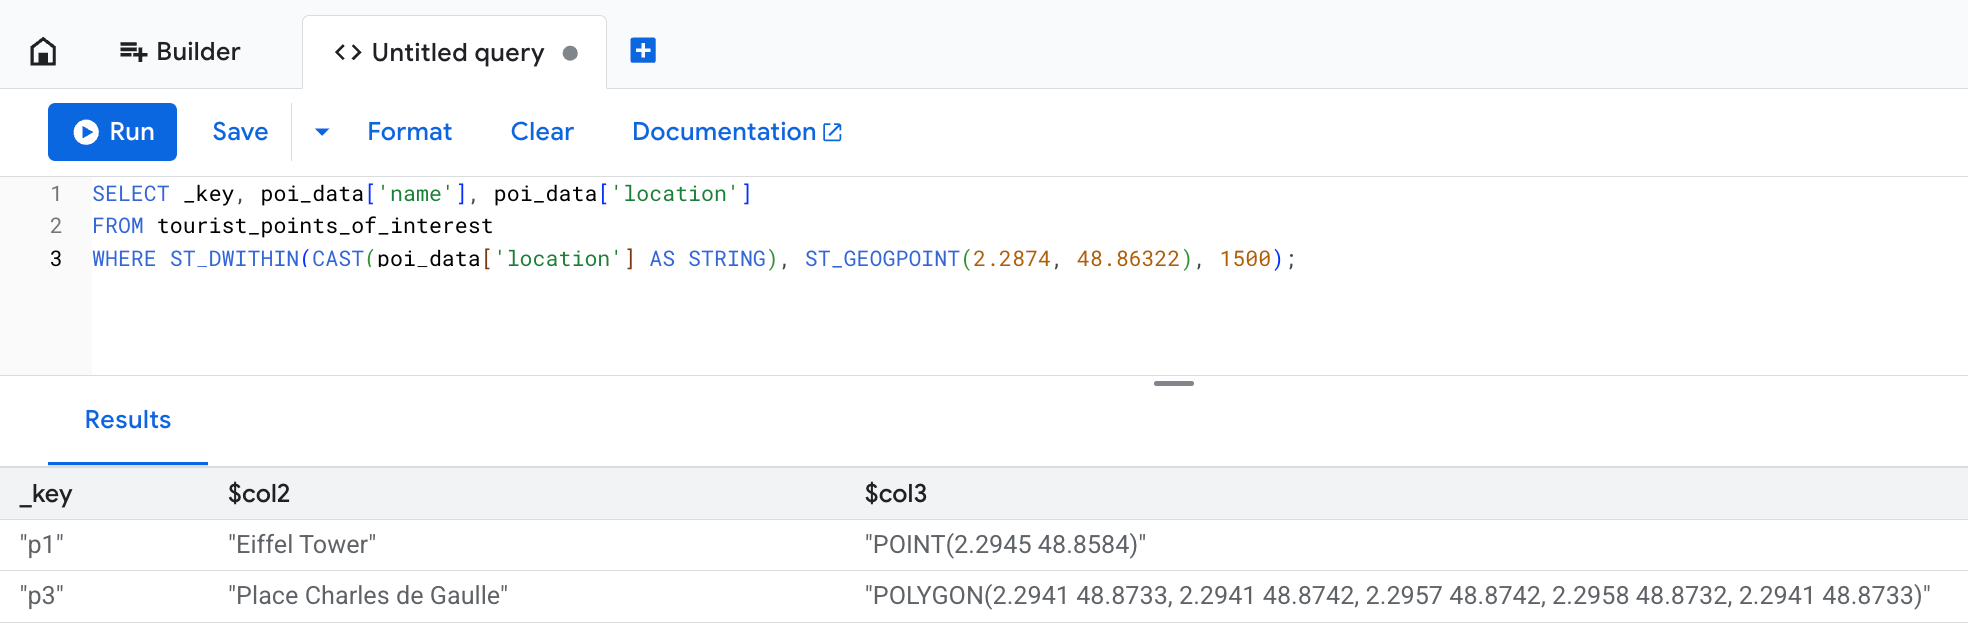
「location」欄會顯示寫入作業中提供的原始文字資料,但 Bigtable 會將其儲存為位元組。在這個範例中,即使「戴高樂廣場」定義為延伸超過 1500 公尺限制的多邊形,仍會納入查詢結果。這是因為如果地理空間實體中任何一點位於預期距離內,ST_DWITHIN 函式就會傳回 true。
進階用法
以下各節說明如何使用地理函式處理複雜情境,例如地理圍欄分析。「查詢最佳化」一節說明如何使用持續具體化檢視區塊來提升效能。
為說明 Bigtable 中地理函式的高階用途,假設您是研究人員,負責監控雪丘島南側的帝企鵝行為。
您的設備會為每隻企鵝提供數百個位置連線偵測 (ping),因此您會建立 penguin_movements 資料表來儲存這些連線偵測 (ping):
| penguin_details | |||
|---|---|---|---|
| 資料列索引鍵 | penguin_id | 時間戳記 | 位置 |
| ping#123 | pen_01 | 2025-12-06 08:15:22+00 | POINT(-57.51 -64.42) |
| ping#124 | pen_01 | 2025-12-06 10:22:05+00 | POINT(-57.55 -64.43) |
| ping#125 | pen_01 | 2025-12-07 12:35:45+00 | POINT(-57.58 -64.41) |
| ping#126 | pen_02 | 2025-12-12 06:05:11+00 | POINT(-57.49 -64.39) |
範例:找出跨越地理圍欄的人
在研究過程中,您觀察到企鵝在特定覓食地附近的行為。以虛擬界線定義的區域通常稱為「地理圍欄」。餵食地點可視為設有地理圍欄的區域。
您想瞭解 2025 年 12 月 3 日是否有企鵝前往覓食地。如要回答這個問題,請使用 ST_CONTAINS 函式,如下所示:
SELECT
  penguin_details['penguin_id'],
  penguin_details['location'],
  penguin_details['timestamp']
FROM
  penguin_movements
WHERE
  penguin_details['timestamp'] >= '2025-12-03 00:00:00 UTC'
  AND penguin_details['timestamp'] < '2025-12-04 00:00:00 UTC'
  -- The feeding ground boundary is defined with a WKT POLYGON entity
  -- Polygon's last point must be equal to its first point to close the loop
  AND ST_CONTAINS(
        ST_GEOGFROMTEXT('POLYGON((-57.21 -64.51, -57.23 -64.55, -57.08 -64.56, -57.06 -64.51, -57.21 -64.51))'),
        ST_GEOGFROMTEXT(CAST(penguin_details['location'] AS STRING))
      )
您會看到類似下列的結果:
+------------+----------------------+------------------------+
| penguin_id |       location       |       timestamp        |
+------------+----------------------+------------------------+
| pen_01     | POINT(-57.15 -64.53) | 2025-12-03 08:15:22+00 |
| pen_02     | POINT(-57.18 -64.54) | 2025-12-03 14:30:05+00 |
| pen_10     | POINT(-57.10 -64.52) | 2025-12-03 11:45:10+00 |
+------------+----------------------+------------------------+
範例:將點轉換為路線
為了更清楚呈現企鵝的移動方式,您決定使用 ST_MAKELINE 函式,將個別位置 ping 整理成 LineStrings,如下所示:
SELECT
  penguin_id,
  DATE(timestamp, 'UTC') AS route_date,
  ST_MAKELINE(ARRAY_AGG(location_cast_to_geog)) AS route
FROM (
  -- Sub-expression to sort all location pings by timestamp
  -- This way you make sure individual points can form a realistic route
  SELECT
    penguin_details['penguin_id'] AS penguin_id,
    -- Extract and cast timestamp once
    CAST(CAST(penguin_details['timestamp'] AS STRING) AS TIMESTAMP) AS timestamp,
    -- Extract and cast location once
    ST_GEOGFROMTEXT(CAST(penguin_details['location'] AS STRING)) AS location_cast_to_geog
  FROM
    penguin_movements
  ORDER BY
    -- Pre-sorts location pings for the ARRAY_AGG function
    penguin_id, timestamp ASC
)
GROUP BY
  penguin_id,
  route_date
透過這項查詢,您可以取得更進階的深入分析資訊,以利研究。展開以下部分以參閱查詢範例和結果。
每隻企鵝的每日移動距離是多少?
如要計算每隻企鵝每天移動的距離,可以使用 ST_LENGTH 函式。
SELECT
  penguin_id,
  route_date,
  ST_LENGTH(route) AS daily_distance_meters
FROM (
  -- Subquery to aggregate points into daily routes
  SELECT
    penguin_id,
    DATE(timestamp, 'UTC') AS route_date,
    ST_MAKELINE(ARRAY_AGG(location_cast_to_geog)) AS route
  FROM (
    -- Sub-expression to sort all location pings by timestamp
    -- This way you make sure individual points can form a realistic route
    SELECT
      penguin_details['penguin_id'] AS penguin_id,
      -- Extract and cast timestamp once
      CAST(CAST(penguin_details['timestamp'] AS STRING) AS TIMESTAMP) AS timestamp,
      -- Extract and cast location once
      ST_GEOGFROMTEXT(CAST(penguin_details['location'] AS STRING)) AS location_cast_to_geog
    FROM
      penguin_movements
    ORDER BY
      -- Pre-sorts location pings for the ARRAY_AGG function
      penguin_id, timestamp ASC
  )
  GROUP BY
    penguin_id,
    route_date
) AS DailyRoutes;
這項查詢會傳回類似下列內容的結果:
+------------+------------+-----------------------+
| penguin_id | route_date | daily_distance_meters |
+------------+------------+-----------------------+
| pen_01     | 2025-12-02 | 15420.7               |
| pen_03     | 2025-12-03 | 22105.1               |
| pen_32     | 2025-12-03 | 9850.3                |
+------------+------------+-----------------------+
每日路線有多少比例位於地理圍欄區域內?
如要回答這個問題,請使用 ST_INTERSECTION 函式篩選結果,檢查企鵝路徑的哪些部分與設有地理圍欄的區域相交。接著,ST_LENGTH 函式可協助計算當天在覓食地移動的距離與總移動距離的比率。
SELECT
  penguin_id,
  route_date,
  ST_LENGTH(ST_INTERSECTION(route, ST_GEOGFROMTEXT('POLYGON((-57.21 -64.51, -57.23 -64.55, -57.08 -64.56, -57.06 -64.51, -57.21 -64.51))'))) / ST_LENGTH(route) AS proportion_in_ground
FROM (
  -- Subquery to aggregate points into daily routes
  SELECT
    penguin_id,
    DATE(timestamp, 'UTC') AS route_date,
    ST_MAKELINE(ARRAY_AGG(location_cast_to_geog)) AS route
  FROM (
    -- Sub-expression to sort all location pings by timestamp
    -- This way you make sure individual points can form a realistic route
    SELECT
      penguin_details['penguin_id'] AS penguin_id,
      -- Extract and cast timestamp once
      CAST(CAST(penguin_details['timestamp'] AS STRING) AS TIMESTAMP) AS timestamp,
      -- Extract and cast location once
      ST_GEOGFROMTEXT(CAST(penguin_details['location'] AS STRING)) AS location_cast_to_geog
    FROM
      penguin_movements
    ORDER BY
      -- Pre-sorts location pings for the ARRAY_AGG function
      penguin_id, timestamp ASC
  )
  GROUP BY
    penguin_id,
    route_date
) AS DailyRoutes
WHERE
  ST_INTERSECTS(route, ST_GEOGFROMTEXT('POLYGON((-57.21 -64.51, -57.23 -64.55, -57.08 -64.56, -57.06 -64.51, -57.21 -64.51))'))
這項查詢會傳回類似下列內容的結果:
+------------+------------+----------------------+
| penguin_id | route_date | proportion_in_ground |
+------------+------------+----------------------+
| pen_01     | 2025-12-03 | 0.652                |
| pen_03     | 2025-12-03 | 0.918                |
| pen_32     | 2025-12-04 | 0.231                |
+------------+------------+----------------------+
使用持續性具體化檢視表最佳化查詢
對大型資料集執行地理空間查詢時,可能需要掃描許多資料列,因此速度較慢。Bigtable 不支援專用的地理空間索引,但您可以透過持續性具體化檢視區塊提升查詢效能。
如要為這類檢視畫面建立專屬資料列索引鍵,您可以將 GEOGRAPHY 類型轉換為 S2 cell。S2 程式庫可讓您對球體幾何圖形執行複雜的三角函數運算。根據地理座標計算距離可能需要大量運算資源。S2 儲存格可以將地球表面上的特定區域表示為 64 位元整數,因此非常適合搭配連續具體化檢視區塊進行地理空間索引。
如要定義 S2 網格,請呼叫 S2_CELLIDFROMPOINT(location, level) 函式,並提供精細度 level 引數。這個引數是介於 0 和 30 之間的數字,可定義每個儲存格的大小。數字越大,儲存格越小。
在企鵝研究範例中,您可以建立持續性具體化檢視,並根據每隻企鵝的位置和時間戳記建立索引:
-- Query used to create the continuous materialized view
SELECT
  -- Create S2 cells for each penguin's location.
  -- Note that the `level` value is the same for each location so that
  -- every cell is the same size. This ensures consistency for your data.
  S2_CELLIDFROMPOINT(ST_GEOGFROMTEXT(CAST(penguin_details['location'] AS STRING)), level => 16) AS s2_cell_id,
  penguin_details['timestamp'] AS observation_time,
  penguin_details['penguin_id'] AS penguin_id,
  penguin_details['location'] AS location
FROM
  penguin_movements
採用兩階段做法,可大幅提升查詢這個檢視區塊的效率,進而解答「誰跨越了地理圍欄?」這個問題。您首先使用連續具體化檢視區塊中的 cell_id 索引,在一般鄰近範圍內快速找出候選資料列,然後對縮減的資料集套用準確的 ST_CONTAINS 函式:
SELECT
  idx.penguin_id,
  idx.location,
  idx.observation_time
FROM
  penguin_s2_time_index AS idx
WHERE
  -- Part one: use an approximate spatial filter and timestamp filter
  -- for fast scans on continuous materialized view keys.
  -- Use the S2_COVERINGCELLIDS function to create an array of S2 cells
  -- that cover the feeding ground polygon. The `level` argument must be the
  -- same value as the one you used to create the continuous materialized view.
  idx.s2_cell_id IN UNNEST(S2_COVERINGCELLIDS(
    ST_GEOGFROMTEXT('POLYGON((-57.21 -64.51, -57.23 -64.55, -57.08 -64.56, -57.06 -64.51, -57.21 -64.51))'),
    min_level => 16,
    max_level => 16,
    max_cells => 500
  ))
  AND idx.observation_time >= '2025-12-03 00:00:00 UTC'
  AND idx.observation_time < '2025-12-04 00:00:00 UTC'
  -- Part two: use ST_CONTAINS() on the returned set to ensure precision.
  -- S2 cells are squares, so they don't equal arbitrary geofence polygons.
  -- You still need to check if a specific point is contained within the area,
  -- but the filter applies to a smaller data set and is much faster.
  AND ST_CONTAINS(ST_GEOGFROMTEXT('POLYGON((-57.21 -64.51, -57.23 -64.55, -57.08 -64.56, -57.06 -64.51, -57.21 -64.51))'), idx.location);
限制
使用地理位置資料時,Bigtable 不支援下列功能:
- 3D 幾何圖形。包括 WKT 格式的「Z」字尾,以及 GeoJSON 格式的高度座標。
- 線性參考系統。包括 WKT 格式的「M」字尾。
- 幾何圖元或多部分幾何圖形以外的 WKT 幾何圖形物件。 具體來說,Bigtable 僅支援 Point、MultiPoint、LineString、MultiLineString、Polygon、MultiPolygon 和 GeometryCollection。
- 系統不支援
ST_CLUSTERDBSCAN函式。
如要瞭解 GeoJSON 和 WKT 輸入格式的特定限制,請參閱 ST_GEOGFROMGEOJSON 和 ST_GEOGFROMTEXT。
後續步驟
- 進一步瞭解可用的地理位置函式。請參閱 GoogleSQL 地理函式總覽。