
您目前查看的是 Apigee 和 Apigee Hybrid 說明文件。
查看
Apigee Edge 說明文件。
問題
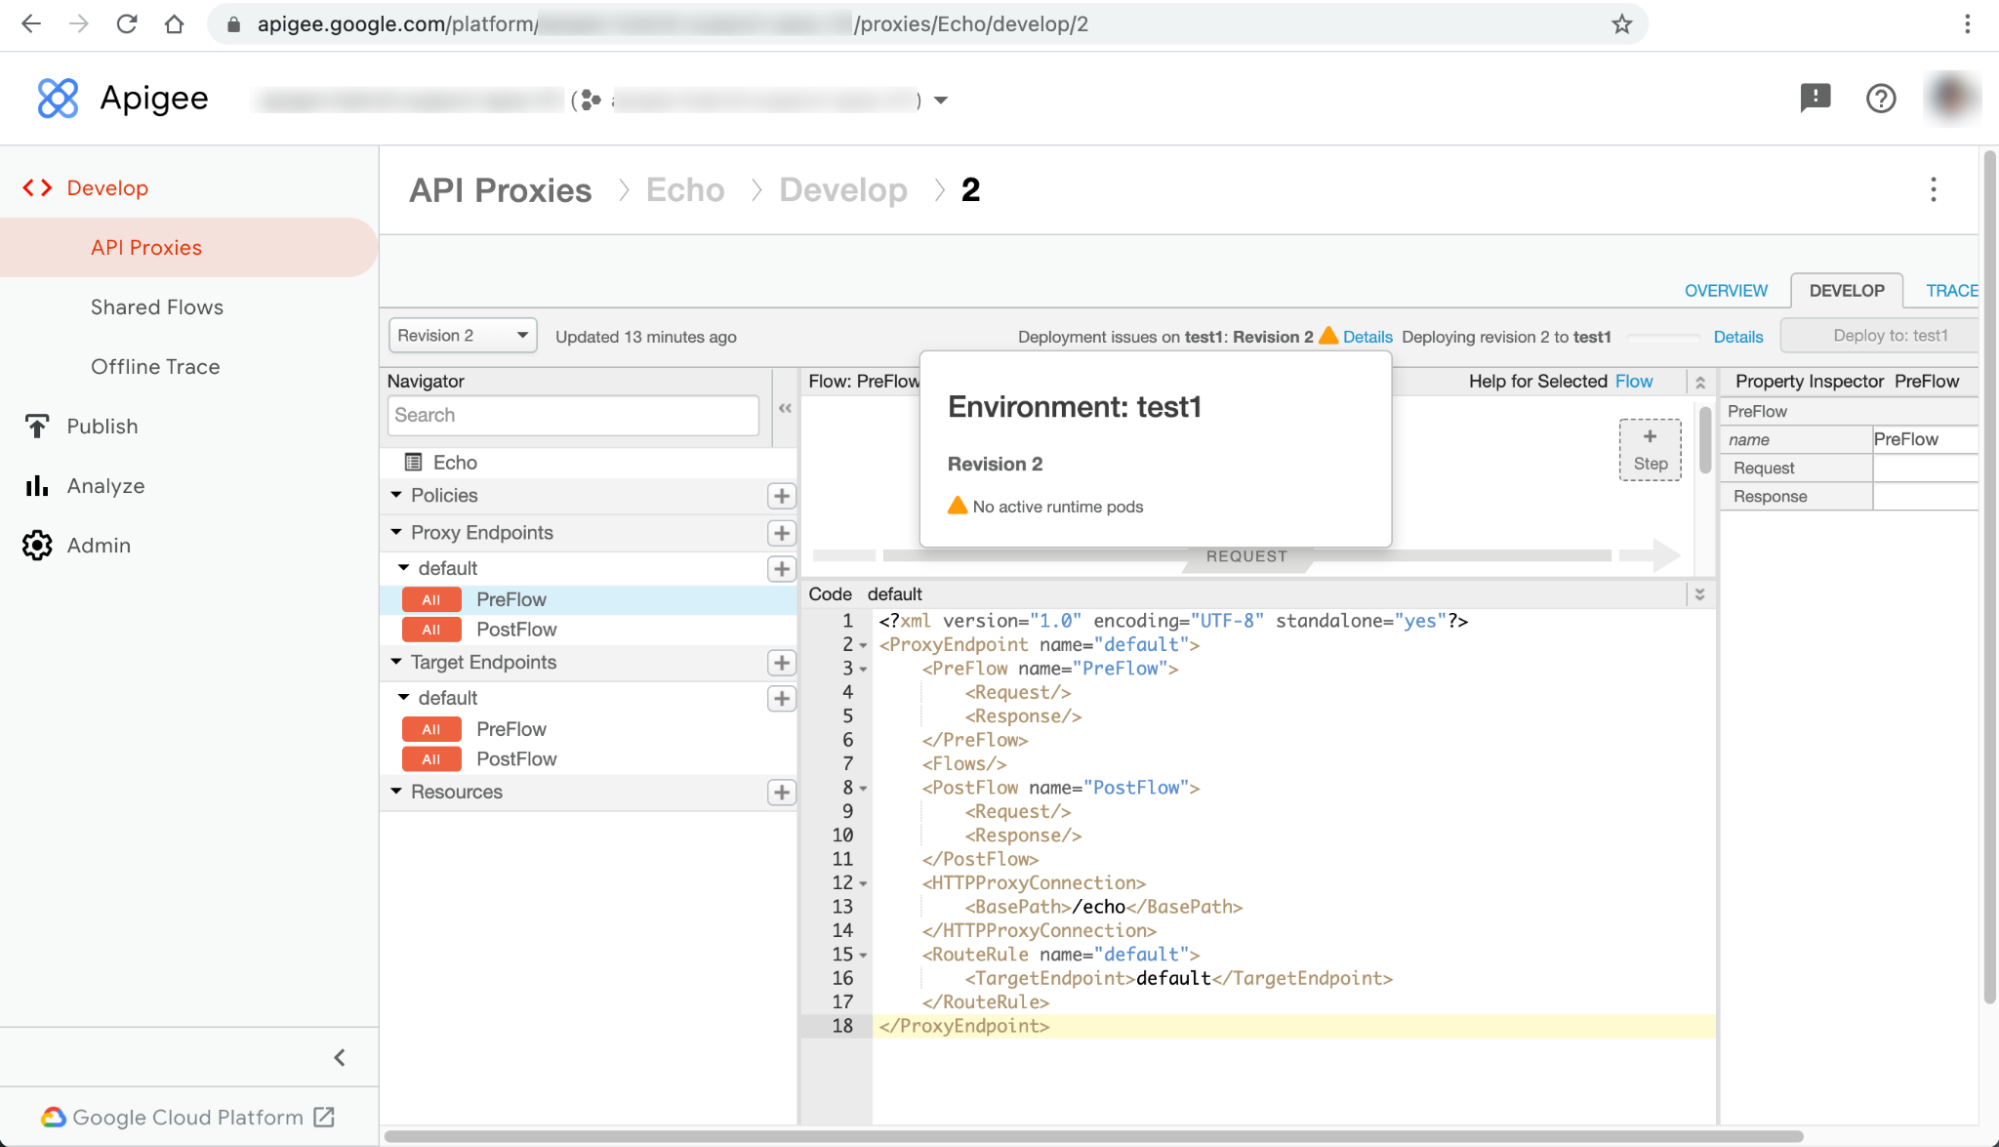
在 Apigee Hybrid 使用者介面中,API Proxy 部署作業失敗,並顯示「沒有有效的執行階段 Pod」警告。
錯誤訊息
API Proxy 頁面上的錯誤訊息「ENVIRONMENT 部署問題:REVISION_NUMBER」旁,會顯示「詳細資料」對話方塊,其中包含「沒有有效的執行階段 pod」警告:
這個問題可能會在 UI 的其他資源頁面中顯示為不同錯誤。以下列舉幾個錯誤訊息範例:
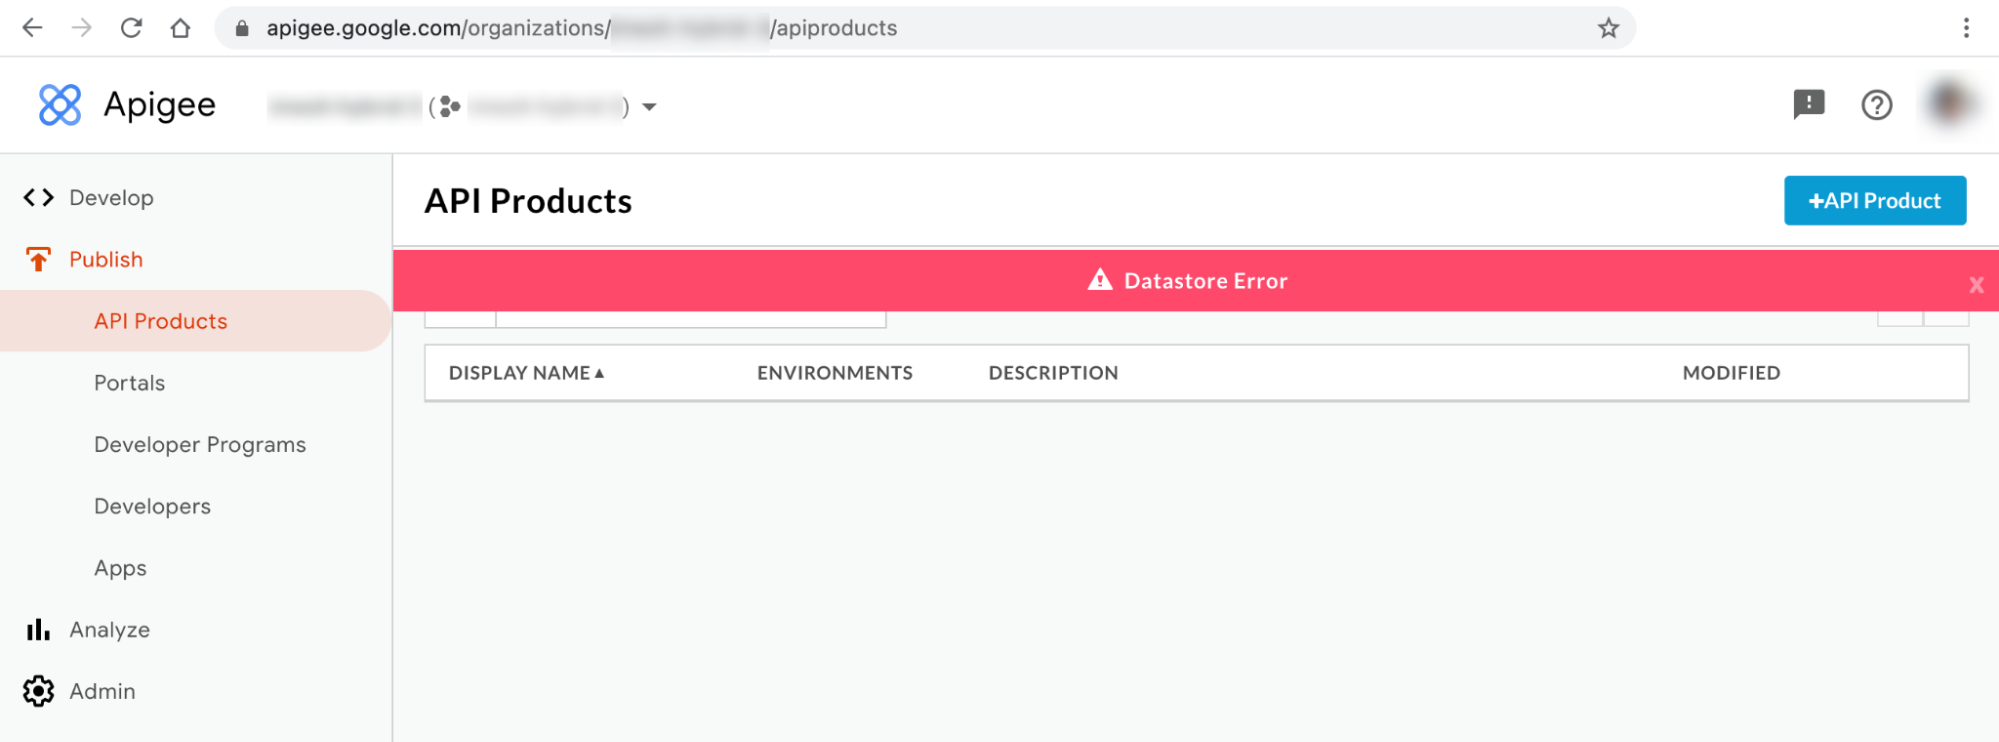
混合式 UI 錯誤訊息 #1:資料儲存庫錯誤
您可能會在混合型使用者介面的「API 產品」和「應用程式」頁面中看到「資料儲存區錯誤」,如下所示:
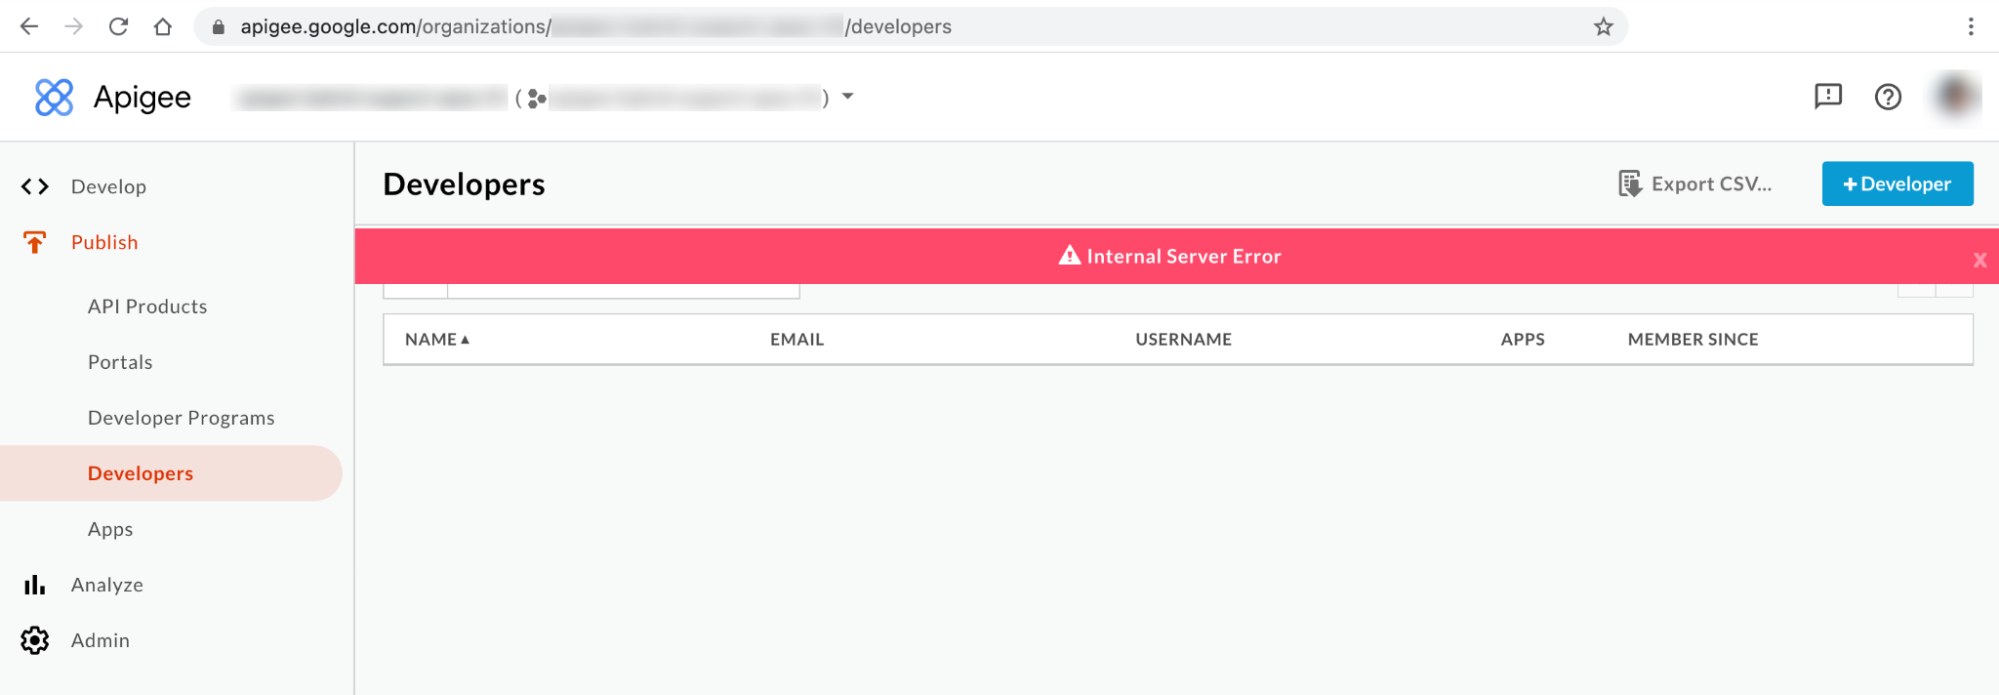
混合式 UI 錯誤訊息 #2:內部伺服器錯誤
您可能會在 UI 的「開發人員」頁面中看到「內部伺服器錯誤」,如下所示:
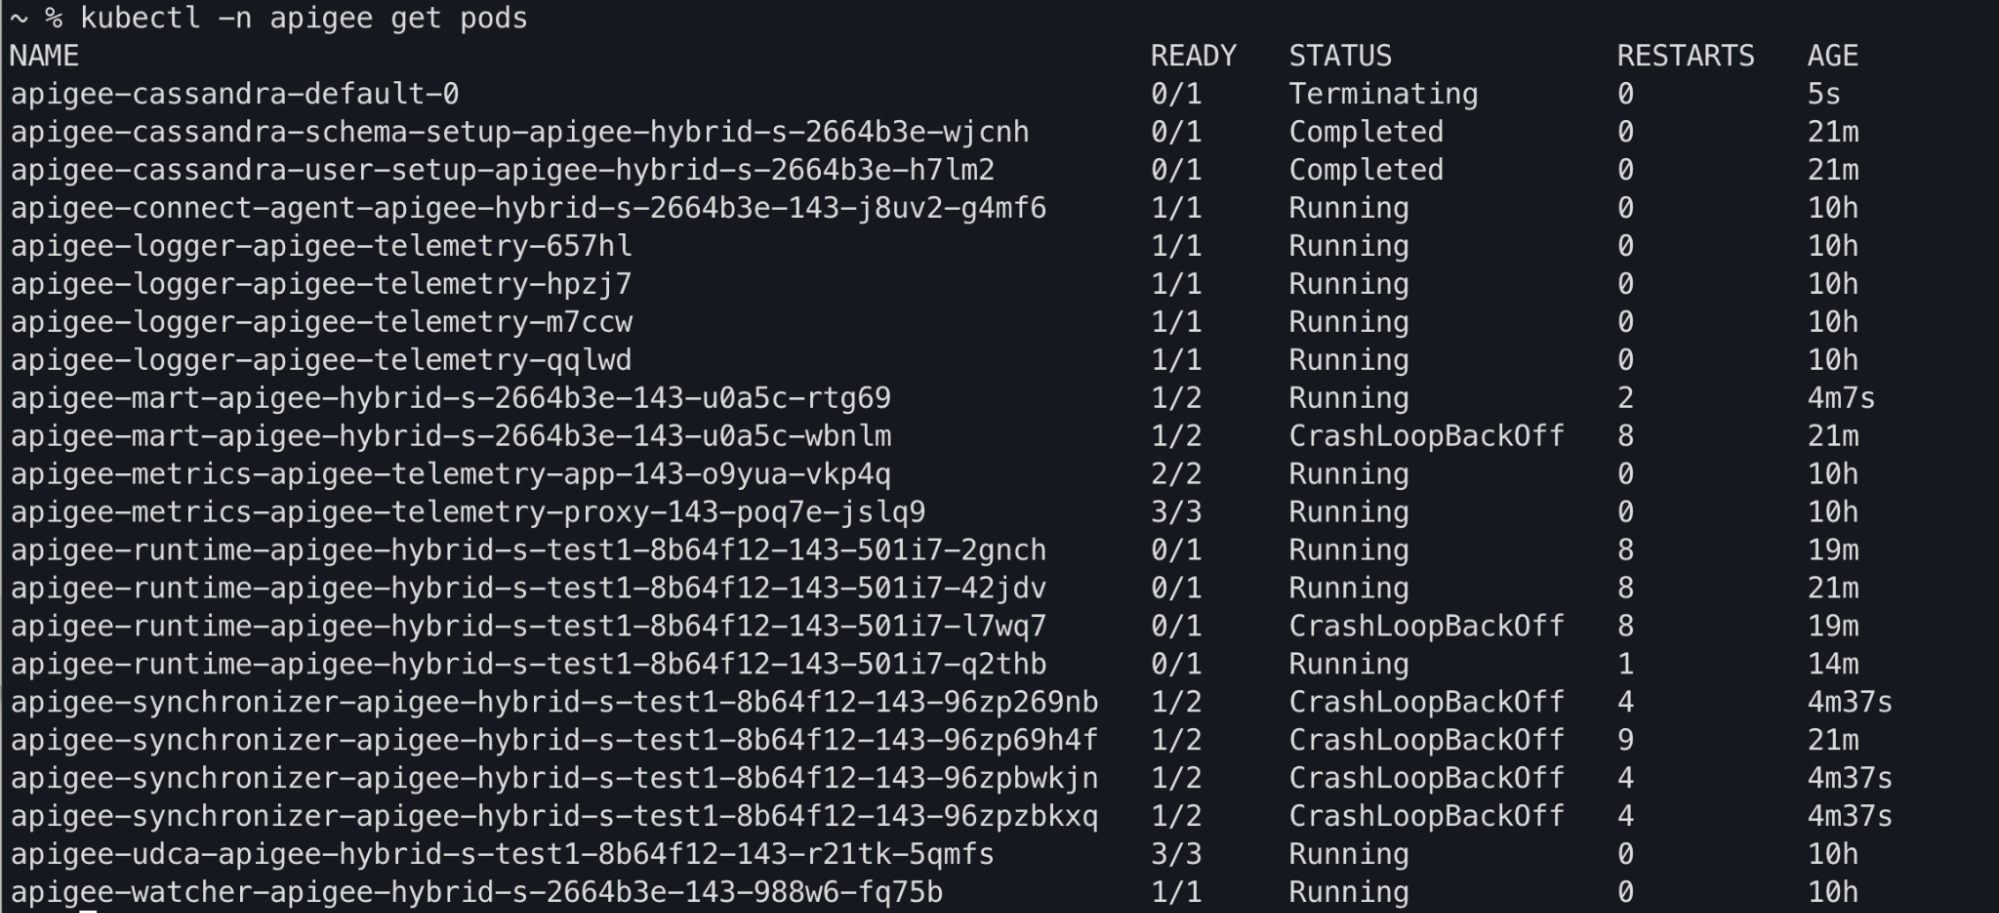
Kubectl 指令輸出
您可能會在 kubectl get pods 指令輸出內容中,看到 apiege-mart、apigee-runtime 和 apigee-
synchronizer Pod 狀態變更為 CrashLoopBackOff :
元件記錄錯誤訊息
在 Apigee Hybrid 版本 >= 1.4.0 中,您會在 apigee-runtime Pod 記錄中看到下列存活探查失敗錯誤:
{"timestamp":"1621575431454","level":"ERROR","thread":"qtp365724939-205","mdc":{"targetpath":"/v1/pr
obes/live"},"logger":"REST","message":"Error occurred : probe failed Probe cps-datastore-
connectivity-liveliness-probe failed due to com.apigee.probe.model.ProbeFailedException{ code =
cps.common.datastoreConnectionNotHealthy, message = Datastore connection not healthy, associated
contexts =
[]}\n\n\tcom.apigee.probe.ProbeAPI.getResponse(ProbeAPI.java:66)\n\tcom.apigee.probe.ProbeAPI.getLiv
eStatus(ProbeAPI.java:55)\n\tsun.reflect.GeneratedMethodAccessor52.invoke(Unknown
Source)\n\tsun.reflect.DelegatingMethodAccessorImpl.invoke(DelegatingMethodAccessorImpl.java:43)\n\t
","context":"apigee-service-
logs","severity":"ERROR","class":"com.apigee.rest.framework.container.ExceptionMapper","method":"toR
esponse"}

{"timestamp":"1621575431454","level":"ERROR","thread":"qtp365724939-205","mdc":{"targetpath":"/v1/pr
obes/live"},"logger":"REST","message":"Returning error response : ErrorResponse{errorCode =
probe.ProbeRunError, errorMessage = probe failed Probe cps-datastore-connectivity-liveliness-probe
failed due to com.apigee.probe.model.ProbeFailedException{ code =
cps.common.datastoreConnectionNotHealthy, message = Datastore connection not healthy, associated
contexts = []}}","context":"apigee-service-
logs","severity":"ERROR","class":"com.apigee.rest.framework.container.ExceptionMapper","method":"toR
esponse"}
在 Apigee Hybrid 版本 >= 1.4.0 中,您會在 apigee-synchronizer Pod 記錄中看到下列Cannot build a cluster without contact points 錯誤:
{"timestamp":"1621575636434","level":"ERROR","thread":"main","logger":"KERNEL.DEPLOYMENT","message":
"ServiceDeployer.deploy() : Got a life cycle exception while starting service [SyncService, Cannot
build a cluster without contact points] : {}","context":"apigee-service-
logs","exception":"java.lang.IllegalArgumentException: Cannot build a cluster without contact
points\n\tat com.datastax.driver.core.Cluster.checkNotEmpty(Cluster.java:134)\n\tat
com.datastax.driver.core.Cluster.<init>(Cluster.java:127)\n\tat
com.datastax.driver.core.Cluster.buildFrom(Cluster.java:193)\n\tat
com.datastax.driver.core.Cluster$Builder.build(Cluster.java:1350)\n\tat
io.apigee.persistence.PersistenceContext.newCluster(PersistenceContext.java:214)\n\tat
io.apigee.persistence.PersistenceContext.<init>(PersistenceContext.java:48)\n\tat
io.apigee.persistence.ApplicationContext.<init>(ApplicationContext.java:19)\n\tat
io.apigee.runtimeconfig.service.RuntimeConfigServiceImpl.<init>(RuntimeConfigServiceImpl.java:75)
\n\tat
io.apigee.runtimeconfig.service.RuntimeConfigServiceFactory.newInstance(RuntimeConfigServiceFactory.
java:99)\n\tat
io.apigee.common.service.AbstractServiceFactory.initializeService(AbstractServiceFactory.java:301)\n
\tat
...","severity":"ERROR","class":"com.apigee.kernel.service.deployment.ServiceDeployer","method":"sta
rtService"}
在 Apigee Hybrid 版本 >= 1.4.0 中,您會在 apigee-mart Pod 記錄中看到下列存活探查失敗錯誤:
{"timestamp":"1621576757592","level":"ERROR","thread":"qtp991916558-144","mdc":{"targetpath":"/v1/pr
obes/live"},"logger":"REST","message":"Error occurred : probe failed Probe cps-datastore-
connectivity-liveliness-probe failed due to com.apigee.probe.model.ProbeFailedException{ code =
cps.common.datastoreConnectionNotHealthy, message = Datastore connection not healthy, associated
contexts =
[]}\n\n\tcom.apigee.probe.ProbeAPI.getResponse(ProbeAPI.java:66)\n\tcom.apigee.probe.ProbeAPI.getLiv
eStatus(ProbeAPI.java:55)\n\tsun.reflect.NativeMethodAccessorImpl.invoke0(Native
Method)\n\tsun.reflect.NativeMethodAccessorImpl.invoke(NativeMethodAccessorImpl.java:62)\n\t","conte
xt":"apigee-service-
logs","severity":"ERROR","class":"com.apigee.rest.framework.container.ExceptionMapper","method":"toR
esponse"}

{"timestamp":"1621576757593","level":"ERROR","thread":"qtp991916558-144","mdc":{"targetpath":"/v1/pr
obes/live"},"logger":"REST","message":"Returning error response : ErrorResponse{errorCode =
probe.ProbeRunError, errorMessage = probe failed Probe cps-datastore-connectivity-liveliness-probe
failed due to com.apigee.probe.model.ProbeFailedException{ code =
cps.common.datastoreConnectionNotHealthy, message = Datastore connection not healthy, associated
contexts = []}}","context":"apigee-service-
logs","severity":"ERROR","class":"com.apigee.rest.framework.container.ExceptionMapper","method":"toR
esponse"}
「沒有有效的執行階段 Pod」錯誤相關資訊
在 Apigee Hybrid 1.4.0 版本中,apigee-runtime 和 apigee-mart Pod 新增了存活探測功能,可檢查 Cassandra Pod 的狀態。如果所有 Cassandra Pod 都無法使用,apigee-runtime 和 apigee-mart Pod 的有效性探測就會失敗。因此,apigee-runtime 和 apigee-mart Pod 會進入 CrashLoopBackOff 狀態,導致 API Proxy 部署失敗,並顯示 No active runtime pods 警告。由於 Cassandra pod 無法使用,apigee-synchronizer pod 也會進入 CrashLoopBackOff 狀態。
可能原因
以下是造成這項錯誤的可能原因:
| 原因 | 說明 |
|---|---|
| Cassandra Pod 已停止運作 | Cassandra Pod 已關閉,因此 apigee-runtime Pod 無法與 Cassandra 資料庫通訊。 |
| 僅使用一個 Pod 設定的 Cassandra 副本 | 只有一個 Cassandra Pod 可能會成為單點故障。 |
原因:Cassandra Pod 已關閉
在 API Proxy 部署程序中,apigee-runtime Pod 會連線至 Cassandra 資料庫,擷取 API Proxy 中定義的資源,例如鍵值對應 (KVM) 和快取。如果沒有任何 Cassandra Pod 正在執行,apigee-runtime Pod 就無法連線至 Cassandra 資料庫。這會導致 API Proxy 部署失敗。
診斷
- 列出 Cassandra Pod:
kubectl -n apigee get pods -l app=apigee-cassandra
輸出內容範例 1:
NAME                         READY   STATUS    RESTARTS   AGE
apigee-cassandra-default-0   0/1     Pending   0          9m23s
輸出內容範例 2:
NAME                 READY   STATUS            RESTARTS   AGE
apigee-cassandra-0   0/1     CrashLoopBackoff  0          10m
- 確認每個 Cassandra Pod 的狀態。所有 Cassandra Pod 的狀態都應為
Running。如果任何 Cassandra Pod 處於不同狀態,這可能是造成這個問題的原因。請按照下列步驟解決問題:
解析度
- 如果任何 Cassandra Pod 處於
Pending狀態,請參閱「 Cassandra Pod 停滯在 Pending 狀態」一文,排解並解決問題。 - 如果任何 Cassandra Pod 處於
CrashLoopBackoff狀態,請參閱「 Cassandra Pod 停滯在 CrashLoopBackoff 狀態」一文,排解並解決問題。輸出內容範例:
kubectl -n apigee get pods -l app=apigee-runtime
NAME                                                           READY   STATUS    RESTARTS   AGE
apigee-runtime-apigee-hybrid-s-test1-8b64f12-143-501i7-2gnch   1/1     Running   13         43m
apigee-runtime-apigee-hybrid-s-test1-8b64f12-143-501i7-42jdv   1/1     Running   13         45m
apigee-runtime-apigee-hybrid-s-test1-8b64f12-143-501i7-l7wq7   1/1     Running   13         43m
apigee-runtime-apigee-hybrid-s-test1-8b64f12-143-501i7-q2thb   1/1     Running   8          38m
kubectl -n apigee get pods -l app=apigee-mart
NAME                                                  READY   STATUS    RESTARTS   AGE
apigee-mart-apigee-hybrid-s-2664b3e-143-u0a5c-rtg69   2/2     Running   8          28m
kubectl -n apigee get pods -l app=apigee-synchronizer
NAME                                                              READY   STATUS    RESTARTS   AGE
apigee-synchronizer-apigee-hybrid-s-test1-8b64f12-143-96zp269nb   2/2     Running   10         29m
apigee-synchronizer-apigee-hybrid-s-test1-8b64f12-143-96zp2w2jp   2/2     Running   0          4m40s
apigee-synchronizer-apigee-hybrid-s-test1-8b64f12-143-96zpkfkvq   2/2     Running   0          4m40s
apigee-synchronizer-apigee-hybrid-s-test1-8b64f12-143-96zpxmzhn   2/2     Running   0          4m40s
原因:Cassandra 副本只設定一個 Pod
如果 Cassandra 副本計數設為 1,執行階段就只會有一個 Cassandra Pod。因此,如果該 Cassandra Pod 在一段時間內無法使用,apigee-runtime Pod 可能會發生連線問題。
診斷
- 取得 Cassandra StatefulSet,並檢查目前的副本計數:
kubectl -n apigee get statefulsets -l app=apigee-cassandra
輸出內容範例:
NAME                               READY           AGE
apigee-cassandra-default           1/1             21m
- 如果副本數量設為 1,請按照下列步驟將副本數量調高。
解析度
Apigee Hybrid 非正式環境部署作業的 Cassandra 副本數量可能設為 1。如果 Cassandra 的高可用性在非正式版部署中很重要,請將副本數增加至 3,以解決這個問題。
請按照下列步驟解決這個問題:
- 更新
overrides.yaml檔案,並將 Cassandra 副本數設為 3:cassandra: replicaCount: 3
如需 Cassandra 設定資訊,請參閱 設定屬性參考資料。
- 使用 Helm 套用上述設定:
模擬測試:
  helm upgrade datastore apigee-datastore/ \
  --install \
  --namespace APIGEE_NAMESPACE \
  --atomic \
  -f OVERRIDES_FILE \
  --dry-run
安裝 Helm 資訊套件
  helm upgrade datastore apigee-datastore/ \
  --install \
  --namespace APIGEE_NAMESPACE \
  --atomic \
  -f OVERRIDES_FILE
- 取得 Cassandra StatefulSet,並檢查目前的副本計數:
kubectl -n get statefulsets -l app=apigee-cassandra
輸出內容範例:
NAME                              READY         AGE
apigee-cassandra-default          3/3           27m
- 取得 Cassandra Pod 並檢查目前的執行個體數量。如果所有 Pod 尚未準備就緒且處於
Running狀態,請等待系統建立並啟用新的 Cassandra Pod:kubectl -n get pods -l app=apigee-cassandra
輸出內容範例:
NAME                         READY   STATUS    RESTARTS   AGE
apigee-cassandra-default-0   1/1     Running   0          29m
apigee-cassandra-default-1   1/1     Running   0          21m
apigee-cassandra-default-2   1/1     Running   0          19m
輸出內容範例:
kubectl -n apigee get pods -l app=apigee-runtime
NAME                                                           READY   STATUS    RESTARTS   AGE
apigee-runtime-apigee-hybrid-s-test1-8b64f12-143-501i7-2gnch   1/1     Running   13         43m
apigee-runtime-apigee-hybrid-s-test1-8b64f12-143-501i7-42jdv   1/1     Running   13         45m
apigee-runtime-apigee-hybrid-s-test1-8b64f12-143-501i7-l7wq7   1/1     Running   13         43m
apigee-runtime-apigee-hybrid-s-test1-8b64f12-143-501i7-q2thb   1/1     Running   8          38m
kubectl -n apigee get pods -l app=apigee-mart
NAME                                                  READY   STATUS    RESTARTS   AGE
apigee-mart-apigee-hybrid-s-2664b3e-143-u0a5c-rtg69   2/2     Running   8          28m
kubectl -n apigee get pods -l app=apigee-synchronizer
NAME                                                              READY   STATUS    RESTARTS   AGE
apigee-synchronizer-apigee-hybrid-s-test1-8b64f12-143-96zp269nb   2/2     Running   10         29m
apigee-synchronizer-apigee-hybrid-s-test1-8b64f12-143-96zp2w2jp   2/2     Running   0          4m40s
apigee-synchronizer-apigee-hybrid-s-test1-8b64f12-143-96zpkfkvq   2/2     Running   0          4m40s
apigee-synchronizer-apigee-hybrid-s-test1-8b64f12-143-96zpxmzhn   2/2     Running   0          4m40s
必須收集診斷資訊
如果按照上述操作說明後問題仍未解決,請收集下列診斷資訊,然後與 Google Cloud Customer Care 團隊聯絡。
- Google Cloud 專案 ID
- Apigee Hybrid/Apigee 機構
- 如果是 Apigee Hybrid:
overrides.yaml,並遮蓋任何敏感資訊 - 所有命名空間中的 Kubernetes Pod 狀態:
kubectl get pods -A > kubectl-pod-status`date +%Y.%m.%d_%H.%M.%S`.txt
- Kubernetes 叢集資訊傾印:
# generate kubernetes cluster-info dump
kubectl cluster-info dump -A --output-directory=/tmp/kubectl-cluster-info-dump
# zip kubernetes cluster-info dump
zip -r kubectl-cluster-info-dump`date +%Y.%m.%d_%H.%M.%S`.zip /tmp/kubectl-cluster-info-dump/*