
This document shows you how to observe your DNS traffic using GKE DNS metrics. GKE DNS metrics are available in the Google Cloud console for clusters running the following versions:
for enhanced KubeDNS, GKE version 1.36 or later
for NodeLocalDNS, GKE version 1.35.2-gke.1090000 or later
View DNS metrics
You can view GKE DNS metrics in the Google Cloud console in the Metrics Explorer, in the following ways:
Use the GKE DNS observability dashboard
Google provides a predefined DNS dashboard at Monitoring > Dashboards > GKE DNS Observability - Cluster View. This dashboard shows KubeDNS and NodeLocalDNS metrics. You need clusters that use NodeLocalDNS or KubeDNS to see the dashboard.
Examples of using the GKE DNS Observability dashboard:
First, navigate to Monitoring > Dashboards, as shown in the following image:
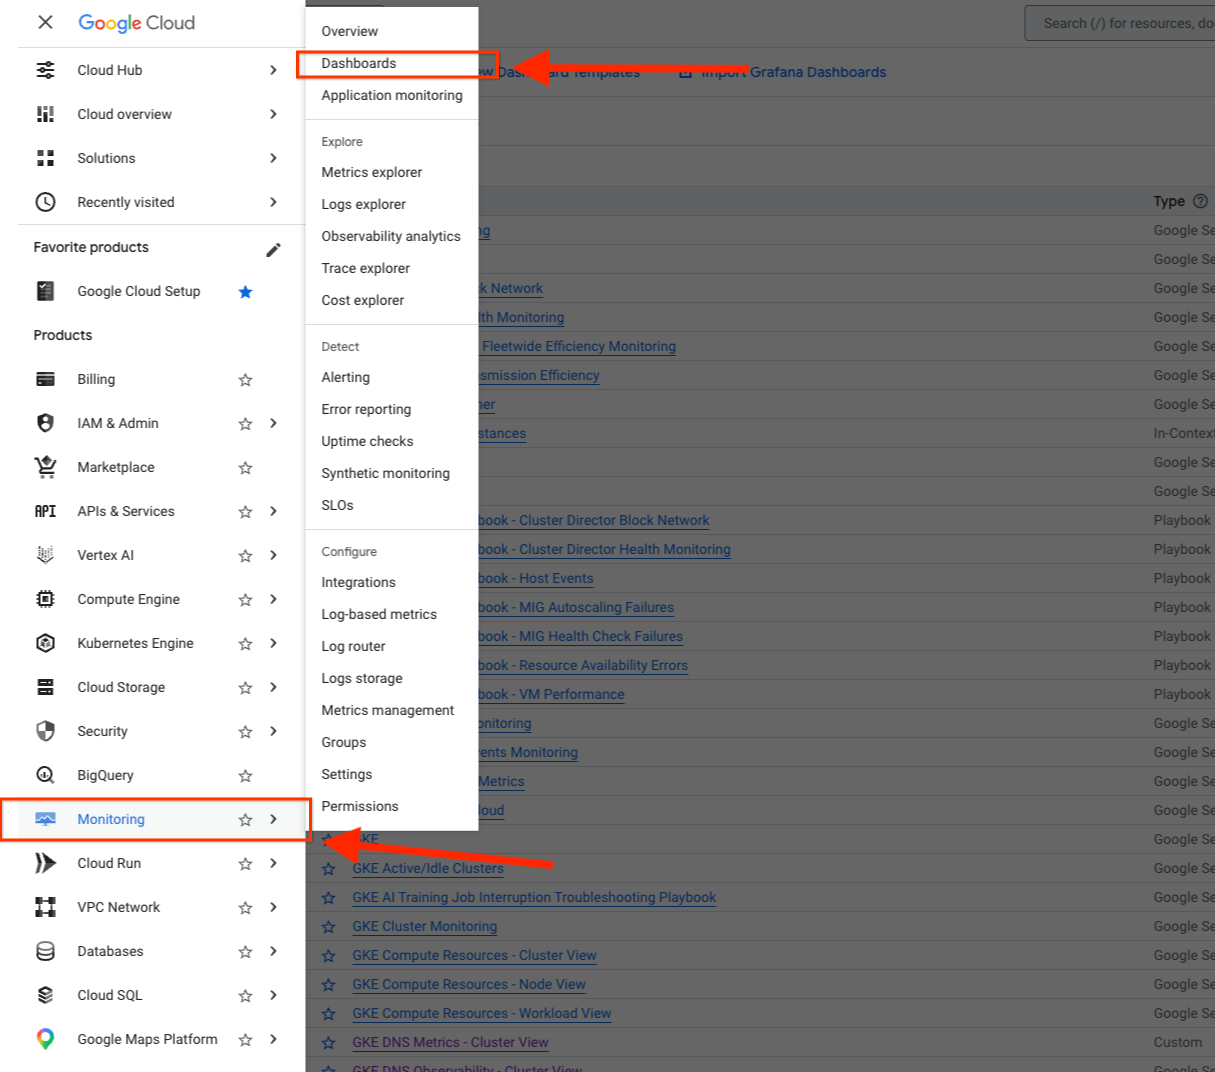
This screenshot shows the Google Cloud console navigation menu on the left. The Monitoring section is expanded, and Dashboards is highlighted to guide your navigation.
Then navigate to the dashboard GKE DNS Observability - Cluster View:
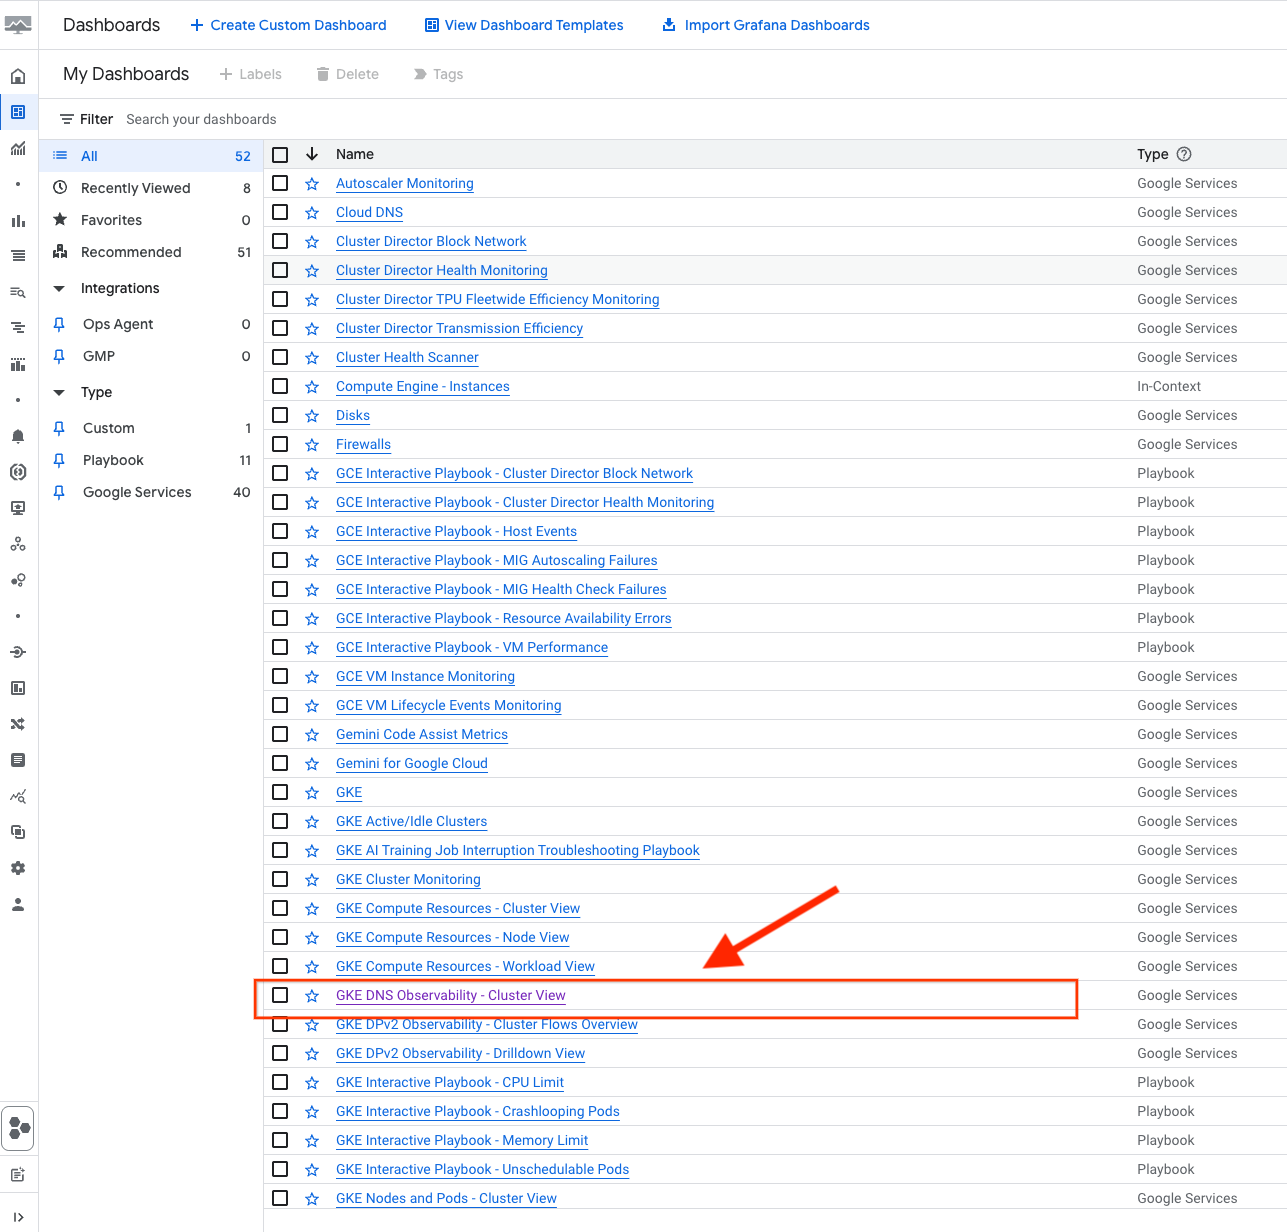
This screenshot displays the Dashboards directory page, with the GKE DNS Observability - Cluster View dashboard highlighted in the list of available dashboards. Clicking this link opens the cluster-level DNS metrics visualization.
Create customized dashboards
To create custom dashboards and set alerts similar to any of the metrics that you've been monitoring, you can use Google Cloud Observability tools such as Cloud Monitoring Metrics Explorer.
Query DNS observability metrics
To view GKE DNS metrics for your clusters, perform the following steps in the Google Cloud console in the Metrics Explorer:
Go to the Monitoring > Metrics Explorer page.
In the Select a metric field, filter for
kubernetes.io/networking/dns/.The KubeDNS metrics are under the Kubernetes Container resource and NodeLocalDNS metrics are under the Kubernetes Node resource.
(Optional) Choose any selected filters based on Labels.
Examples of KubeDNS metrics and NodeLocalDNS metrics on the Google Cloud console under Monitoring > Metrics Explorer:
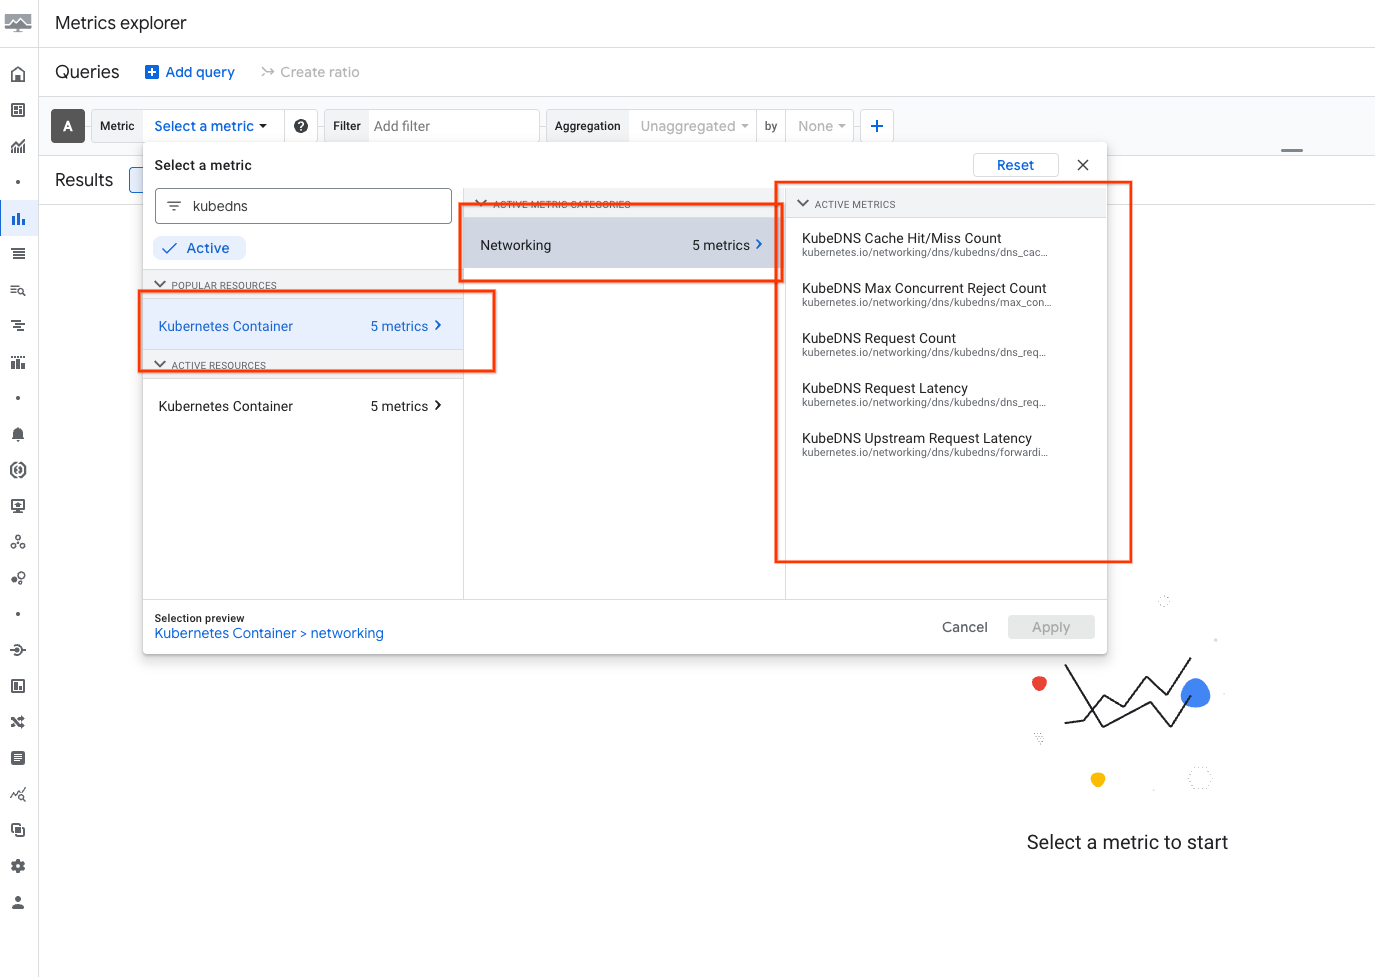
This screenshot displays the Metrics Explorer page configured to query
KubeDNS metrics. The Select a metric field shows the filtered path
kubernetes.io/networking/dns/kubedns/, and the resulting chart displays
active time-series graphs of KubeDNS requests and cache statuses.
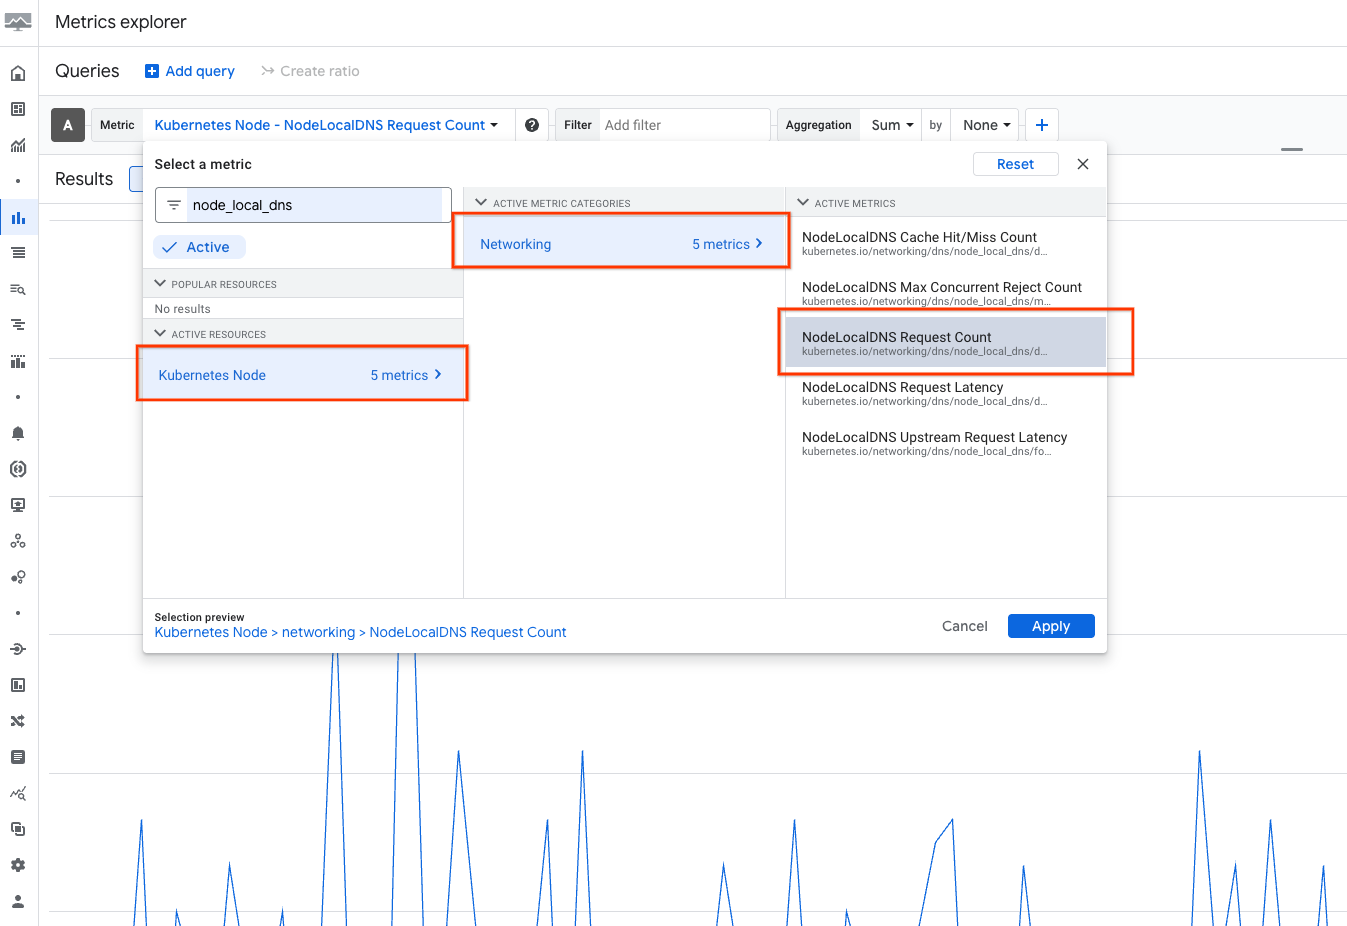
This screenshot displays the Metrics Explorer page configured to query
NodeLocalDNS metrics. The query specifies the
kubernetes.io/networking/dns/node_local_dns/ metric path under the Kubernetes
Node resource, and the chart highlights active time-series graphs representing
local DNS requests and latency data.
List of GKE DNS metrics
The following metrics are available for monitoring GKE DNS performance and health.
KubeDNS metrics
In GKE version 1.36 and later, the following metrics are available for KubeDNS:
| Metric type | Description |
|---|---|
kubernetes.io/networking/dns/kubedns/dns_request_count |
Total number of DNS requests received by KubeDNS. |
kubernetes.io/networking/dns/kubedns/dns_request_latencies |
Histogram of the time each request took to resolve. |
kubernetes.io/networking/dns/kubedns/dns_cache_request_count |
Counter of DNS requests filtered by cache status (hit or miss). |
kubernetes.io/networking/dns/kubedns/forwarding_request_latencies |
Histogram of the time each forwarded request took. |
kubernetes.io/networking/dns/kubedns/max_concurrent_rejected_request_count |
Queries rejected because the number of concurrent queries were at maximum. |
To calculate the forwarding_request_count metric, you can use the kubernetes.io/networking/dns/kubedns/forwarding_request_latencies metric in the following query:
sum by (cluster_name) (rate({"kubernetes.io/networking/dns/kubedns/forwarding_request_latencies_count"}[${__interval}])).
By default, the Google Cloud console applies a rate operation to the request_count metrics. You can disable this from the PromQL source.
NodeLocalDNS metrics
In GKE version 1.35.2-gke.1090000 and later, the following metrics are available for NodeLocal DNSCache:
| Metric type | Description |
|---|---|
kubernetes.io/networking/dns/node_local_dns/dns_request_count |
Total number of DNS requests received by NodeLocal DNSCache. |
kubernetes.io/networking/dns/node_local_dns/dns_request_latencies |
Histogram of the time each request took to resolve. |
kubernetes.io/networking/dns/node_local_dns/dns_cache_request_count |
Counter of DNS requests filtered by cache status (hit or miss). |
kubernetes.io/networking/dns/node_local_dns/forwarding_request_latencies |
Histogram of the time each forwarded request took. |
kubernetes.io/networking/dns/node_local_dns/max_concurrent_rejected_request_count |
Queries rejected because the number of concurrent queries were at maximum. |
To calculate the value of the forwarding_request_count metric, you can use
the kubernetes.io/networking/dns/node_local_dns/forwarding_request_latencies
metric in the following query:
sum by (cluster_name) (rate({"kubernetes.io/networking/dns/node_local_dns/forwarding_request_latencies_count"}[${__interval}])).
Note that when viewing those metrics,
Google Cloud console automatically applies a rate operation to the request_count
metrics, which can be disabled from the PromQL source.