
This document guides you through deploying a sample application across two GKE clusters in different regions, and shows how multi-cluster Gateway intelligently routes traffic when it exceeds Service capacity limits.
Capacity-based load balancing is a feature of multi-cluster Gateways that helps you build highly reliable and resilient applications. By defining the capacity of your Services, you can protect them from being overloaded and help ensure a consistent experience for your users. When a Service in one cluster reaches its capacity, the load balancer automatically redirects traffic to another cluster with available capacity. For more information about traffic management, see GKE traffic management.
In this tutorial, you use a sample store application to simulate a real-world
scenario where an online shopping service is owned and operated by separate
teams and deployed across a fleet of
shared GKE clusters.
Before you begin
Multi-cluster Gateways require some environmental preparation before they can be deployed. Before you proceed, follow the steps in Prepare your environment for multi-cluster Gateways:
Deploy GKE clusters.
Register your clusters to a fleet (if they aren't already).
Enable the multi-cluster Service and multi-cluster Gateway controllers.
Finally, review the GKE Gateway controller limitations and known issues before you use the controller in your environment.
Deploy capacity-based load balancing
The exercise in this section demonstrates global load balancing and Service capacity concepts by deploying an application across two GKE clusters in different regions. Generated traffic is sent at various request per second (RPS) levels to show how traffic is load balanced across clusters and regions.
The following diagram shows the topology that you will deploy and how traffic overflows between clusters and regions when traffic has exceeded Service capacity:

Prepare your environment
Follow Prepare your environment for multi-cluster Gateways to prepare your environment.
Confirm that the GatewayClass resources are installed on the config cluster:
kubectl get gatewayclasses --context=gke-west-1The output is similar to the following:
NAME                                  CONTROLLER                  ACCEPTED   AGE
gke-l7-global-external-managed        networking.gke.io/gateway   True       16h
gke-l7-global-external-managed-mc     networking.gke.io/gateway   True       14h
gke-l7-gxlb                           networking.gke.io/gateway   True       16h
gke-l7-gxlb-mc                        networking.gke.io/gateway   True       14h
gke-l7-regional-external-managed      networking.gke.io/gateway   True       16h
gke-l7-regional-external-managed-mc   networking.gke.io/gateway   True       14h
gke-l7-rilb                           networking.gke.io/gateway   True       16h
gke-l7-rilb-mc                        networking.gke.io/gateway   True       14h
Deploy an application
Deploy the sample web application server to both clusters:
kubectl apply --context gke-west-1 -f https://raw.githubusercontent.com/GoogleCloudPlatform/gke-networking-recipes/master/gateway/docs/store-traffic-deploy.yaml
kubectl apply --context gke-east-1 -f https://raw.githubusercontent.com/GoogleCloudPlatform/gke-networking-recipes/master/gateway/docs/store-traffic-deploy.yaml
The output is similar to the following:
namespace/store created
deployment.apps/store created
Deploy a Service, Gateway, and HTTPRoute
Apply the following
Servicemanifest to bothgke-west-1andgke-east-1clusters:cat << EOF | kubectl apply --context gke-west-1 -f - apiVersion: v1 kind: Service metadata: name: store namespace: traffic-test annotations: networking.gke.io/max-rate-per-endpoint: "10" spec: ports: - port: 8080 targetPort: 8080 name: http selector: app: store type: ClusterIP --- kind: ServiceExport apiVersion: net.gke.io/v1 metadata: name: store namespace: traffic-test EOFcat << EOF | kubectl apply --context gke-east-1 -f - apiVersion: v1 kind: Service metadata: name: store namespace: traffic-test annotations: networking.gke.io/max-rate-per-endpoint: "10" spec: ports: - port: 8080 targetPort: 8080 name: http selector: app: store type: ClusterIP --- kind: ServiceExport apiVersion: net.gke.io/v1 metadata: name: store namespace: traffic-test EOFThe Service is annotated with
max-rate-per-endpointset to 10 requests per seconds. With 2 replicas per cluster, each Service has 20 RPS of capacity per cluster.For more information on how to choose a Service capacity level for your Service, see Determine your Service's capacity.
Apply the following
Gatewaymanifest to the config cluster,gke-west-1in this example:cat << EOF | kubectl apply --context gke-west-1 -f - kind: Gateway apiVersion: gateway.networking.k8s.io/v1 metadata: name: store namespace: traffic-test spec: gatewayClassName: gke-l7-global-external-managed-mc listeners: - name: http protocol: HTTP port: 80 allowedRoutes: kinds: - kind: HTTPRoute EOFThe manifest describes an external, global, multi-cluster Gateway that deploys an external Application Load Balancer with a publicly accessible IP address.
Apply the following
HTTPRoutemanifest to the config cluster,gke-west-1in this example:cat << EOF | kubectl apply --context gke-west-1 -f - kind: HTTPRoute apiVersion: gateway.networking.k8s.io/v1 metadata: name: store namespace: traffic-test labels: gateway: store spec: parentRefs: - kind: Gateway namespace: traffic-test name: store rules: - backendRefs: - name: store group: net.gke.io kind: ServiceImport port: 8080 EOFThe manifest describes an HTTPRoute that configures the Gateway with a routing rule that directs all traffic to the store ServiceImport. The
storeServiceImport groups thestoreService Pods across both clusters and allows them to be addressed by the load balancer as a single Service.You can check the Gateway's events after a few minutes to see if it has finished deploying:
kubectl describe gateway store -n traffic-test --context gke-west-1The output is similar to the following:
...
Status:
  Addresses:
    Type:   IPAddress
    Value:  34.102.159.147
  Conditions:
    Last Transition Time:  2023-10-12T21:40:59Z
    Message:               The OSS Gateway API has deprecated this condition, do not depend on it.
    Observed Generation:   1
    Reason:                Scheduled
    Status:                True
    Type:                  Scheduled
    Last Transition Time:  2023-10-12T21:40:59Z
    Message:
    Observed Generation:   1
    Reason:                Accepted
    Status:                True
    Type:                  Accepted
    Last Transition Time:  2023-10-12T21:40:59Z
    Message:
    Observed Generation:   1
    Reason:                Programmed
    Status:                True
    Type:                  Programmed
    Last Transition Time:  2023-10-12T21:40:59Z
    Message:               The OSS Gateway API has altered the "Ready" condition semantics and reservedit for future use.  GKE Gateway will stop emitting it in a future update, use "Programmed" instead.
    Observed Generation:   1
    Reason:                Ready
    Status:                True
    Type:                  Ready
  Listeners:
    Attached Routes:  1
    Conditions:
      Last Transition Time:  2023-10-12T21:40:59Z
      Message:
      Observed Generation:   1
      Reason:                Programmed
      Status:                True
      Type:                  Programmed
      Last Transition Time:  2023-10-12T21:40:59Z
      Message:               The OSS Gateway API has altered the "Ready" condition semantics and reservedit for future use.  GKE Gateway will stop emitting it in a future update, use "Programmed" instead.
      Observed Generation:   1
      Reason:                Ready
      Status:                True
      Type:                  Ready
    Name:                    http
    Supported Kinds:
      Group:  gateway.networking.k8s.io
      Kind:   HTTPRoute
Events:
  Type    Reason  Age                  From                   Message
  ----    ------  ----                 ----                   -------
  Normal  ADD     12m                  mc-gateway-controller  traffic-test/store
  Normal  SYNC    6m43s                mc-gateway-controller  traffic-test/store
  Normal  UPDATE  5m40s (x4 over 12m)  mc-gateway-controller  traffic-test/store
  Normal  SYNC    118s (x6 over 10m)   mc-gateway-controller  SYNC on traffic-test/store was a success
This output shows that the Gateway has deployed successfully. It might still take a few minutes for traffic to start passing after the Gateway has deployed. Take note of the IP address in this output, as it is used in a following step.
Confirm traffic
Confirm that traffic is passing to the application by testing the Gateway IP address with a curl command:
curl GATEWAY_IP_ADDRESS
The output is similar to the following:
{
  "cluster_name": "gke-west-1",
  "host_header": "34.117.182.69",
  "pod_name": "store-54785664b5-mxstv",
  "pod_name_emoji": "👳🏿",
  "project_id": "project",
  "timestamp": "2021-11-01T14:06:38",
  "zone": "us-west1-a"
}
This output shows the Pod metadata, which indicates the region where the request was served from.
Verify traffic using load testing
To verify the load balancer is working, you can deploy a traffic generator in
your gke-west-1 cluster. The traffic generator generates traffic at different
levels of load to demonstrate the capacity and overflow capabilities of the load
balancer. The following steps demonstrate three levels of load:
- 10 RPS, which is under the capacity for the store Service in
gke-west-1. - 30 RPS, which is over capacity for the
gke-west-1store Service and causes traffic overflow togke-east-1. - 60 RPS, which is over capacity for the Services in both clusters.
Configure dashboard
Get the name of the underying URLmap for your Gateway:
kubectl get gateway store -n traffic-test --context=gke-west-1 -o=jsonpath="{.metadata.annotations.networking\.gke\.io/url-maps}"The output is similar to the following:
/projects/PROJECT_NUMBER/global/urlMaps/gkemcg1-traffic-test-store-armvfyupay1tIn the Google Cloud console, go to the Metrics explorer page.
Under Select a metric, click CODE: MQL.
Enter the following query to observe traffic metrics for the store Service across your two clusters:
fetch https_lb_rule
| metric 'loadbalancing.googleapis.com/https/backend_request_count'
| filter (resource.url_map_name == 'GATEWAY_URL_MAP')
| align rate(1m)
| every 1m
| group_by [resource.backend_scope],
    [value_backend_request_count_aggregate:
        aggregate(value.backend_request_count)]
Replace
GATEWAY_URL_MAPwith the URLmap name from the previous step.Click Run query. Wait at least 5 minutes after deploying the load generator in the next section for the metrics to display in the chart.
Test with 10 RPS
Deploy a Pod to your
gke-west-1cluster:kubectl run --context gke-west-1 -i --tty --rm loadgen \ --image=cyrilbkr/httperf \ --restart=Never \ -- /bin/sh -c 'httperf \ --server=GATEWAY_IP_ADDRESS \ --hog --uri="/zone" --port 80 --wsess=100000,1,1 --rate 10'Replace
GATEWAY_IP_ADDRESSwith the Gateway IP address from the previous step.The output is similar to the following, indicating that the traffic generator is sending traffic:
If you don't see a command prompt, try pressing enter.The load generator continuously sends 10 RPS to the Gateway. Even though traffic is coming from inside a Google Cloud region, the load balancer treats it as client traffic coming from the US West Coast. To simulate a realistic client diversity, the load generator sends each HTTP request as a new TCP connection, which means traffic is distributed across backend Pods more evenly.
The generator takes up to 5 minutes to generate traffic for the dashboard.
View your Metrics explorer dashboard. Two lines appear, indiciating how much traffic is load balanced to each of the clusters:
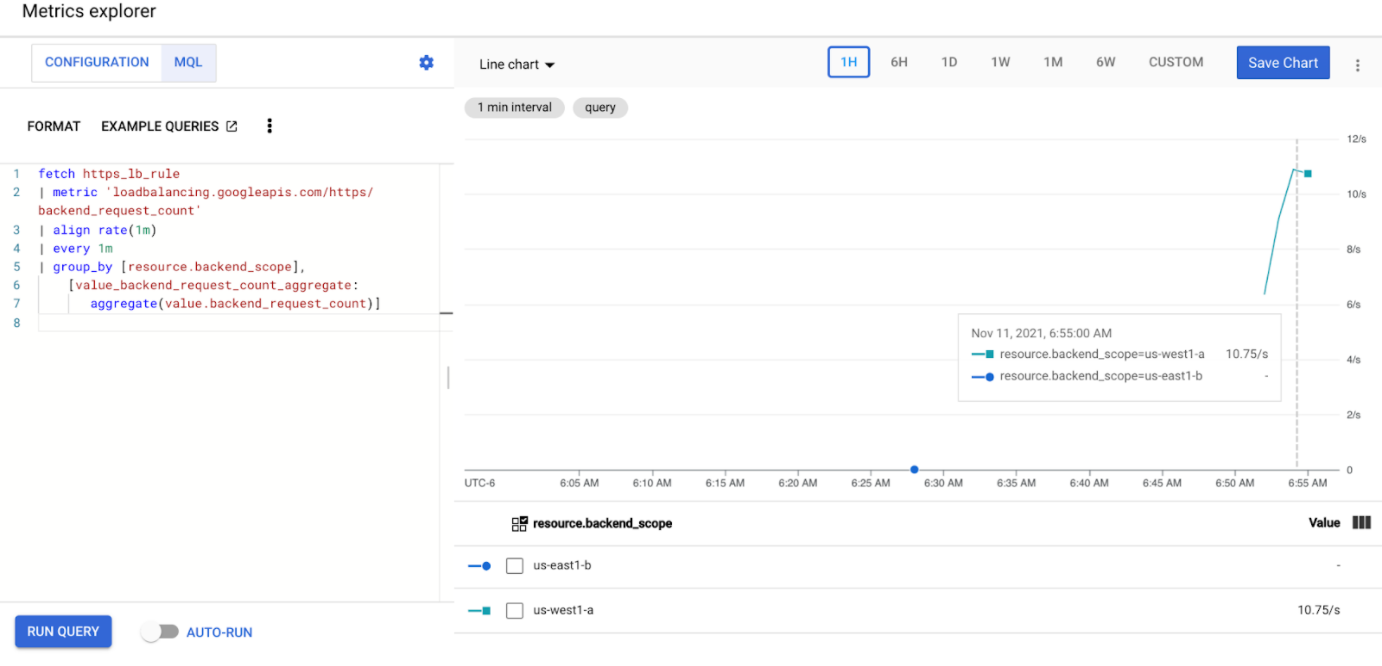
You should see that
us-west1-ais receiving approximately 10 RPS of traffic whileus-east1-bis not receiving any traffic. Because the traffic generator is running inus-west1, all traffic is sent to the Service in thegke-west-1cluster.Stop the load generator using Ctrl+C, then delete the pod:
kubectl delete pod loadgen --context gke-west-1
Test with 30 RPS
Deploy the load generator again, but configured to send 30 RPS:
kubectl run --context gke-west-1 -i --tty --rm loadgen  \
    --image=cyrilbkr/httperf  \
    --restart=Never  \
    -- /bin/sh -c 'httperf  \
    --server=GATEWAY_IP_ADDRESS  \
    --hog --uri="/zone" --port 80  --wsess=100000,1,1 --rate 30'
The generator takes up to 5 minutes to generate traffic for the dashboard.
View your Cloud Ops dashboard.
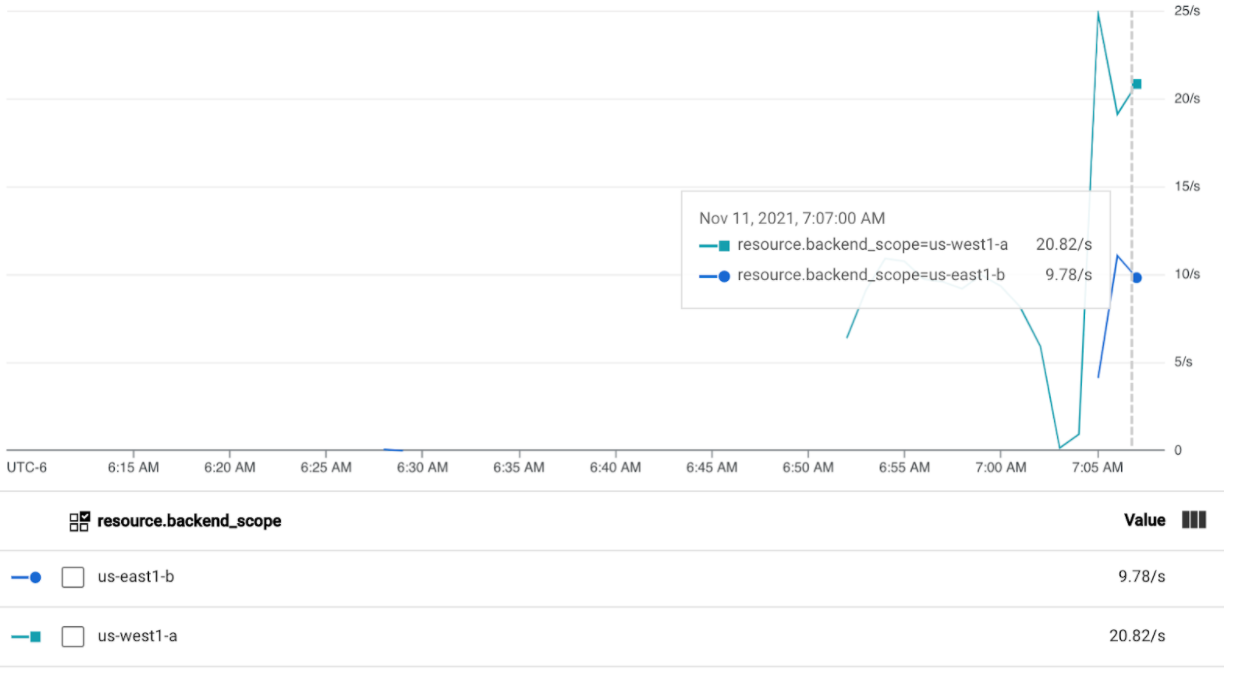
You should see that approximately 20 RPS is being sent to
us-west1-aand 10 RPS tous-east1-b. This indicates that the Service ingke-west-1is fully utilized and is overflowing 10 RPS of traffic to the Service ingke-east-1.Stop the load generator using Ctrl+C, then delete the Pod:
kubectl delete pod loadgen --context gke-west-1
Test with 60 RPS
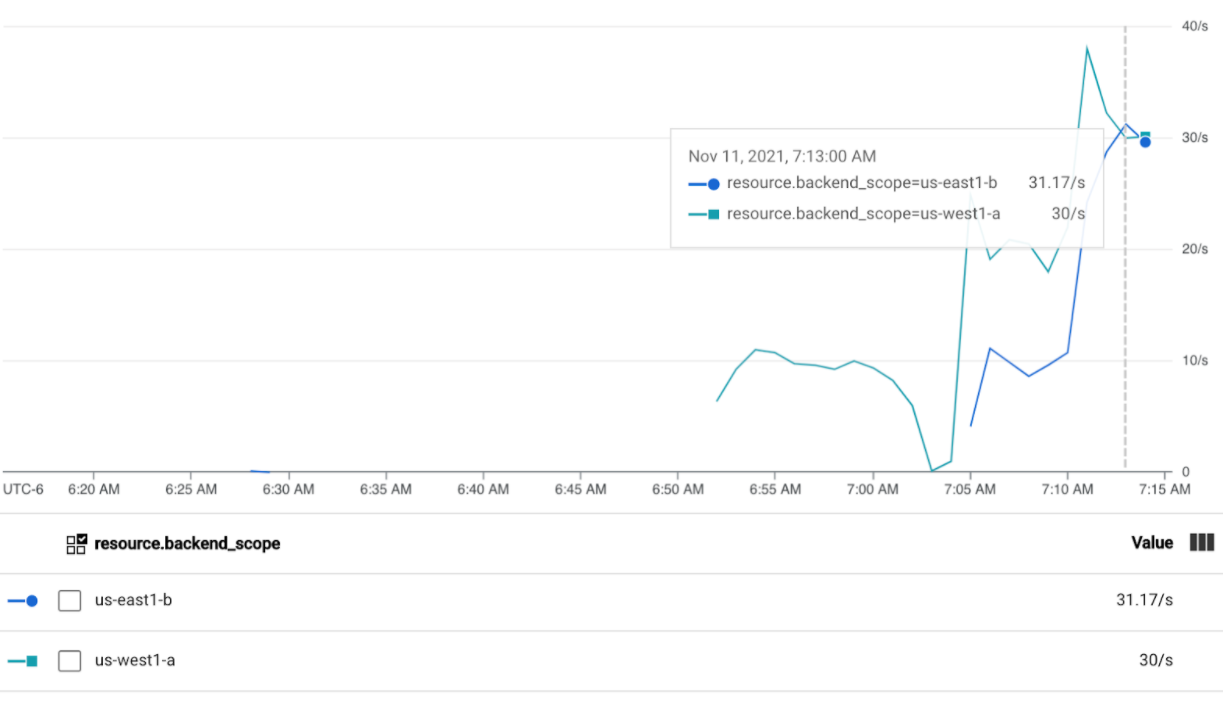
Deploy the load generator configured to send 60 RPS:
kubectl run --context gke-west-1 -i --tty --rm loadgen  \
    --image=cyrilbkr/httperf  \
    --restart=Never  \
    -- /bin/sh -c 'httperf  \
    --server=GATEWAY_IP_ADDRESS  \
    --hog --uri="/zone" --port 80  --wsess=100000,1,1 --rate 60'
Wait 5 minutes and view your Cloud Ops dashboard. It should now show that both clusters are receiving roughly 30 RPS. Since all Services are overutilized globally, there is no traffic spillover and Services absorb all the traffic they can.
Stop the load generator using Ctrl+C, then delete the Pod:
kubectl delete pod loadgen --context gke-west-1
Clean up
After completing the exercises on this document, follow these steps to remove resources and prevent unwanted charges incurring on your account:
Unregister the clusters from the fleet if they don't need to be registered for another purpose.
Disable the
multiclusterservicediscoveryfeature:gcloud container fleet multi-cluster-services disableDisable Multi Cluster Ingress:
gcloud container fleet ingress disableDisable the APIs:
gcloud services disable \
    multiclusterservicediscovery.googleapis.com \
    multiclusteringress.googleapis.com \
    trafficdirector.googleapis.com \
    --project=PROJECT_ID
Troubleshooting
No healthy upstream
Symptom:
The following issue might occur when you create a Gateway but cannot access the backend services (503 response code):
no healthy upstream
Reason:
This error message indicates that the health check prober cannot find healthy backend services. It is possible that your backend services are healthy but you might need to customize the health checks.
Workaround:
To resolve this issue, customize your health check based on your application's
requirements (for example, /health) using a HealthCheckPolicy.
What's next
- Learn more about the Gateway controller.