
本頁說明如何設定 Google Distributed Cloud 叢集,將使用者應用程式的自訂記錄和指標傳送至 Cloud Logging、Cloud Monitoring 和 Google Cloud Managed Service for Prometheus。
為獲得最佳使用者應用程式記錄和監控體驗,我們強烈建議您使用下列設定:
將
Stackdriver物件中的enableGMPForApplications設為true,即可啟用 Google Cloud Managed Service for Prometheus。這項設定可讓您使用 Prometheus 監控工作負載並接收快訊。如需操作說明和詳細資訊,請參閱本頁面的「啟用 Google Cloud Managed Service for Prometheus」一節。如要為使用者應用程式啟用 Cloud Logging,請在
Stackdriver物件中將enableCloudLoggingForApplications設為true。這項設定可為工作負載提供記錄功能。如需操作說明和詳細資訊,請參閱本頁的「為使用者應用程式啟用 Cloud Logging」。
啟用 Google Cloud Managed Service for Prometheus
Google Cloud Managed Service for Prometheus 的設定是在名為 stackdriver 的 Stackdriver 物件中指定。如需最佳做法和疑難排解等其他資訊,請參閱 Google Cloud Managed Service for Prometheus 說明文件。
如要設定 stackdriver 物件來啟用 Google Cloud Managed Service for Prometheus,請按照下列步驟操作:
開啟要編輯的 stackdriver 物件:
kubectl --kubeconfig=CLUSTER_KUBECONFIG \
    --namespace kube-system edit stackdriver stackdriver
將
CLUSTER_KUBECONFIG替換為叢集 kubeconfig 檔案的路徑。在「
spec」下方,將「enableGMPForApplications」設為「true」:apiVersion: addons.gke.io/v1alpha1 kind: Stackdriver metadata: name: stackdriver namespace: kube-system spec: projectID: ... clusterName: ... clusterLocation: ... proxyConfigSecretName: ... enableGMPForApplications: true enableVPC: ... optimizedMetrics: true儲存並關閉編輯過的檔案。
Google 代管的 Prometheus 元件會自動在
gmp-system命名空間的叢集中啟動。檢查 Google 管理的 Prometheus 元件:
kubectl --kubeconfig=CLUSTER_KUBECONFIG --namespace gmp-system get pods這個指令會輸出類似以下的結果:
NAME                              READY   STATUS    RESTARTS        AGE
collector-abcde                   2/2     Running   1 (5d18h ago)   5d18h
collector-fghij                   2/2     Running   1 (5d18h ago)   5d18h
collector-klmno                   2/2     Running   1 (5d18h ago)   5d18h
gmp-operator-68d49656fc-abcde     1/1     Running   0               5d18h
rule-evaluator-7c686485fc-fghij   2/2     Running   1 (5d18h ago)   5d18h
Google Cloud Managed Service for Prometheus 支援規則評估和快訊。如要設定規則評估,請參閱「規則評估」。
執行範例應用程式
代管服務提供範例應用程式的資訊清單,該應用程式會在 metrics 通訊埠發布 Prometheus 指標。prom-example這個應用程式使用三個副本。
如要部署應用程式,請按照下列步驟操作:
為您在範例應用程式中建立的資源建立
gmp-test命名空間:kubectl --kubeconfig=CLUSTER_KUBECONFIG create ns gmp-test使用下列指令套用應用程式資訊清單:
kubectl -n gmp-test apply \
    -f https://raw.githubusercontent.com/GoogleCloudPlatform/prometheus-engine/v0.4.1/examples/example-app.yaml
設定 PodMonitoring 資源
在本節中,您將設定PodMonitoring自訂資源,擷取範例應用程式發出的指標資料,並傳送至 Google Cloud Managed Service for Prometheus。PodMonitoring自訂資源
會使用目標抓取作業。在本例中,收集器代理程式會擷取範例應用程式發出資料的 /metrics 端點。
PodMonitoring 自訂資源只會抓取所部署命名空間內的目標。如要抓取多個命名空間內的目標,必須在每個命名空間部署相同的PodMonitoring自訂資源。您可以執行下列指令,確認 PodMonitoring 資源已安裝在目標命名空間:
kubectl --kubeconfig CLUSTER_KUBECONFIG get podmonitoring -A
如要查看所有 Google Cloud Managed Service for Prometheus 自訂資源的參考說明文件,請參閱 prometheus-engine/doc/api reference。
下列資訊清單會在 gmp-test 命名空間中定義 PodMonitoring 資源 prom-example。這項資源會找出命名空間中含有 app 標籤且值為 prom-example 的所有 Pod。系統每 30 秒會透過 /metrics HTTP 路徑的 metrics 通訊埠,抓取相符 Pod 的資料。
apiVersion: monitoring.googleapis.com/v1
kind: PodMonitoring
metadata:
  name: prom-example
spec:
  selector:
    matchLabels:
      app: prom-example
  endpoints:
  - port: metrics
    interval: 30s
執行下列指令來套用這項資源:
kubectl --kubeconfig CLUSTER_KUBECONFIG -n gmp-test apply \
    -f https://raw.githubusercontent.com/GoogleCloudPlatform/prometheus-engine/v0.4.1/examples/pod-monitoring.yaml
Google Cloud Managed Service for Prometheus 現在會擷取相符的 Pod。
查詢指標資料
如要驗證 Prometheus 資料是否已匯出,最簡單的方法是在 Google Cloud 控制台的 Metrics Explorer 中使用 PromQL 查詢。
如要執行 PromQL 查詢,請按照下列步驟操作:
前往 Google Cloud 控制台的「Monitoring」頁面,或按一下下列按鈕:
在導覽窗格中,選取「Metrics Explorer」
 。
。使用 Prometheus 查詢語言 (PromQL) 指定要在圖表上顯示的資料:
在「選取指標」窗格的工具列中,選取「程式碼編輯器」。
在「語言」切換按鈕中選取「PromQL」。語言切換按鈕位於「程式碼編輯器」窗格底部。
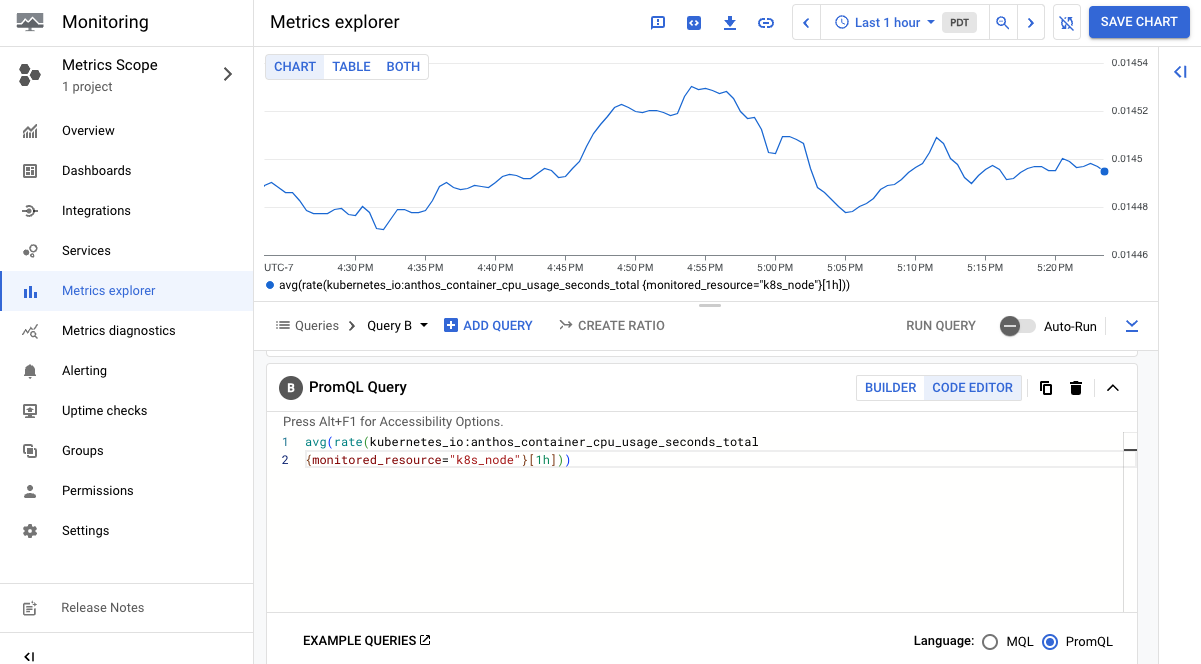
在查詢編輯器中輸入查詢。舉例來說,如要繪製過去一小時內 CPU 在每種模式下所花費的平均秒數,請使用下列查詢:
avg(rate({
  "__name__"="kubernetes.io/anthos/container/cpu/core_usage_time",
  "monitored_resource"="k8s_container"}[1h]))
如要進一步瞭解如何使用 PromQL,請參閱「在 Cloud Monitoring 中使用 PromQL」。
下方的螢幕截圖是圖表,顯示 kubernetes.io/anthos/container/cpu/core_usage_time 指標:
如果收集的資料量很大,您可能需要篩選匯出的指標,藉此降低成本。
為使用者應用程式啟用 Cloud Logging
Cloud Logging 和 Cloud Monitoring 的設定會儲存在名為 stackdriver 的 Stackdriver 物件中。
開啟要編輯的 stackdriver 物件:
kubectl --kubeconfig=CLUSTER_KUBECONFIG \
    --namespace kube-system edit stackdriver stackdriver
將
CLUSTER_KUBECONFIG替換為使用者叢集 kubeconfig 檔案的路徑。在
spec部分中,將enableCloudLoggingForApplications設為true:apiVersion: addons.gke.io/v1alpha1 kind: Stackdriver metadata: name: stackdriver namespace: kube-system spec: projectID: ... clusterName: ... clusterLocation: ... proxyConfigSecretName: ... enableCloudLoggingForApplications: true enableVPC: ... optimizedMetrics: true儲存並關閉編輯過的檔案。
執行範例應用程式
在本節中,您將建立可寫入自訂記錄的應用程式。
將下列 Deployment 資訊清單儲存至名為
my-app.yaml的檔案。apiVersion: apps/v1 kind: Deployment metadata: name: "monitoring-example" namespace: "default" labels: app: "monitoring-example" spec: replicas: 1 selector: matchLabels: app: "monitoring-example" template: metadata: labels: app: "monitoring-example" spec: containers: - image: gcr.io/google-samples/prometheus-dummy-exporter:latest name: prometheus-example-exporter imagePullPolicy: Always command: - /bin/sh - -c - ./prometheus-dummy-exporter --metric-name=example_monitoring_up --metric-value=1 --port=9090 resources: requests: cpu: 100m建立 Deployment
kubectl --kubeconfig CLUSTER_KUBECONFIG apply -f my-app.yaml
查看應用程式記錄檔
控制台
前往 Google Cloud 控制台的「Logs Explorer」。
按一下「資源」。在「ALL RESOURCE TYPES」(所有資源類型) 選單中,選取「Kubernetes Container」(Kubernetes 容器)。
在「CLUSTER_NAME」CLUSTER_NAME下方,選取使用者叢集的名稱。
在「NAMESPACE_NAME」下方,選取「default」。
按一下「新增」,然後點選「執行查詢」。
在「Query results」(查詢結果) 下方,您可以看到
monitoring-exampleDeployment 的記錄項目。例如:{ "textPayload": "2020/11/14 01:24:24 Starting to listen on :9090\n", "insertId": "1oa4vhg3qfxidt", "resource": { "type": "k8s_container", "labels": { "pod_name": "monitoring-example-7685d96496-xqfsf", "cluster_name": ..., "namespace_name": "default", "project_id": ..., "location": "us-west1", "container_name": "prometheus-example-exporter" } }, "timestamp": "2020-11-14T01:24:24.358600252Z", "labels": { "k8s-pod/pod-template-hash": "7685d96496", "k8s-pod/app": "monitoring-example" }, "logName": "projects/.../logs/stdout", "receiveTimestamp": "2020-11-14T01:24:39.562864735Z" }
gcloud CLI
執行下列指令:
gcloud logging read 'resource.labels.project_id="PROJECT_ID" AND \
    resource.type="k8s_container" AND resource.labels.namespace_name="default"'
將
PROJECT_ID替換為專案 ID。在輸出內容中,您可以看到
monitoring-example部署作業的記錄項目。例如:insertId: 1oa4vhg3qfxidt labels: k8s-pod/app: monitoring-example k8s- pod/pod-template-hash: 7685d96496 logName: projects/.../logs/stdout receiveTimestamp: '2020-11-14T01:24:39.562864735Z' resource: labels: cluster_name: ... container_name: prometheus-example-exporter location: us-west1 namespace_name: default pod_name: monitoring-example-7685d96496-xqfsf project_id: ... type: k8s_container textPayload: | 2020/11/14 01:24:24 Starting to listen on :9090 timestamp: '2020-11-14T01:24:24.358600252Z'
篩選應用程式記錄
應用程式記錄檔篩選功能可減少應用程式記錄檔的帳單費用,以及叢集到 Cloud Logging 的網路流量。從 Google Distributed Cloud 1.15.0 版開始,如果 enableCloudLoggingForApplications 設為 true,您可以依下列條件篩選應用程式記錄:
- Pod 標籤 (
podLabelSelectors) - 命名空間 (
namespaces) - 記錄內容的規則運算式 (
contentRegexes)
Google Distributed Cloud 只會將篩選結果傳送至 Cloud Logging。
定義應用程式記錄篩選器
Logging 的設定是在名為 stackdriver 的 Stackdriver 物件中指定。
開啟
stackdriver物件進行編輯:kubectl --kubeconfig USER_CLUSTER_KUBECONFIG --namespace kube-system \ edit stackdriver stackdriver將 USER_CLUSTER_KUBECONFIG 替換為使用者叢集 kubeconfig 檔案的路徑。
在
spec中新增appLogFilter區段:apiVersion: addons.gke.io/v1alpha1 kind: Stackdriver metadata: name: stackdriver namespace: kube-system spec: enableCloudLoggingForApplications: true projectID: ... clusterName: ... clusterLocation: ... appLogFilter: keepLogRules: - namespaces: - prod ruleName: include-prod-logs dropLogRules: - podLabelSelectors: - disableGCPLogging=yes ruleName: drop-logs儲存並關閉編輯過的檔案。
(選用) 如果您使用
podLabelSelectors,請重新啟動stackdriver-log-forwarderDaemonSet,盡快套用變更:kubectl --kubeconfig USER_CLUSTER_KUBECONFIG --namespace kube-system \ rollout restart daemonset stackdriver-log-forwarder通常 10 分鐘後,
podLabelSelectors就會生效。重新啟動 DaemonSetstackdriver-log-forwarder可讓變更更快生效。
範例:僅在 prod 命名空間中加入 ERROR 或 WARN 記錄
以下範例說明應用程式記錄篩選器的運作方式。您定義的篩選器會使用命名空間 (prod)、規則運算式 (.*(ERROR|WARN).*) 和 Pod 標籤 (disableGCPLogging=yes)。接著,如要驗證篩選器是否正常運作,請在 prod 命名空間中執行 Pod,測試這些篩選條件。
如要定義及測試應用程式記錄篩選器,請按照下列步驟操作:
在 Stackdriver 物件中指定應用程式記錄篩選器:
在下列
appLogFilter範例中,系統只會保留prod命名空間中的ERROR或WARN記錄。系統會捨棄標籤為disableGCPLogging=yes的 Pod 記錄:apiVersion: addons.gke.io/v1alpha1 kind: Stackdriver metadata: name: stackdriver namespace: kube-system spec: ... appLogFilter: keepLogRules: - namespaces: - prod contentRegexes: - ".*(ERROR|WARN).*" ruleName: include-prod-logs dropLogRules: - podLabelSelectors: - disableGCPLogging=yes # kubectl label pods pod disableGCPLogging=yes ruleName: drop-logs ...在
prod命名空間中部署 Pod,然後執行指令碼,產生ERROR和INFO記錄檔項目:kubectl --kubeconfig USER_CLUSTER_KUBECONFIG run pod1 \ --image gcr.io/cloud-marketplace-containers/google/debian10:latest \ --namespace prod --restart Never --command -- \ /bin/sh -c "while true; do echo 'ERROR is 404\\nINFO is not 404' && sleep 1; done"篩選後的記錄檔應只包含
ERROR項目,不應包含INFO項目。將標籤
disableGCPLogging=yes新增至 Pod:kubectl --kubeconfig USER_CLUSTER_KUBECONFIG label pods pod1 \ --namespace prod disableGCPLogging=yes經過篩選的記錄不應再包含
pod1Pod 的任何項目。
應用程式記錄篩選器 API 定義
應用程式記錄檔篩選器的定義會在 stackdriver 自訂資源定義中宣告。
如要取得 Stackdriver 自訂資源定義,請執行下列指令:
kubectl --kubeconfig USER_CLUSTER_KUBECONFIG get crd stackdrivers.addons.gke.io \
    --namespace kube-system -o yaml