
在 Google Distributed Cloud (GDC) 气隙式设备项目中创建提醒规则后,您可以从项目的系统监控实例的用户界面 (UI) 查询和查看信息中心上的提醒 或通过 GDC 可观测性 HTTP API 查询提醒。
在信息中心内查询和查看提醒
您可以在 platform-obs 项目的项目中的系统监控实例。platform-obs
系统监控实例包含项目级指标、日志和提醒,可用于执行网络监控和服务器监控等监控流程。
准备工作
在查询和查看信息中心内的提醒之前,您必须先获取系统监控实例的访问权限。如需了解详情,请参阅获取信息中心访问权限。
如需登录并直观呈现提醒,请让您的项目 IAM 管理员为您授予 Project Grafana Viewer (project-grafana-viewer) 角色。借助此基于角色的访问权限控制流程,您可以安全地访问数据可视化图表。
系统监控实例端点
对于应用运营商 (AO):
打开以下网址以访问项目的端点:
https://GDC_URL/PROJECT_NAMESPACE/grafana
替换以下内容:
- GDC_URL:您组织在 GDC 中的网址。
- PROJECT_NAMESPACE:项目的命名空间。
项目的界面包含默认信息中心,例如包含有关提醒信息的提醒 - 概览信息中心。通过界面查询提醒,您可以直观地从项目中检索提醒信息,并获得资源集成视图,以便及时了解和快速解决问题。
对于平台管理员 (PA):
打开以下网址以访问 platform-obs 项目的端点:
https://GDC_URL/platform-obs/grafana
将 GDC_URL 替换为您组织在 GDC 中的网址。
系统监控实例的用户界面 (UI) 包含默认信息中心,例如“提醒 - 概览”信息中心,其中包含有关数据可观测性提醒的信息。通过界面查询提醒,您可以直观地从项目中检索提醒信息,并获得资源集成视图,以便及时了解和快速解决问题。

图 1. Grafana 界面上的提醒 - 概览信息中心。
Alertmanager
借助 Alertmanager,您可以监控来自客户端应用的提醒通知。您可以使用 Alertmanager 检查和关闭提醒,以及过滤或分组提醒:
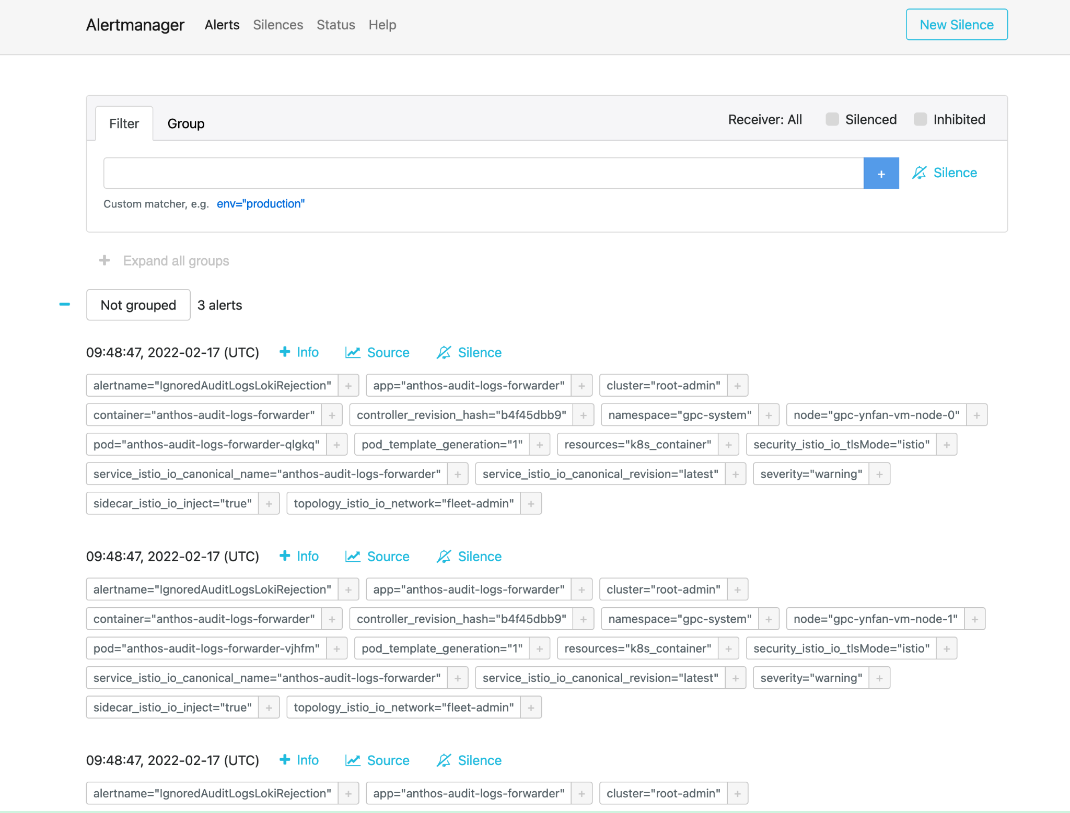
图 2. 用于从 Alertmanager 查询审核日志的菜单选项。
预定义的提醒政策
下表列出了 Prometheus 中的预安装提醒规则:
| 名称 | 说明 |
|---|---|
| KubeAPIDown(关键) | KubeAPI 已从 Prometheus 目标发现中消失了 15 分钟。 |
| KubeClientErrors(警告) | Kubernetes API 服务器客户端错误率超过 0.01,持续 15 分钟。 |
| KubeClientErrors(严重) | Kubernetes API 服务器客户端错误率超过 0.1,持续 15 分钟。 |
| KubePodCrashLooping(警告) | Pod 处于崩溃循环状态的时长已超过 15 分钟。 |
| KubePodNotReady(警告) | Pod 处于非就绪状态的时长已超过 15 分钟。 |
| KubePersistentVolumeFillingUp(严重) | 已声明的 PersistentVolume 的可用字节数小于 0.03。 |
| KubePersistentVolumeFillingUp(警告) | 已声明的 PersistentVolume 的可用字节数小于 0.15。 |
| KubePersistentVolumeErrors(严重) | 永久性卷处于“失败”或“待处理”阶段达到 5 分钟。 |
| KubeNodeNotReady(警告) | 节点处于未就绪状态超过 15 分钟。 |
| KubeNodeCPUUsageHigh(关键) | 节点 CPU 使用率超过 80%。 |
| KubeNodeMemoryUsageHigh(关键) | 节点内存用量超过 80%。 |
| NodeFilesystemSpaceFillingUp(警告) | 节点文件系统使用量超过 60%。 |
| NodeFilesystemSpaceFillingUp(严重) | 节点文件系统使用量超过 85%。 |
| CertManagerCertExpirySoon(警告) | 证书将于 21 天后过期。 |
| CertManagerCertNotReady(严重) | 在 10 分钟后,证书尚未准备好处理流量。 |
| CertManagerHittingRateLimits(严重) | 创建和续订证书达到速率限制已有 5 分钟。 |
| DeploymentNotReady(严重)。 | 组织管理员集群上的 Deployment 处于非就绪状态的时长已超过 15 分钟。 |
示例 alertmanagerConfigurationConfigmaps
alertmanagerConfigurationConfigmaps 列出的 ConfigMap 中的配置的语法必须遵循 https://prometheus.io/docs/alerting/latest/configuration/
apiVersion: observability.gdc.goog/v1alpha1
kind: ObservabilityPipeline
metadata:
  # Choose namespace that matches the project's namespace
  namespace: kube-system
  name: observability-config
# Configure Alertmanager
 alerting:
  # Storage size for alerting data within organization
  # Permission: PA
  localStorageSize: 1Gi

  # Permission: PA & AO
  # alertmanager config must be under the key "alertmanager.yml" in the configMap
  alertmanagerConfig: <configmap-for-alertmanager-config>

  # Permission: PA
  volumes:
    - <volume referenced in volumeMounts>

  # Permission: PA
  volumeMounts:
    - <volumeMount referenced in alertmanagerConfig>
规则配置示例
# Configures either an alert or a target record for precomputation
apiVersion: monitoring.gdc.goog/v1alpha1
kind: MonitoringRule
metadata:
  # Choose namespace that contains the metrics that rules are based on
  # Note: alert/record will be produced in the same namespace
  namespace: g-fleetns-a
  name: alerting-config
spec:
  # Rule evaluation interval
  interval: <duration>

  # Configure limit for number of alerts (0: no limit)
  # Optional, Default: 0 (no limit)
  limit: <int>

  # Configure record rules
  recordRules:
    # Define which timeseries to write to (must be a valid metric name)
  - record: <string>

    # Define PromQL expression to evaluate for this rule
    expr: <string>

    # Define labels to add or overwrite
    # Optional, Map of {key, value} pairs
    labels:
      <labelname>: <labelvalue>

  # Configure alert rules
  alertRules:
    # Define alert name
  - alert: <string>

    # Define PromQL expression to evaluate for this rule
    # https://prometheus.io/docs/prometheus/latest/configuration/alerting_rules/
    expr: <string>

    # Define when an active alert moves from pending to firing
    # Optional, Default: 0s
    for: <duration>

    # Define labels to add or overwrite
    # Required, Map of {key, value} pairs
    # Required labels:
    #     severity: [error, critical, warning, info]
    #     code:
    #     resource: component/service/hardware related to alert
    #     additional labels are optional
    labels:
      severity: <enum: [error, critical, warning, info]>
      code:
      resource: <Short name of the related operable component>
      <labelname>: <tmpl_string>

    # Define annotations to add
    # Optional, Map of {key, value} pairs
    # Recommended annotations:
    #     message: value of Message field in UI
    #     expression: value of Rule field in UI
    #     runbookurl: URL for link in Actions to take field in UI
    annotations:
      <labelname>: <tmpl_string>
# Configures either an alert or a target record for precomputation
apiVersion: logging.gdc.goog/v1alpha1
kind: LoggingRule
metadata:
  # Choose namespace that contains the logs that rules are based on
  # Note: alert/record will be produced in the same namespace
  namespace: g-fleetns-a
  name: alerting-config
spec:
  # Choose which log source to base alerts on (Operational/Audit/Security Logs)
  # Optional, Default: Operational
  source: <string>

  # Rule evaluation interval
  interval: <duration>

  # Configure limit for number of alerts (0: no limit)
  # Optional, Default: 0 (no limit)
  limit: <int>

  # Configure record rules
  recordRules:
    # Define which timeseries to write to (must be a valid metric name)
  - record: <string>

    # Define LogQL expression to evaluate for this rule
    # https://grafana.com/docs/loki/latest/rules/
    expr: <string>

    # Define labels to add or overwrite
    # Optional, Map of {key, value} pairs
    labels:
      <labelname>: <labelvalue>

  # Configure alert rules
  alertRules:
    # Define alert name
  - alert: <string>

    # Define LogQL expression to evaluate for this rule
    expr: <string>

    # Define when an active alert moves from pending to firing
    # Optional, Default: 0s
    for: <duration>

    # Define labels to add or overwrite
    # Required, Map of {key, value} pairs
    # Required labels:
    #     severity: [error, critical, warning, info]
    #     code:
    #     resource: component/service/hardware related to alert
    #     additional labels are optional
    labels:
      severity: <enum: [error, critical, warning, info]>
      code:
      resource: <Short name of the related operable component>
      <labelname>: <tmpl_string>

    # Define annotations to add
    # Optional, Map of {key, value} pairs
    # Recommended annotations:
    #     message: value of Message field in UI
    #     expression: value of Rule field in UI
    #     runbookurl: URL for link in Actions to take field in UI
    annotations:
      <labelname>: <tmpl_string>
通过 HTTP API 查询提醒
可观测性平台公开了一个 HTTP API 端点,用于查询和读取项目中的指标、提醒和其他时序数据,以进行系统监控。直接通过 Observability HTTP API 查询提醒,以根据您的使用情形设置自动化任务、调整响应和构建集成。例如,将输出插入到其他命令中,将详细信息导出为文本文件格式,或配置 Linux cron 作业。您可以通过命令行界面 (CLI) 或网络浏览器调用 Observability HTTP API,并以 JSON 格式获取结果。
本部分介绍了如何使用API 规范从 CLI 调用 Observability HTTP API 端点来查询提醒。
直接通过 Observability HTTP API 查询提醒,以根据您的使用情形设置自动化任务、调整响应和构建集成。例如,将输出插入到其他命令中,将详细信息导出为文本文件格式,或配置 Linux cron 作业。您可以通过命令行界面 (CLI) 或网络浏览器调用 Observability HTTP API,并以 JSON 格式获取结果。
本部分介绍了如何使用 Alertmanager API 规范从 CLI 调用 Observability HTTP API 端点来查询指标。
准备工作
如需获得访问 Observability HTTP API 端点所需的权限,请让项目 IAM 管理员在您的项目命名空间中向您授予 Project Cortex Alertmanager Viewer (project-cortex-alertmanager-viewer) 角色。
项目 IAM 管理员可以通过创建角色绑定来授予您访问权限:
a. Infrastructure Operator (IO) Root-Admin - Project Cortex Alertmanager Viewer:
kubectl --kubeconfig $HOME/root-admin-kubeconfig create rolebinding
io-cortex-alertmanager-viewer-binding -n infra-obs
--user=fop-infrastructure-operator@example.com
--role=project-cortex-alertmanager-viewer
b. 平台管理员 (PA) 根管理员 - Project Cortex Alertmanager Viewer:
kubectl --kubeconfig $HOME/root-admin-kubeconfig create rolebinding
pa-cortex-alertmanager-viewer-binding -n platform-obs
--user=fop-platform-admin@example.com
--role=project-cortex-alertmanager-viewer
c. 应用操作员 (AO) Root-Admin - Project Cortex Alertmanager Viewer: 项目:$AO_PROJECT AO 用户名:$AO_USER
kubectl --kubeconfig $HOME/root-admin-kubeconfig create rolebinding
project-cortex-alertmanager-viewer-binding -n $AO_PROJECT
--user=$AO_USER
--role=project-cortex-alertmanager-viewer
创建角色绑定后,您可以使用登录用户名访问相应的 Alertmanager。
验证角色绑定
kubectl --kubeconfig $HOME/org-1-admin-kubeconfig get rolebinding -n platform-obs
如需了解如何通过 GDC 控制台设置角色绑定,请参阅授予对资源的访问权限。
Cortex 端点
以下网址是用于访问提醒的 Cortex 端点:
https://GDC_URL/PROJECT_NAME/cortex/alertmanager/
替换以下内容:
- GDC_URL:您组织在 GDC 中的网址。
- PROJECT_NAME:您的项目的名称。
调用 API 端点
按照以下步骤从 CLI 访问 Cortex API 端点并查询提醒:
- 确保您满足前提条件。
- 打开 CLI。
使用
curl工具调用 Cortex 端点网址,并使用标准 https://prometheus.io/docs/prometheus/latest/querying/api/#alertmanagers 扩展该网址,以查询提醒。例如:curl https://console.org-1.zone1.google.gdch.test/alice/cortex/alertmanager/api/v1/alertmanagers
您可以在 CLI 中获得以下命令的输出。API 响应格式为 JSON。