

This page provides an overview of the pipeline lifecycle from pipeline code to a Dataflow job.
This page explains the following concepts:
- What an execution graph is, and how an Apache Beam pipeline becomes a Dataflow job
- How Dataflow handles errors
- How Dataflow automatically parallelizes and distributes the processing logic in your pipeline to the workers performing your job
- Job optimizations that Dataflow might make
Execution graph
When you run your Dataflow pipeline, Dataflow
creates an execution graph from the code that constructs your Pipeline object,
including all of the transforms and their associated processing functions, such
as DoFn objects. This is the pipeline execution graph, and the phase is called
graph construction time.
During graph construction, Apache Beam locally executes the code from the
main entry point of the pipeline code, stopping at the calls to a source, sink,
or transform step, and turning these calls into nodes of the graph.
Consequently, a piece of code in a pipeline's entry point (Java and Go main
method or the top-level of a Python script) locally executes on the machine that
runs the pipeline. The same code declared in a method of a DoFn object
executes in the Dataflow workers.
For example, the WordCount sample included with the Apache Beam SDKs contains a series of transforms to read, extract, count, format, and write the individual words in a collection of text, along with an occurrence count for each word. The following diagram shows how the transforms in the WordCount pipeline are expanded into an execution graph:
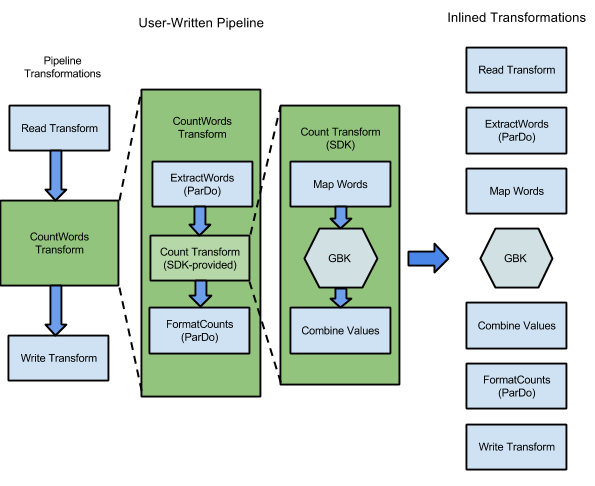
Figure 1: WordCount example execution graph
The execution graph often differs from the order in which you specified your transforms when you constructed the pipeline. This difference exists because the Dataflow service performs various optimizations and fusions on the execution graph before it runs on managed cloud resources. The Dataflow service respects data dependencies when executing your pipeline. However, steps without data dependencies between them might run in any order.
To see the unoptimized execution graph that Dataflow has generated for your pipeline, select your job in the Dataflow monitoring interface. For more information about viewing jobs, see Use the Dataflow monitoring interface.
During graph construction, Apache Beam validates that any resources referenced by the pipeline, such as Cloud Storage buckets, BigQuery tables, and Pub/Sub topics or subscriptions, actually exist and are accessible. The validation is done through standard API calls to the respective services, so it's vital that the user account used to run a pipeline has proper connectivity to the necessary services and is authorized to call the APIs of the services. Before submitting the pipeline to the Dataflow service, Apache Beam also checks for other errors, and ensures that the pipeline graph doesn't contain any illegal operations.
The execution graph is then translated into JSON format, and the JSON execution graph is transmitted to the Dataflow service endpoint.
The Dataflow service then validates the JSON execution graph. When the graph is validated, it becomes a job on the Dataflow service. You can see your job, its execution graph, status, and log information by using the Dataflow monitoring interface.
Java
The Dataflow service sends a response to the machine where you run
your Dataflow program. This response is encapsulated in the object
DataflowPipelineJob, which contains the jobId of your Dataflow job.
Use the jobId to monitor, track, and troubleshoot your job by using the
Dataflow monitoring interface
and the Dataflow command-line interface.
For more information, see the
API reference for DataflowPipelineJob.
Python
The Dataflow service sends a response to the machine where you run
your Dataflow program. This response is encapsulated in the object
DataflowPipelineResult, which contains the job_id of your Dataflow job.
Use the job_id to monitor, track, and troubleshoot your job
by using the
Dataflow monitoring interface
and the
Dataflow command-line interface.
Go
The Dataflow service sends a response to the machine where you run
your Dataflow program. This response is encapsulated in the object
dataflowPipelineResult, which contains the jobID of your Dataflow job.
Use the jobID to monitor, track, and troubleshoot your job
by using the
Dataflow monitoring interface
and the
Dataflow command-line interface.
Graph construction also happens when you execute your pipeline locally, but the graph is not translated to JSON or transmitted to the service. Instead, the graph is run locally on the same machine where you launched your Dataflow program. For more information, see Configuring PipelineOptions for local execution.
Error and exception handling
Your pipeline might throw exceptions while processing data. Some of these errors are transient, such as temporary difficulty accessing an external service. Other errors are permanent, such as errors caused by corrupt or unparseable input data, or null pointers during computation.
Dataflow processes elements in arbitrary bundles, and retries the complete bundle when an error is thrown for any element in that bundle. When running in batch mode, bundles that include a failing item are retried four times. The pipeline fails completely when a single bundle has failed four times. When running in streaming mode, a bundle that includes a failing item is retried indefinitely, which might cause your pipeline to permanently stall.
When processing in batch mode, you might see a large number of individual failures before a pipeline job fails completely, which happens when any given bundle fails after four retry attempts. For example, if your pipeline attempts to process 100 bundles, Dataflow could generate several hundred individual failures until a single bundle reaches the four-failure condition for exit.
Startup worker errors, like failure to install packages on the workers, are transient. This scenario results in indefinite retries, and might cause your pipeline to permanently stall.
Parallelization and distribution
The Dataflow service automatically parallelizes and distributes
the processing logic in your pipeline across workers and threads.
Dataflow uses the abstractions in the
programming model to represent
parallel processing functions. For example, ParDo transforms cause
Dataflow to distribute processing code, represented by DoFn
objects, to multiple workers to be executed concurrently.
Dataflow supports two complementary dimensions of parallelism:
- Horizontal parallelism: Pipeline data is split and processed across multiple worker instances concurrently, managed dynamically using Horizontal Autoscaling.
- Vertical parallelism: Pipeline data is processed across multiple CPU cores and threads on each worker VM, managed using dynamic thread scaling and Vertical Autoscaling.
Dataflow automatically manages job parallelism, handles dynamic work rebalancing, and optimizes the execution graph through fusion and combine optimizations. Factors such as non-splittable data sources, high fan-out steps, key skew, and downstream sink limits can constrain pipeline parallelism.
For an in-depth guide on how Dataflow partitions data, scales workers, and resolves parallelism bottlenecks, see Understanding parallelism in Dataflow.
Fusion optimization
After the JSON form of your pipeline execution graph has been validated, the
Dataflow service might modify the graph to perform optimizations.
Optimizations can include fusing multiple steps or transforms in your
pipeline's execution graph into single steps. Fusing steps prevents the
Dataflow service from needing to materialize every intermediate
PCollection in your pipeline, which can be costly in terms of memory and
processing overhead.
Although all the transforms you specify in your pipeline construction are executed on the service, to ensure the most efficient execution of your pipeline, the transforms might be executed in a different order or as part of a larger fused transform. The Dataflow service respects data dependencies between the steps in the execution graph, but otherwise steps might be executed in any order.
Fusion example
The following diagram shows how the execution graph from the WordCount example included with the Apache Beam SDK for Java might be optimized and fused by the Dataflow service for efficient execution:
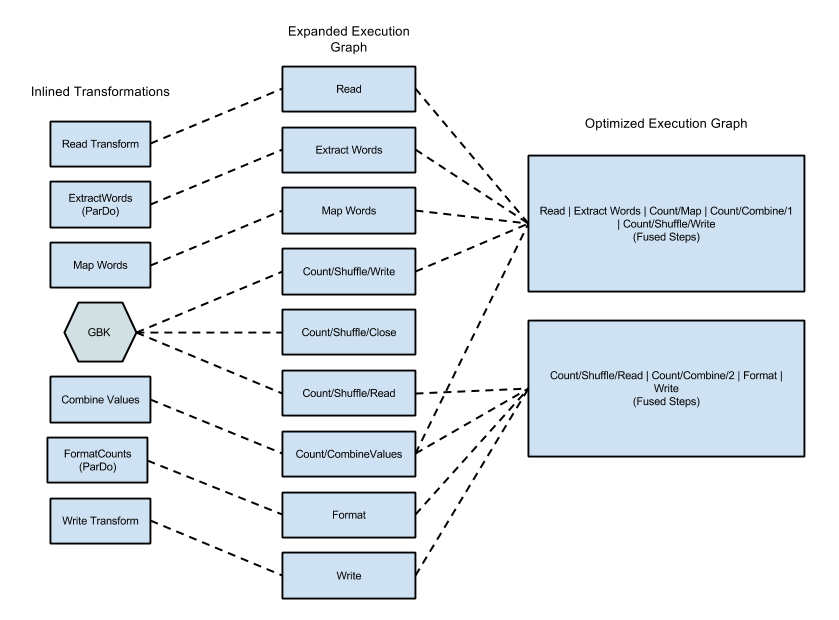
Figure 2: WordCount Example Optimized Execution Graph
Prevent fusion
In some cases, Dataflow might incorrectly guess the
optimal way to fuse operations in the pipeline, which can limit
Dataflow's ability to use all available workers. In such cases,
you can give a hint to Dataflow to redistribute the data, by using
a Redistribute transform.
To add a Redistribute transform, call one of the following methods:
Redistribute.arbitrarily: Indicates the data is likely to be imbalanced. Dataflow chooses the best algorithm to redistribute the data.Redistribute.byKey: Indicates that aPCollectionof key-value pairs is likely to be imbalanced and should be redistributed based on the keys. Typically, Dataflow co-locates all elements of a single key on the same worker thread. However, co-location of keys is not guaranteed, and the elements are processed independently.
If your pipeline contains a Redistribute transform, Dataflow
usually prevents fusion of the steps before and after the Redistribute
transform, and shuffles the data so that the steps downstream of the
Redistribute transform have more optimal parallelism.
Monitor fusion
You can access your optimized graph and fused stages in the Google Cloud console, by using the gcloud CLI, or by using the API.
Console
To view your graph's fused stages and steps in the console, in the Execution details tab for your Dataflow job, open the Stage workflow graph view.
To see the component steps that are fused for a stage, in the graph, click the fused stage. In the Stage info pane, the Component steps row displays the fused stages. Sometimes portions of a single composite transform are fused into multiple stages.
gcloud
To access your optimized graph and fused stages by using the
gcloud CLI, run the following gcloud command:
gcloud dataflow jobs describe --full JOB_ID --format json
Replace JOB_ID with the ID of your Dataflow job.
To extract the relevant bits, pipe the output of the gcloud command to jq:
gcloud dataflow jobs describe --full JOB_ID --format json | jq '.pipelineDescription.executionPipelineStage\[\] | {"stage_id": .id, "stage_name": .name, "fused_steps": .componentTransform }'
To see the description of the fused stages in the output response file, within the
ComponentTransform
array, see the
ExecutionStageSummary
object.
API
To access your optimized graph and fused stages by using the API, call
project.locations.jobs.get.
To see the description of the fused stages in the output response file, within the
ComponentTransform
array, see the
ExecutionStageSummary
object.
Combine optimization
Aggregation operations are an important concept in large-scale data processing.
Aggregation brings together data that's conceptually far apart, making it
extremely useful for correlating. The Dataflow programming model represents aggregation operations as the GroupByKey, CoGroupByKey, and
Combine transforms.
Dataflow's aggregation operations combine data across the entire
dataset, including data that might be spread across multiple workers. During such
aggregation operations, it's often most efficient to combine as much data
locally as possible before combining data across instances. When you apply a
GroupByKey or other aggregating transform, the Dataflow service
automatically performs partial combining locally before the main grouping
operation.
When performing partial or multi-level combining, the Dataflow service makes different decisions based on whether your pipeline is working with batch or streaming data. For bounded data, the service favors efficiency and will perform as much local combining as possible. For unbounded data, the service favors lower latency, and might not perform partial combining, because it might increase latency.