This page covers GPU metrics supported in Dataflow. You can use these metrics to monitor the health and use of the GPU. Most metrics are supported on all Dataflow jobs, but some metrics require additional configuration for many GPU models.
Prerequisites
GPU metrics are only collected by Dataflow jobs that have explicitly requested GPUs. For more information, see GPU support.
Overview
While Dataflow reports many GPU metrics, the main metrics are total and used memory, which are equivalent to RAM metrics, and Streaming Multiprocessor (SM) Activity and SM Occupancy, which are the closest equivalents to Dataflow CPU metrics. More metrics are covered under common metrics and GPM metrics.
The total and used memory of every GPU device on the job are reported by default. In the Dataflow monitoring interface, these appear under "Basic GPU utilization". These metrics aren't the same as "Memory access percentage", which is also under basic GPU metrics, but reports the percentage of time that GPU device memory was being accessed.
SM Activity and SM Occupancy are GPM metrics. These metrics aren't supported on P4 and P100 devices, and are supported by default on H100 devices and later. For all other devices, such as T4 and L4 devices, additional setup is necessary. For steps to enable them, see GPM collection. If collected on the job, these metrics are under "GPU GPM utilization" in the Dataflow monitoring interface.
Dataflow GPU metric basics
All GPU metrics are sent by Dataflow workers to
Cloud Monitoring. Per-device metrics can be found under
dataflow.googleapis.com/worker/accelerator/gpu. All of these metrics are
grouped into general categories, such as utilization or temperature, and they
all have the following labels:
- device_uuid: Uniquely identifies the GPU device regardless of worker or pipeline.
- device_number: The number assigned to the device on the worker in the range of [0, N), where N is the number of GPU devices on the worker.
- device_model: The model of the GPU, such as "Tesla T4".
Both device_uuid and device_model are independent of the worker and are
always the same for the same physical device. The device_number is tied to how
it's identified on that worker.
Common GPU metrics for Dataflow
Common metrics are reported by every Dataflow job with GPUs. In Monitoring, they all use the following format:
dataflow.googleapis.com/worker/accelerator/gpu/CATEGORY/NAME
The following table shows each metric and its category, name, unit, and purpose.
| Metric | Category | Name | Unit | Description |
|---|---|---|---|---|
| Kernel Running Percentage | utilization | device_kernel_runtime | Percent | The percentage of time that at least one kernel was running on the GPU. This only shows that the GPU was being used, not if its processing resources are being used efficiently. |
| Memory Access Percentage | utilization | device_memory_access | Percent | The percentage of time that device memory was being read or written. This only shows that memory was being accessed, not the percentage of memory in use. |
| Memory Limit | memory | device_limit | MiB | The amount of memory available on the GPU. |
| Memory Usage | memory | device_usage | MiB | The amount of memory in use by the GPU. This includes both the memory used by the Dataflow job and the memory reserved for firmware, so some usage is expected even if no memory was transferred to the GPU yet. |
| Correctable Volatile ECC Errors | memory/ecc/volatile | device_correctable_total | Count | The number of correctable (single-bit) ECC errors since the last driver reload. For Dataflow, the driver reload only happens on worker startup, so this is equivalent to errors over the worker's lifetime. |
| Uncorrectable Volatile ECC Errors | memory/ecc/volatile | device_uncorrectable_total | Count | The number of uncorrectable (double-bit) ECC errors since the last driver reload. For Dataflow, the driver reload only happens on worker startup, so this is equivalent to errors over the worker's lifetime. |
| Power Limit | power | device_limit | Watts | The maximum amount of power that the device is set to use. Dataflow does not change this from the default. |
| Power Usage | power | device_usage | Watts | The amount of power in use by the device. |
| Current Temperature | temperature | device_current | Celsius | The current temperature of the GPU. |
| Max Operating Temperature | temperature | device_max_op | Celsius | The temperature that the GPU should stay under. If the current temperature exceeds this, then the GPU drivers will attempt to cool the GPU until it is under this temperature. Dataflow does not control this. |
| Slowdown Temperature | temperature | device_slowdown | Celsius | The temperature at which the GPU will start throttling. If the current temperature exceeds this, then you should expect to see a performance degradation until it cools off. Dataflow does not control this. |
| Shutdown Temperature | temperature | device_shutdown | Celsius | The temperature at which the GPU will shut off. If the current temperature exceeds this, then the device will become unavailable. Dataflow does not control this temperature, nor does it make an active attempt to recover GPUs that have shut down due to excessively high temperature. |
| Current SM Clock | clock | device_sm_current | MHz | The current speed of the SM clock. If the temperature exceeds the slowdown threshold, then this may go down as part of cooling-related throttling. |
| Max SM Clock | clock | device_sm_max | MHz | The max speed of the SM clock. |
| Current Memory Clock | clock | device_memory_current | MHz | The current speed of the memory clock. If the temperature exceeds the slowdown threshold, then this may go down as part of cooling-related throttling. |
| Max Memory Clock | clock | device_memory_max | MHz | The max speed of the memory clock. |
GPM metrics for Dataflow
Dataflow offers some support for GPM metrics. The level of support depends on the GPU model and on the accelerator configuration. By default, most Dataflow jobs with GPUs will require some additional configuration.
GPM metrics follow the same basics as common metrics.
Supported metrics
Similar to the common metrics, GPM metric paths have the following format:
dataflow.googleapis.com/worker/accelerator/gpu/CATEGORY/NAME
Some of these metrics are under the same category as some common metrics.
| Metric | Category | Name | Unit | Description |
|---|---|---|---|---|
| SM Activity | utilization | device_sm_activity | Percent | The percentage of time a warp was active on the SM averaged across all SMs on the device. This is similar to the Kernel Running Percentage, but it offers a more granular picture that better shows if the GPU's resources are being used efficiently. NVIDIA defines effective use as 80% or more, with 50% or less being ineffective use. |
| SM Occupancy | utilization | device_sm_occupancy | Percent | The percent of active warps on the device relative to the max. Memory-limited jobs should have higher occupancy than compute-limited jobs, and the Memory Access Percentage metric can provide insight on this. More details can be found in NVIDIA documentation on achieved occupancy. |
| Tensor Pipe Activity | utilization | device_tensor_pipe_activity | Percent | The percentage of time that the Tensor Core pipe was in use. Higher values indicate more usage of the GPU's Tensor Cores, which are important to matrix operations. |
| FP64 Pipe Activity | utilization | device_fp64_pipe_activity | Percent | The percentage of time that the FP64 Core pipe was in use. Higher values indicate more usage of the GPU's FP64 Cores, which handle scalar operations of 64-bit floating point values. |
| FP32 Pipe Activity | utilization | device_fp32_pipe_activity | Percent | The percentage of time that the FP32 Core pipe was in use. Higher values indicate more usage of the GPU's FP32 Cores, which handle scalar operations of 32-bit floating point values. |
| FP16 Pipe Activity | utilization | device_fp16_pipe_activity | Percent | The percentage of time that the FP16 pipe was in use. Unlike FP64 and FP32, which are associated with 64-bit and 32-bit CUDA cores respectively, FP16 is associated with taking advantage of Tensor cores' half-precision capabilities. |
| PCIe Read | pcie | device_read | MiB/s | The rate of data read by the GPU from the host VM over PCIe. |
| PCIe Transfer | pcie | device_transfer | MiB/s | The rate of data transfer from the GPU to the host VM over PCIe. |
| NVLink Read | nvlink | device_read | MiB/s | The rate of data read by the GPU over NVLink. Since NVLink only covers GPU-to-GPU communication, this is irrelevant if each worker only has a single GPU. |
| NVLink Transfer | nvlink | device_transfer | MiB/s | The rate of data transfer from the GPU over NVLink. Since NVLink only covers GPU-to-GPU communication, this is irrelevant if each worker only has a single GPU. |
Collecting GPM metrics
Any Dataflow job with GPUs using Hopper architecture or later (e.g. H100, H100 Mega) collect GPM metrics by default, so no additional configuration is needed. However, jobs using Pascal architecture or earlier (such as P4 and P100) don't support these metrics.
For all other models, collecting these metrics requires adding
install-gke-dcgm-exporter to the worker accelerator configuration. For
example:
--experiment="worker_accelerator=type:TYPE;count:COUNT;install-nvidia-driver;install-gke-dcgm-exporter"
This flag installs a GKE-managed equivalent to the NVIDIA DCGM-exporter. The following types support this option:
- nvidia-l4
- nvidia-tesla-a100
- nvidia-a100-80gb
- nvidia-tesla-t4
- nvidia-tesla-v100
If another type is provided, the Dataflow service returns an error on job creation. This check helps you avoid running the container on jobs where it doesn't help with metric collection.
Legacy Metrics
In Monitoring, you might see two metrics named
dataflow.googleapis.com/job/gpu_utilization and
dataflow.googleapis.com/job/gpu_memory_utilization. These metrics are similar
to Kernel Running Percentage and Memory Access Percentage
respectively, but workers report them by averaging across GPUs on the worker. We
recommend using the per-device equivalents, especially if workers are configured
to have more than one GPU.
Dataflow UI
If the Dataflow job has GPUs attached to its workers, then metrics should appear in the "Job Metrics" tab on the job page, under the "Dataflow ML" category. This category doesn't appear on jobs without GPUs, and takes a few seconds to load, because it first verifies that the metrics are relevant to the job.
The following subcategories appear under "Dataflow ML":
| Sub-Category | Metrics | Conditions |
|---|---|---|
| Basic GPU utilization | Kernel Running PercentageMemory Access PercentageTotal/Used Memory | All GPU jobs |
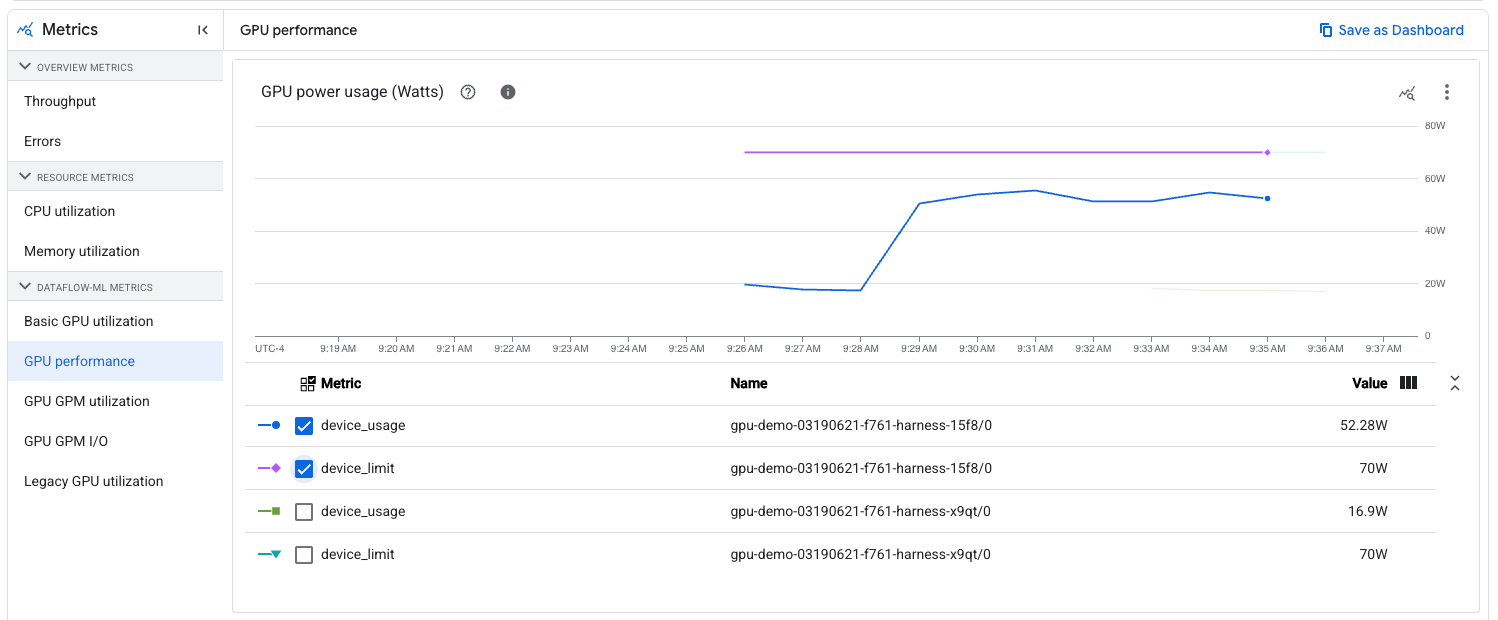
| GPU performance | Power Draw/LimitTemperature Reading/LimitsCurrent/Max SM ClockCurrent/Max Memory ClockCorrectable/Uncorrectable Volatile ECC Errors | All GPU jobs |
| GPU GPM utilization | SM ActivitySM OccupancyCUDA/Tensor pipe activity | GPM metrics enabled |
| GPU GPM I/O | PCIe Read/TransferNVLink Read/Transfer | GPM metrics enabled |
| Legacy GPU utilization | Legacy Metrics | All GPU jobs |
When viewing non-legacy metrics, you can filter the charts to a specific worker name and GPU device number. The worker name is the same name as the VM if viewed under Compute Engine. The GPU device number is the same one from the metric labels. You can use this filtering to check metrics on a specific GPU device, such as seeing how close its power usage is relative to its limit: