

In streaming pipelines, a slow step or transform can constrain throughput and cause backlog propagation, increasing overall job latency. The Dataflow bottleneck detector automatically identifies and highlights the specific steps causing backlogs in the Google Cloud Console, helping you quickly diagnose and resolve execution delays without trial-and-error debugging.
For a conceptual overview of how Dataflow identifies bottlenecks and propagates backlogs, see About the Dataflow bottleneck detector.
Before you begin
Before you use the bottleneck detector for troubleshooting, make sure your job and project meet the following requirements:
- You have a running streaming Dataflow job.
- Your job is run using Streaming Engine. Bottleneck detection is not supported for jobs that don't run on Streaming Engine.
- You have the Identity and Access Management (IAM) permissions required to view Dataflow jobs. For more information, see Dataflow IAM roles.
View active bottlenecks in the Google Cloud Console
You can view active bottleneck notifications and alerts directly in the Dataflow monitoring interface.
In the Google Cloud Console, go to the Dataflow page.
In the jobs list, select your streaming job to open the job details page.
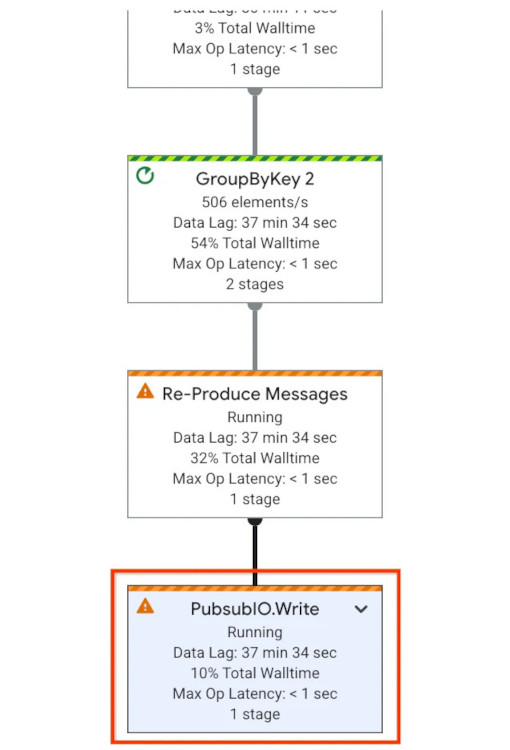
Under the Job graph tab, review the execution graph:
- Steps experiencing active bottlenecks display a colored warning or alert icon.
- An alert indicates that a processing delay of more than five minutes has occurred at this step.
Click the step that displays the warning icon.
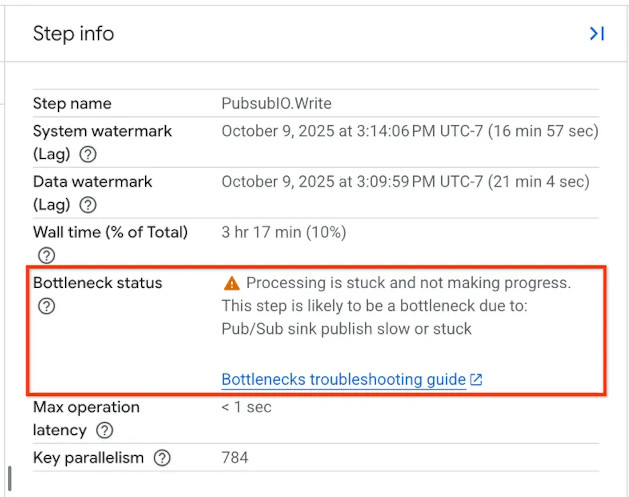
In the Step Info panel on the right side of the screen, locate the Bottlenecks section. This section displays:
- The kind of bottleneck. For example, falling behind, backlog is steady, or stuck.
- The likely cause, if identified by the diagnostic engine.
- The duration and related diagnostic details.
Resolve bottleneck causes
To resolve a bottleneck, identify the likely cause in the Step Info panel and follow the step-by-step guidance for the cause in Troubleshoot bottlenecks.
Monitor bottlenecks with Monitoring
If you want to set up programmatic alerting or view bottleneck activity over time, use Monitoring. The bottleneck detector exports the following metrics:
dataflow.googleapis.com/job/is_bottleneck: A boolean value indicating whether the stage is an active bottleneck, along with labels specifying the kind of bottleneck and the likely cause.dataflow.googleapis.com/job/backlogged_keys: The number of keys backed up in the bottlenecked stage.dataflow.googleapis.com/job/recommended_parallelism: The recommended parallelism value to alleviate the bottleneck in the affected stage.
For information on creating charts and alerts using these metrics, see Use Monitoring for Dataflow.
What's next
- Learn more about the Dataflow bottleneck detector concepts.
- Follow the general guide to Troubleshoot and debug Dataflow pipelines.